From 1983 to 1999, the CBO issued two-year forecasts that added up to a 2.7% growth rate, which would now be widely dismissed as a “rosy” forecast. Yet actual growth averaged 3.7% from 1983 to 1999 – a full percentage point higher – despite a recession in 1991. Today, the CBO forecasts that even 2.7% economic growth is impossible, and claims only 1.9% is within reach.
The Administration thinks the economy can grow a percentage point faster. The 2019 Budget estimates the economy will grow by 2.9% a year for ten years. The Committee for a Responsible Budget (CFRB) argues that this “strains credulity, especially if interest rates and inflation also remain under control, as the budget predicts they will.” [This appears to suggest higher inflation would be good for growth.]
“Given population aging and other economic fundamentals,” says the CFRB, “the United States is likely to ultimately achieve growth of 2 percent per year or perhaps less – not 3 percent. The Federal Reserve projects long-term sustained growth of 1.8 percent per year [1.7–2.2%], and the Blue Chip average for sustained growth is only slightly higher at 2.1 percent. Prior to the tax deal, CBO projected a long-run growth rate of 1.9 percent.”
Is the OMB unrealistic to estimate the economy can grow by 2.9% a year or is the CBO unrealistic to assume it can’t grow faster than 1.9%?
The real contest here is between current OMB projections after the tax deal, and CBO projections “prior to the tax deal.” Fed and Blue Chip forecasts are unofficial and unpersuasive.
The Federal Reserve does not make official long-term projections. The quarterly FOMC Summary of Economic Projections (SEP) defines “longer-run projections” as rates of growth to which “a policymaker expects the economy to converge over time – maybe in five or six years.” Last December 13, the 19 survey participants thought that after five or six years real GDP would settle down to 1.7% to 2.2%, but that is not a ten-year average since growth in the previous five or six years might be rapid.
Blue Chip Indicators collect monthly forecasts from over 50 business economists (I used to be one of them). It constructs a “consensus” by averaging a possibly wide array of different estimates. All such frequently-revised forecasts are most reliable as lagging indicators – becoming pessimistic after economic news turns bad and optimistic after things pick up. The models and techniques used to make monthly or quarterly forecasts have no predictive power at all beyond two quarters, if that.
What about the CBO? Their projection of 1.9% growth is a full percentage point below that of the Trump administration. Could the CBO possibly be that far off? Sure. They’ve done it before.
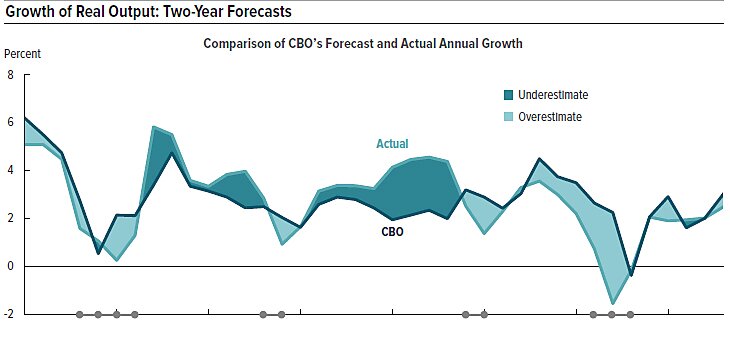
From 1983 to 2000, the CBO’s two-year forecasts of real GDP growth were exactly one percentage point too low, on average. A two-year forecast for 1983–84 was made in 1983 and combined estimated growth rates for both years, so the fact that 2‑year growth rates kept being underestimated repeatedly in all but two years (1990 and 1991) from 1983 to 2000 was a triumph of theory over experience.
The graph, from “The CBO’s Economic Forecasting Record,” shows the CBO systematically underestimated growth of real GDP after the Reagan tax rate reductions were phased in during 1983–84 and 1988–90 (TRA86), and again after the capital gains tax was slashed from 28% to 20% in 1997. Conversely, the CBO overestimated GDP growth after Bush 41 raised tax rates in 1990, after Obama raised tax rates in 2013, and during the high-tax bracket creep years of 1976–82. The CBO appears to suffer from a pro-tax estimating bias – assuming higher tax rates do no harm, and lower tax rates do no good.
The CBO argues that its “five-year forecasts of output and inflation are more accurate than its two-year forecasts of those variables, in part because long-term forecasts rest more on underlying trends in the economy than on short-term cyclical movements, which are very difficult to predict.” Unfortunately, CBO five-year forecasts also underestimated real GDP growth in all but one 5‑year period between 1981–1985 and 1999–2003. The exception was 1987–91, when the CBO estimate proved slightly optimistic (0.28%) thanks to recession on the heels of the ill-fated Bush 41 “tax increase.” A single mild recession (aggravated by higher taxes) can’t explain why the CBO consistently underestimated the 4.4% rate of real GDP growth for seven years from 1983 to 1989, or the same 4.4% pace for four years from 1996 to 2000.
A recent paper, “How CBO Produces Its 10-Year Economic Forecast” explains that “CBO projects potential TFP on the basis of historical trends in TFP growth. However, projecting trends in TFP is particularly challenging because it is, by definition, a measure of unexplained growth in output.” On the contrary, extrapolating “historical trends” is just lazy, not “challenging.”
The so-called “economic fundamentals” the CFRB mentioned essentially consist of projecting recent trends into the future. That means assuming output per hour (productivity) keeps growing at the anemic 1.3% pace of 2006 to 2015, and that hours worked grow at half that rate because labor force participation is assumed (“projected”) to remain extremely depressed and most part-timers are assumed to reject longer hours.
If you add 1.3% projected growth of productivity to 0.6% projected growth of the labor force, you end up with a 1.9% limit on potential economic growth (slower than 2010–2017 when the economy grew at a 2.2%). But productivity and labor force participation depend on incentives, not past trends. And incentives to invest and work just changed dramatically.
We know that the CBO is perfectly capable of underestimating economic growth by a full percentage point over a 10-year period since it already managed to do that over a 17-year period. If history is any guide, the CBO’s 1.9% long-term forecast is once again much too low, as it has been whenever the highest tax rates on income and/or capital gains were reduced.
