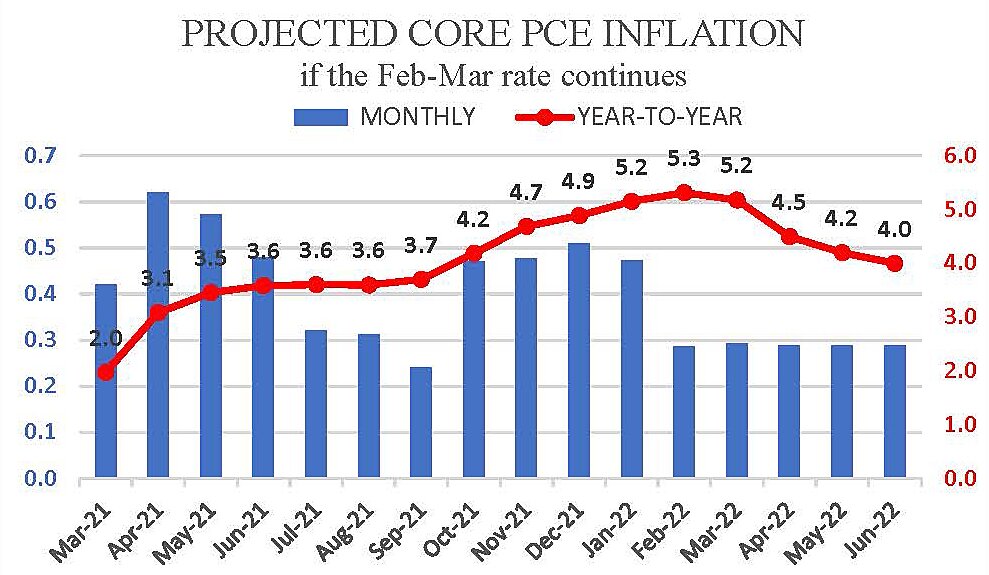
Core inflation slowed substantially in February and March to less than 0.3% a month (.029%). The core personal consumption expenditures (PCE) price index rose more slowly this March than it did a year ago (as shown by the blue bars in the graph).
The backward-looking year-to-year price change nonetheless still appeared misleadingly high this March (5.2%) because of rapid price increases last year – during the second and fourth quarters.
The red line in the graph projects that if the February to March monthly pace continues for the next three months, the year-to-year increase in core PCE inflation would slow from 5.2% in March to 4.5% in April, 4.2% in May and 4% in June.
If monthly gains of 0.29% continued for twelve months, core inflation would average 3.5%. Monthly changes could turn either lower or higher, of course, but recent experience is compelling evidence of moderation rather than acceleration.
The Fed has always stressed that it focuses primarily on “core” inflation (which excludes some but not all food and energy prices). That distinction is particularly essential right now because Russian war and sanctions have clearly boosted world oil and grain prices.
In a March 16 press conference Federal Reserve Chairman Jay Powell said, “Really what we’re looking for … is month‐by‐month inflation coming down.”
On May 3–4, when the Federal Open Market Committee (FOMC) meets to contemplate a series of sizable increases in the federal funds rate, one hopes they will take notice of the fact that month-by-month core inflation has been coming down.
