A Wall Street Journal report, “Colleges Pull Back Tuition’s Long Rise,” includes a graph showing the cumulative increases in consumer price indexes (CPI) since 1990 for College Tuition, Medical Care, and All Consumer Prices.
Adding up nearly three decades of increases looks dramatic, but doesn’t show when various prices changes accelerated or slowed. More important, prices for college tuition and medical care are dominated by skilled human services, so they should be properly compared with service prices in general rather than with all items.
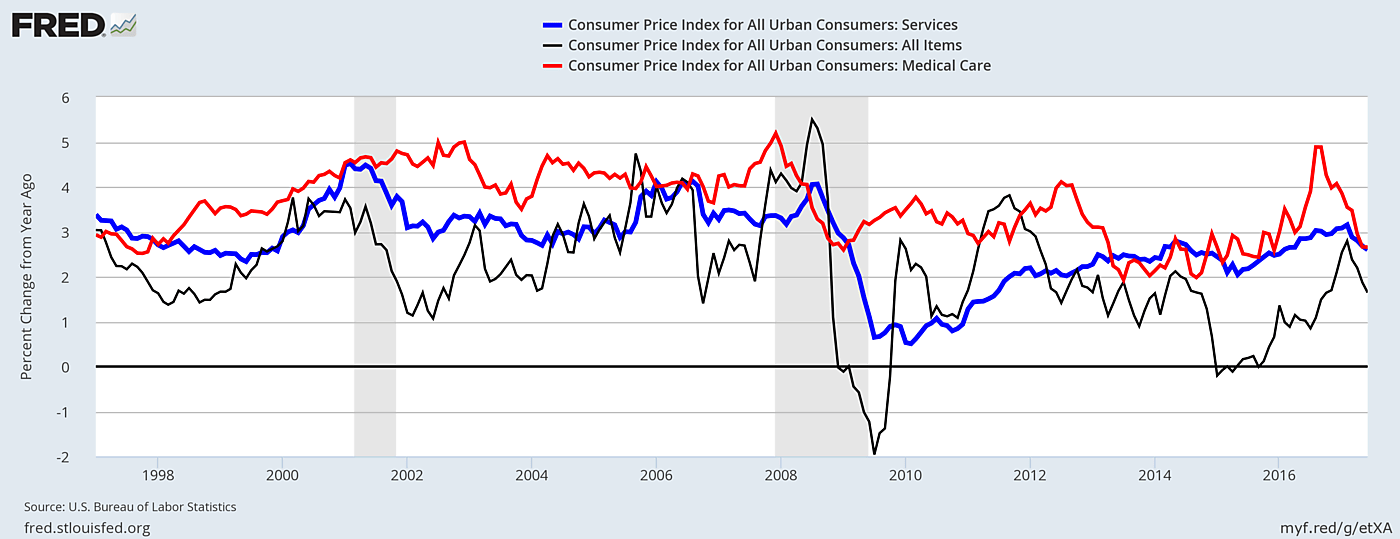
All Consumer Prices (shown as an erratic black line in the graph) includes falling quality-adjusted prices for such tech products as computers and televisions, for example, and cyclically-volatile prices of internationally traded commodities such as oil, steel, and grain.
Service prices largely reflect wages and benefits for skilled labor, which (unlike commodity prices) almost never fall. If service prices did not increase faster than the CPI in general, then real compensation in service sectors could never rise.
This graph omits college tuition because that CPI item is particularly problematic due to averaging large differences in quality and “financial aid” (selective discounts from sticker prices). The Bureau of Labor Statistics explains some of the difficulties:
“The inclusion of financial aid has added to the complexity of pricing college tuition. Many selected students may have full scholarships (such as athletic), and therefore their tuition and fixed fees are fully covered by scholarships. Since these students pay no tuition and fees, they are not eligible for pricing. In addition, there are other students who pay a very small fee to the college since the majority of their tuition and fixed fees are covered by scholarships. When these situations are priced by BLS Field Staff, normal increases in tuition/fees and minor declines in scholarship awards can provide extremely large changes for entry in the CPI index. For some of these same quotes, minor tuition declines or minor scholarship award increases can actually result in negative prices, which make the quotes ineligible for use in the CPI.”
The graph compares two decades of year-to-year price increases for Medical Care and Services in general. The CPI for medical services alone (not shown in the graph) has actually increased somewhat less than the CPI for all Medical Care, which suggests prices of drugs and medical devices increased faster than physician and hospital fees. There have been major improvements in the quality of drugs and medical devices, however, and economists doubt the CPI adequately adjusts for quality improvement. As a BEA report notes, “If there are unobserved attributes that change over time (e.g. perceived efficacy or experience with the drug), these indexes will count any price increases associated with these changes as increases in price, not quality.”
Have Medical Care prices risen faster than Services prices in general? Yes, but the difference in annualized price increases was typically smaller than one percentage point except in 2002 and 2010, when recession’s aftermath depressed other services prices more than (heavily-subsidized) medical care prices.
Recessions’ impact on commodity prices pushed the year-to-year overall CPI below zero at times, which underscores the inaptness of comparing prices of medical or educational services to any price index such as the CPI which is heavily weighted by goods.
