Global Science Report is a feature from the Center for the Study of Science, where we highlight one or two important new items in the scientific literature or the popular media. For broader and more technical perspectives, consult our monthly “Current Wisdom.”
—
Nic Lewis and Judith Curry just published a blockbuster paper that pegs the earth’s equilibrium climate sensitivity—how much the earth’s average surface temperature is expected to rise in association with a doubling of the atmosphere’s carbon dioxide concentration—at 1.64°C (1.05°C to 4.05°C, 90% range), a value that is nearly half of the number underpinning all of President Obama’s executive actions under his Climate Action Plan.
This finding will not stop the President and the EPA from imposing more limits on greenhouse-gas emissions from fossil fuels. A wealth of similar findings have appeared in the scientific literature beginning in 2011 (see below) and they, too, have failed to dissuade him from his legacy mission.
The publication of the Lewis and Curry paper, along with another by Ragnhild Skeie and colleagues, brings the number of recent low-sensitivity climate publications to 14, by 42 authors from around the world (this doesn’t count our 2002 paper on the topic, “Revised 21st Century Temperature Projections”). Most of these sensitivities are a good 40% below the average climate sensitivity of the models used by the U.N.’s Intergovernmental Panel on Climate Change (IPCC).
Lewis and Curry arrive at their lower equilibrium climate sensitivity estimate by using updated compilations of the earth’s observed temperature change, oceanic heat uptake, and the magnitude of human emissions, some of which should cause warming (e.g., greenhouse gases), while the others should cool (e.g., sulfate aerosols). They try to factor out “natural variability.” By comparing values of these parameters from the mid-19 century to now, they can estimate how much the earth warmed in association with human greenhouse gas emissions.
The estimate is not perfect, as there are plenty of uncertainties, some of which may never be completely resolved. But, nevertheless, Lewis and Curry have generated a very robust observation-based estimate of the equilibrium climate sensitivity.
For those interested in the technical details, and a much more thorough description of the research, author Nic Lewis takes you through the paper (here) has made a pre-print copy of the paper freely available (here).
In the chart below, we’ve added the primary findings of Lewis and Curry as well as those of Skeie et al. to the collection of 12 other low-sensitivity papers published since 2010 that conclude that the best estimate for the earth’s climate sensitivity lies below the IPCC estimates. We’ve also included in our Figure both the IPCC’s subjective and model-based characteristics of the equilibrium climate sensitivity. For those wondering, there are very few recent papers arguing that the IPCC estimates are too low, and they all have to contend with the fact that, according to new Cato scholar Ross McKitrick, “the pause” in warming is actually 19 years in length.
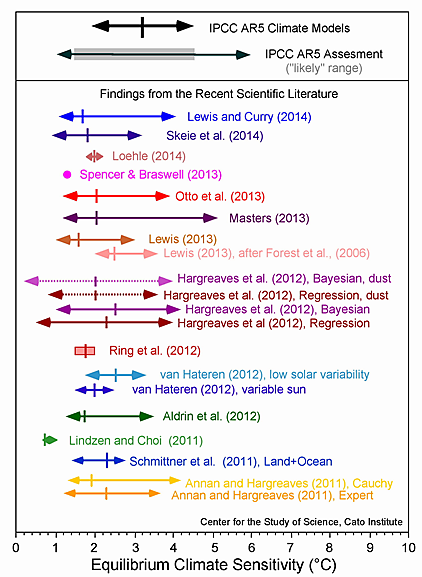
Figure 1. Climate sensitivity estimates from new research beginning in 2011 (colored), compared with the assessed range given in the Intergovernmental Panel on Climate Change (IPCC) Fifth Assessment Report (AR5) and the collection of climate models used in the IPCC AR5. The “likely” (greater than a 66% likelihood of occurrence)range in the IPCC Assessment is indicated by the gray bar. The arrows indicate the 5 to 95 percent confidence bounds for each estimate along with the best estimate (median of each probability density function; or the mean of multiple estimates; colored vertical line). Ring et al. (2012) present four estimates of the climate sensitivity and the red box encompasses those estimates. The right-hand side of the IPCC AR5 range is actually the 90% upper bound (the IPCC does not actually state the value for the upper 95 percent confidence bound of their estimate). Spencer and Braswell (2013) produce a single ECS value best-matched to ocean heat content observations and internal radiative forcing.
References:
Aldrin, M., et al., 2012. Bayesian estimation of climate sensitivity based on a simple climate model fitted to observations of hemispheric temperature and global ocean heat content. Environmetrics, doi: 10.1002/env.2140.
Annan, J.D., and J.C Hargreaves, 2011. On the generation and interpretation of probabilistic estimates of climate sensitivity. Climatic Change, 104, 324–436.
Hargreaves, J.C., et al., 2012. Can the Last Glacial Maximum constrain climate sensitivity? Geophysical Research Letters, 39, L24702, doi: 10.1029/2012GL053872
Lewis, N. 2013. An objective Bayesian, improved approach for applying optimal fingerprint techniques to estimate climate sensitivity. Journal of Climate, doi: 10.1175/JCLI-D-12–00473.1.
Lewis, N. and J.A. Curry, C., 2014. The implications for climate sensitivity of AR5 focring and heat uptake estimates. Climate Dynamic, 10.1007/s00382-014‑2342‑y.
Lindzen, R.S., and Y‑S. Choi, 2011. On the observational determination of climate sensitivity and its implications. Asia-Pacific Journal of Atmospheric Science, 47, 377–390.
Loehle, C., 2014. A minimal model for estimating climate sensitivity. Ecological Modelling, 276, 80–84.
Masters, T., 2013. Observational estimates of climate sensitivity from changes in the rate of ocean heat uptake and comparison to CMIP5 models. Climate Dynamics, doi:101007/s00382-013‑1770‑4
McKitrick, R., 2014. HAC-Robust Measurement of the Duration of a Trendless Subsample in a Global Climate Time Series. Open Journal of Statistics, 4, 527–535. doi: 10.4236/ojs.2014.47050.
Michaels. P.J. et al., 2002. Revised 21st century temperature projections. Climate Research, 23, 1–9.
Otto, A., F. E. L. Otto, O. Boucher, J. Church, G. Hegerl, P. M. Forster, N. P. Gillett, J. Gregory, G. C. Johnson, R. Knutti, N. Lewis, U. Lohmann, J. Marotzke, G. Myhre, D. Shindell, B. Stevens, and M. R. Allen, 2013. Energy budget constraints on climate response. Nature Geoscience, 6, 415–416.
Ring, M.J., et al., 2012. Causes of the global warming observed since the 19th century. Atmospheric and Climate Sciences, 2, 401–415, doi: 10.4236/acs.2012.24035.
Schmittner, A., et al. 2011. Climate sensitivity estimated from temperature reconstructions of the Last Glacial Maximum. Science, 334, 1385–1388, doi: 10.1126/science.1203513.
Skeie, R. B., T. Berntsen, M. Aldrin, M. Holden, and G. Myhre, 2014. A lower and more constrained estimate of climate sensitivity using updated observations and detailed radiative forcing time series. Earth System Dynamics, 5, 139–175.
Spencer, R. W., and W. D. Braswell, 2013. The role of ENSO in global ocean temperature changes during 1955–2011 simulated with a 1D climate model. Asia-Pacific Journal of Atmospheric Science, doi:10.1007/s13143-014‑0011‑z.
van Hateren, J.H., 2012. A fractal climate response function can simulate global average temperature trends of the modern era and the past millennium. Climate Dynamics, doi: 10.1007/s00382-012‑1375‑3.
