Global Science Report is a weekly feature from the Center for the Study of Science, where we highlight one or two important new items in the scientific literature or the popular media. For broader and more technical perspectives, consult our monthly “Current Wisdom.”
“Climate sensitivity” is the amount that the average global surface temperature will rise, given a doubling of the concentration of atmospheric carbon dioxide (CO2) in the atmosphere from its pre-industrial value. This metric is the key to understanding how much global warming will occur as we continue to burn fossil fuels for energy and emit the resultant CO2 into the atmosphere.
The problem is that we don’t know what the value of the climate sensitivity really is.
In its Fourth Assessment Report, released in 2007, the United Nations’ Intergovernmental Panel on Climate Change (IPCC) had this to say about the climate sensitivity:
It is likely to be in the range 2°C to 4.5°C with a best estimate of about 3.0°C, and is very unlikely to be less than 1.5°C. Values substantially higher than 4.5°C cannot be excluded…
In IPCC parlance, the term “likely” means a probability of greater than 66% and “very likely” means a greater than 90% change of occurrence. The IPCC’s 90% range for the climate sensitivity includes values at the low end which, if proven true, would engender very little concern over our use of fossil fuels as a primary energy source, and values at the high end would generate calls for frantic efforts (which would likely fail) to lower carbon dioxide emissions.
While there has been a lot of effort expended to better constrain estimates of sensitivity over the past several decades, little progress has been made in narrowing the range. The IPCC’s First Assessment Report, released back in 1990, gave a range of 1.5°C to 4.5°C. It’s not that climate science hasn’t progressed since then, but just that the advanced understanding has not led to substantially better constraints.
But what has occurred over the past several decades is that greenhouse emissions have continued to rise (in fact, half of the total anthropogenerated carbon dioxide emissions have been since the mid-1980s), and global temperature observations have continued to be collected. We now have much more data with which to use to try to determine the sensitivity.
While global carbon dioxide emissions continue to rise year-over-year (primarily driven by the rapid growth in developing countries such as China), global temperatures have not kept up—in fact, there has been little to no overall global temperature increase (depending upon the record used) over the past decade and a half.
That doesn’t bode well for the IPCC’s high-end temperature sensitivity estimates. The scientific literature is now starting to reflect that reality.
Never mind that Pat Michaels and I published a paper in 2002 showing that the sensitivity lies near the low side of the IPCC’s range. This idea (and those in similar papers subsequently published by others) had largely been ignored by the “mainstream” scientists self-selected to produce the IPCC Assessments. But new results supporting lower and tighter estimates of the climate sensitivity are now appearing with regularity, a testament to just how strong the evidence has become, for such results had to overcome the guardians of the IPCC’s so called “consensus of scientists”, which the Climategate emails showed to be less than gentlemanly.
Figure 1 shows the estimates of the climate sensitivity from five research papers that have appeared in the past two years, including the recent contributions from Ring et al. (2012) and van Hateren (2012)—both of which put the central estimate of the climate sensitivity at 2°C or lower, values which are at or beneath the IPCC’s current “likely” range.
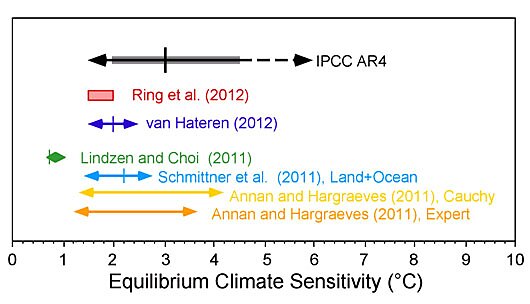
Figure 1. Climate sensitivity estimates from new research published in the past two years (colored), compared with the range given in the IPCC Fourth Assessment Report (black). The arrows indicate the 5 to 95% confidence bounds for each estimate along with the mean (vertical line) where available. Ring et al. (2012) present four estimates of the climate sensitivity and the red box encompasses those estimates. The right-hand side of the IPCC range is dotted to indicate that the IPCC does not actually state the value for the upper 95% confidence bound of their estimate. The thick gray line represents the IPCC’s “likely” range.
The IPCC is scheduled to release its Fifth Assessment Report in 2013. We’ll see whether these new, lower, and more constrained estimates of climate sensitivity that are increasing populating the literature result in a modification of the IPCC estimates, or whether the IPCC authors manage to wave them all away (or simply ignore them, as was the case with our 2002 paper).
Regardless of how the IPCC ultimately assesses climate science in 2013, the fact of the matter is that there is growing evidence that anthropogenic climate change from the burning of fossil fuels is not going to turn out to be as much as climate alarmists have made it out to be.
References:
Annan, J.D., and J.C. Hargreaves, 2011. On the generation and interpretation of probabilistic estimates of climate sensitivity. Climatic Change, 104, 324–436.
Lindzen, R.S., and Y‑S. Choi, 2011. On the observational determination of climate sensitivity and its implications. Asia-Pacific Journal of Atmospheric Sciences, 47, 377–390.
Michaels, P.J., P.C. Knappenberger, O.W. Frauenfeld, and R.E. Davis, 2002. Revised 21st century temperature predictions. Climate Research, 23, 1–9.
Ring, M.J., et al., 2012. Causes of the global warming observed since the 19th century. Atmospheric and Climate Sciences, 2, 401–415, doi:10.4236/acs.2012.24035.
Schmittner, A., et al., 2011. Climate sensitivity estimated from temperature reconstructions of the Last Glacial Maximum, Science, 334, 1385–1388, doi: 10.1126/science.1203513.
Solomon, S., et al., (eds.), 2007. Climate Change 2007: The Physical Science Basis. Contribution of Working Group I to the Fourth Assessment Report of the Intergovernmental Panel on Climate Change. Cambridge University Press, Cambridge, 996pp.
van Hateren, J.H., 2012. A fractal climate response function can simulate global average temperature trends of the modern era and the past millennium. Climate Dynamics, doi:10.1007/s00382-012‑1375‑3.
