The Current Wisdom is a series of monthly articles in which Patrick J. Michaels and Paul C. “Chip” Knappenberger, from Cato’s Center for the Study of Science, review interesting items on global warming in the scientific literature that may not have received the media attention that they deserved, or have been misinterpreted in the popular press.
It’s guaranteed: every article which is “part of a year‐long series that explores the places and ways in which climate change affects us” will paint a horrific picture, a part of the strange universe of global warming journalism.
Consider this: global warming has been with us as an issue for a quarter‐century. Everyone knows that it lengthens the beach season, but we have yet to see one article showing nubile females and tanned hunks frolicking on the shore.
[caption align=“right”]

In 25 years of global warming hype, why hasn’t one article noted that it will increase the number of beach days? Where’s the beef?[/caption]
In a recent USA Today article “Diseases on the move because of climate change,” The Campaign Continues.
It’s biblical. Brain‐eating amoebas. Killer ticks. A fungus kills many among us. About the only thing missing from this one is all the deaths that will result from hail the size of canned hams.
It’s mind‐boggling. 0.8°C ago, around 1900, life expectancy was one half what it is now. Malaria was endemic. Food and water‐borne illnesses were real killers. All have been pretty much vanquished, despite dreaded warming. Not a mention of this.
Such droning is probably why people tune this stuff out. There’s an epidemic of the real global warming‐related malady, apocalypse fatigue, [1] and still the Society of Environmental[ist] Journalists hasn’t gotten the email.
There’s no need to bring out climate change to explain recent patterns of the diseases that can be thoroughly accounted for by any of a large collection of confounding factors. We meant human-caused climate change as that’s the pernicious kind (it’s too bad we can’t ask our ancestors how much they liked the very natural ice age).
First, the brain‐eating amoebas. They prefer warm bodies of fresh water. They are nasty critters that are virtually always fatal when they set up shop inside their victims—which are usually young children. The latter attributes make them attention getters, although the former is why they find themselves a focus of the USA Today article, which states that they are “showing up in northern lakes that were once too cold to harbor [them].”
The evidence? There have been two, count ‘em, two cases (the first in 2010, another in 2012) from a single lake in Minnesota—where, according to the USA Today, “[t]he water in Minnesota had been too cold for [the brain‐eating amoebas] to thrive.” “But August 2010 was the third‐warmest in Minneapolis since 1891.”
Okay then. So is this a part of a trend towards warmer Augusts in the Black Fly state?
Just because of our experience with the facts never getting in the way of a good global warming scare story, we went to the website of the National Climatic Data Center (NCDC) and used their tool to plot the history of August temperatures in Minnesota from 1895 through 2013 (USA Today could have done this as well). Figure 1 shows the result. 2010 is warm, but it isn’t the third warmest. According to NCDC, which also ranks the data in tabular form, 2010 was seventh‐warmest. Further, there are ten additional years within a degree of 2010. It is therefore reasonable to estimate that there have been 17 years in the climate record that could support the brain munchers.
And, as is obvious from NCDC’s figure, it’s impossible to see a global warming signal in the Minnesota August data—unless you think that the noisy up‐trend from roughly 1910–1930 was because of dreaded greenhouse gas emissions—something no one would want to contend in a live debate format, for fear of professional death—and not from brain eating amoebas, but from brain‐beating data.
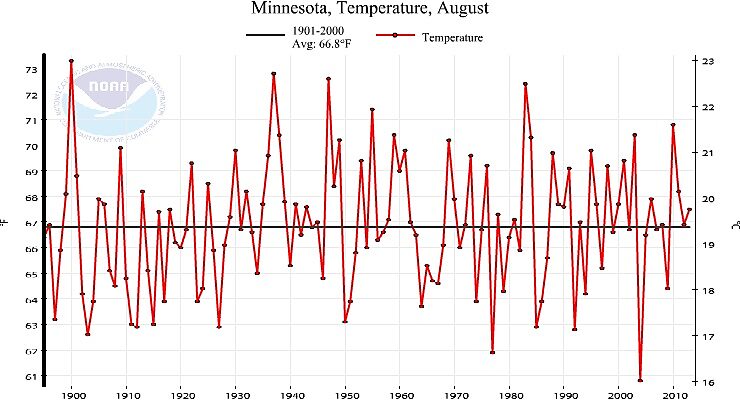
Figure 1. August statewide average temperature history for Minnesota, 1895–2013, as compiled by the National Climatic Data Center (source: NCDC)
But in case you’re still scared of your brain being eaten because of global warming, the Centers for Disease Control can only find 128 cases of infection by the brain‐eating amoeba in the entire USA since 1962. And, according to the CDC, “It does not appear that the number of infections has increased since CDC established its Free‐living Ameba (FLA) Laboratory and PAM registry in 1978.” Figure 2 (from the CDC) shows the number of reported cases in each year.
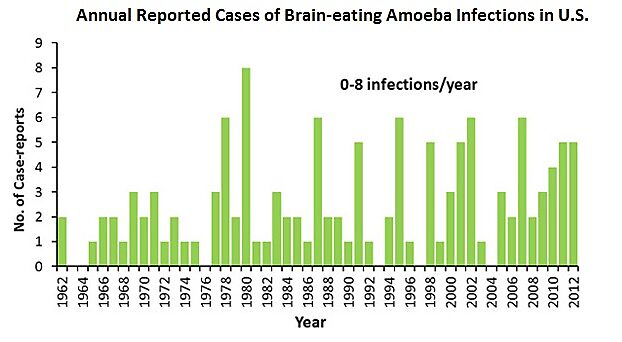
Figure 2. Annual occurrence of infection by brain‐eating amoeba, 1962–2012 (from the CDC).
Since 1962, there have been roughly 100,000,000 deaths in the U.S. Of those, 128 have been from brain‐eating amoeba—a percentage so low my old‐fashioned handheld calculator can’t figure it.
Perhaps USA Today could do better with its coverage of tick‐borne illnesses such as Lyme disease?
Hardly.
USA Today tells us (who told them, we wonder) a generally warming climate along with changes in extreme weather are demonstrably responsible for more tick‐to‐human disease transmission, despite a whole list of other confounding factors—many which are included in the article itself, such as humans moving closer to forests, and forest regrowth, and still others such as greater recognition of the disease, improved medical detection technologies, not to mention questions concerning the accuracy of surveillance data.
A recent review of Lyme disease in the journal Environmental Health Perspectives described the history of the disease in this way [references removed]:
The infection’s sudden rise in the United States in the 1970s gave the impression that Lyme disease was caused by a newly invading pathogen, but the diaries of early American settlers reported abundant ticks, and the evidence now shows that [Borrelia burgdorferi, Bb] is an ancient infection in North America. Distinctive Bb genes have been identified in museum collections of ticks from the 1940s and of white‐footed mice from the turn of the twentieth century, and studies of genetic variation in separate populations of Bb suggest the pathogen existed across much of the present‐day United States many thousands of years before European settlement. Nevertheless, genetic analyses indicate that this genus of bacteria originated in Europe.
Bb is a microbe of forest habitats, and its history is tied to human land use. As European settlers moved west across the United States, they cleared great swaths of forest. Deer, one of the major hosts for black‐legged ticks, were overhunted and dwindled to a few small, scattered populations. Populations of white‐footed mice, an important reservoir host for Bb, also declined. But in some undisturbed spots in the Northeast and the Midwest, deer, white‐footed mice, their tick parasites, and Bb all survived. With the abandonment of most northeastern farm fields in the mid‐nineteenth century, forests regenerated, and the microbe traveled with its tick and vertebrate hosts into newly re‐expanding habitats.
Lyme disease now appears to be expanding outward from long‐time refuges.
In other words, the ticks are reclaiming their once‐held territory that included most of the U.S., and in doing so, they are spreading Lyme disease—an ancient pathogen.
You get pretty twisted up trying to invoke anthropogenic global warming to explain a general (including southern, i.e., into already warmer climates) expansion of the ticks and their pathogen hitchhikers.
Is it possible that warming climate is facilitating the expansion northward? To some small extent, perhaps. But even under a scenario in which its influence is proven (which is not the current situation), climate change is just one contribution to a highly complex interplay of a large number of factors.
Identifying whatever climate change signal may exist in such a system and attributing that the a human casue, is darn near impossible.
Lastly, USA Today takes on Valley Fever—an infection caused by the inhalation of the spores of a fungus (Coccidioides spp.) which is found largely in the desert Southwest. The fungus prefers hot, arid environments, interspersed with periodic wet periods, and the spores are spread by soil disturbance mechanisms, including wind (and construction equipment, and tractors, and shovels, etc.). USA Today reports that there has been a large rise in the numbers of reported cases of Valley Fever during the past few years and that “Valley Fever is one of multiple diseases experts say are spreading in part because of climate change.”
But, the CDC explains that there are numerous factors that may lie behind the recent reported increase [references removed]:
This report describes statistically significant increases in the incidence rate of reported coccidioidomycosis in endemic states during 1998–2011 after adjusting for changes in population size and in age and sex distribution. Although the number of cases decreased in Arizona during 2007–2008 and in California during 2007–2009, incidence dramatically increased in 2010 and 2011. In 2011, coccidioidomycosis was the second most commonly reported nationally notifiable condition in Arizona and the fourth most commonly reported in California.
The reasons for the increases described in this report are unclear. Coccidioides exists in the soil and is sensitive to environmental changes; factors such as drought, rainfall, and temperature might have resulted in increased spore dispersal, and disruption of soil by human activity, such as construction, also might be a contributing factor.
Changes in surveillance methodology might have resulted in artifactual increases. California transitioned to a laboratory‐based reporting system during 2010, which facilitated reporting and might account for the increase in reported cases in 2011. However, some highly endemic counties, such as Kern County, already had been using laboratory‐based systems, so this cannot fully explain the recent increase. The observed increase in Arizona might be partially attributable to a 2009 change by a major commercial laboratory to conform its reporting practices to the 2008 CSTE case definition, whereby positive enzyme immunoassay (EIA) results were reported as cases without confirmation by immunodiffusion. One commercially available EIA test (Meridian Bioscience) commonly used to diagnose coccidioidomycosis has been described to have false‐positive results in some instances, but the contribution of this phenomenon, if any, to the overall increase in cases is unknown.
Improved awareness of coccidioidomycosis might have resulted in increased diagnostic testing (and thus reporting) in endemic and nonendemic states. Coccidioides has been found to be the etiologic agent in an estimated 15%–29% of community‐acquired pneumonias in highly endemic areas. However, a 2006 study demonstrated that only a small proportion (2%–13%) of patients with compatible illness in an endemic area were tested for coccidioidomycosis, suggesting that the disease is greatly underreported. Further study is needed to understand if testing practices have changed. Despite the increase in reported cases, overall U.S. coccidioidomycosis mortality rates have remained fairly stable at approximately 0.6 per 1 million person‐years during 1990–2008.
Like we said, it’s complicated.
As it is for climate change (as opposed to variability), Figure 3, shows the annual number of Valley Fever cases from 1995–2011 along with the temperature and precipitation history from Arizona (the state with the large majority of Valley Fever cases). Our figure clearly shows that the temperature and precipitation vary on annual to decadal (and even longer) timescales, but that there is nothing particularly unusual during the past couple of years associated with the large rise in Valley Fever cases.
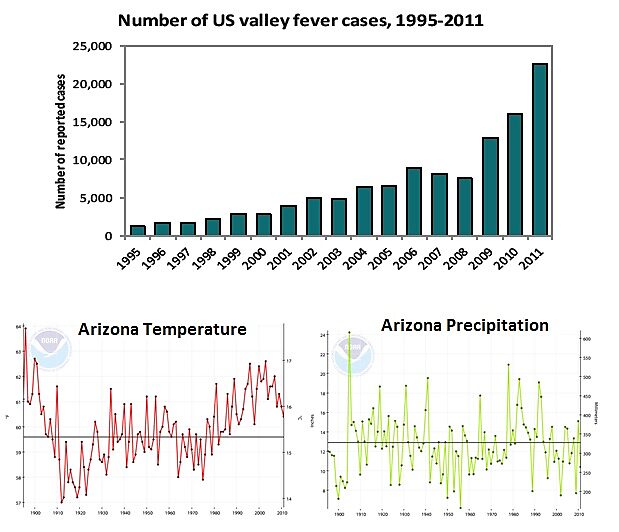
Figure 3. (top) Reported cases of Valley Fever in the U.S., 1995–2011 (source CDC). (bottom) Annual statewide temperature (left) and precipitation (right) history from Arizona, 1895–2011 (source: NCDC).
While annual statewide averages probably don’t reveal the nuances of the complexity of the climate relationship with Valley Fever outbreaks, if you have to look this hard, and only at a couple of years, there is no way to conclusively implicate human‐caused climate change. It is impossible.
If you want even more facts, have a look at Figure 4, from the CDC, showing several measures of mortality across the U.S. Even though the raw number of people dying each year is on the increase, this increase is a result of an increasing and aging population. Correct for these attributes (dark blue line) and you see that a large and on‐going decline is taking place. If you want to go looking for an anthropogenic climate change signal, you need to go looking in (and shouldn’t lose sight of) this overall trend.
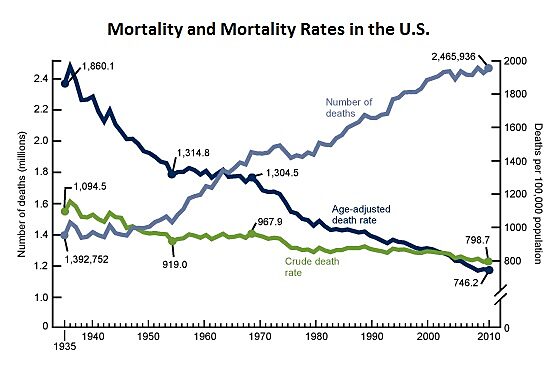
Figure 4. Number of deaths, crude and age‐adjusted death rates: United States, 1935–2010 (source: CDC).
As is often the case in assessments of the impacts of climate change, including those from the federal government (see our critique here), authors quickly lose sight of the big, rosy, landscape, instead manufacturing a nanoscene of doom and gloom constructed with much whole cloth.
[1] The first usage of this term is documented as having been by the senior author on CNN Crossfire in February, 1992; see www.wordspy.com.
