Global Science Report is a weekly feature from the Center for the Study of Science, where we highlight one or two important new items in the scientific literature or the popular media. For broader and more technical perspectives, consult our monthly “Current Wisdom.”
—
In the process of writing our upcoming book, The Lukewarmer’s Manifesto, we wandered into the funhouse of the 2014 National Climate Assessment (NCA).
Recall that the NCA is a product of the federal government’s U.S. Global Change Research Program, whose motto is “Thirteen Agencies, One Mission: Empower the Nation with Global Change Science.”
In their case, “empower” is synonymous with “indoctrinate.”
Here is a good example:
The section on hurricanes in Chapter 2 (“Our Changing Climate”) caught our eye. The NCA has a sidebar on the history of the hurricane “power dissipation index” (PDI), a well-known cubic function of the wind velocity. The NCAs graphs begin in 1970 and end in 2009 (a full four years before the NCA was released). They include a trend line through the PDI data beginning in 1980 that’s going up for whatever reason and that is apparently convenient for drawing an association with human-caused global warming. But had the NCA authors consulted a longer record, say, from 1920 to 2013 (the last year data was available for the 2014 NCA) they could have readily ruled out any role of global warming.
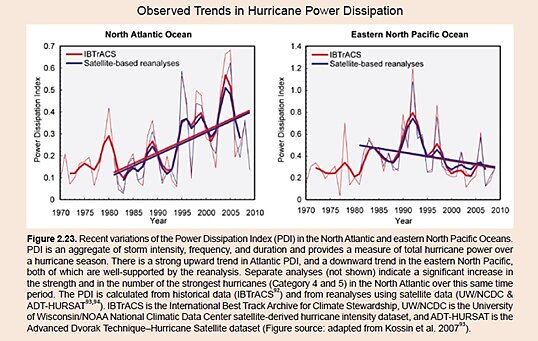
Figure 1. From page 42 of the hardcopy of the 2014 National Assessment Report form the USGCRP (available here).
The NCA’s reason for not using a longer record is that “there is considerable uncertainty in the record prior to the satellite era (early 1970s).”
On the surface, that’s true, but it is disingenuous. According to Dr. Chris Landsea who helped developed the National Hurricane Center’s Atlantic hurricane history data (known as HURDAT2):
…some storms were missed, and many intensities are too low in the preaircraft reconnaissance era (before 1944 in the western half of the basin) and in the presatellite era (before 1972 for the entire basin). [emphases added]
In other words, the earlier PDI data prior to 1972 could be an underestimate, but it certainly isn’t an overestimate.
Dr. Ryan Maue was kind enough to provide us with the PDI record based upon the National Hurricane Center’s HURDAT2 data back to 1920. There’s no significant trend when this record is examined, despite a warming of approximately 0.75°C in the earth’s surface temperature history. In this context, the NCA’s trend line (indicated in our figure in red) seems nothing but absurd.
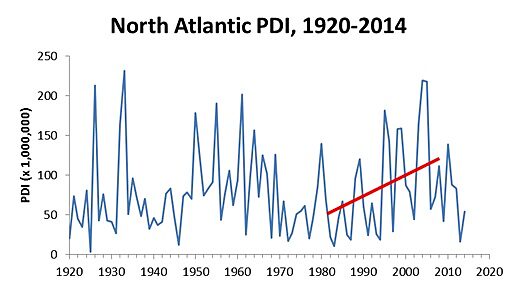
Figure 2. Atlantic Basin Power Dissipation Index calculated from HURDAT2 by Ryan Maue. The NCA could have used this data, which, for its 2014 volume, ended in 2013. The trend in 1980–2009 is shown as per the NCA.
A voluminous literature supports the notion that periodic changes in the north-south temperature gradient in the Atlantic Ocean (known, not surprisingly, as the Atlantic Multidecadal Oscillation (AMO)), are related to hurricane activity in the North Atlantic.
According to Dr. Maue, the trend line drawn in the NCA basically starts during the negative phase of the AMO cycle (which promotes low hurricane activity) and ends during a positive phase (which is favorable for high levels of hurricane activity). A more accurate assessment of hurricane activity would begin in 1950 (reducing the influence of the cyclical nature of the AMO) and indicates a trend of zero (similar to the one beginning in 1920).
But such data apparently is a distraction when trying to paint an administration-preferred picture of the influence of anthropogenic climate change.
Reference:
Landsea, C. W., and J. L. Franklin, 2013. Atlantic Hurricane Database Uncertainty and Presentation of a New Database Format. Monthly Weather Review, 141, 3576–3592.
