Each January the Congressional Budget Office provides updated projections of the federal budget for the coming decade. Let’s compare the January 2011 projections to the January 2012 projections to see whether the switchover of the House to Republican control during 2011 has made a dent in spending.
We will look at CBO projections for the three basic components of federal spending: discretionary, entitlements, and interest. The three figures below are CBO “baseline” projections of fiscal year outlays, with historical data back to 2007.
Figure 1 shows that discretionary outlays jumped from $1.04 trillion in 2007 to $1.35 trillion in 2011. The CBO’s new projection (red line) for spending in 2012 is $44 billion below what the CBO projected for 2012 last year (blue line). That small reduction is partly attributable to GOP spending restraint efforts.
Looking ahead to 2021, spending is now projected to go down significantly from what was projected last year. That is the result of the budget caps that the Republicans negotiated with the Democrats in the Budget Control Act enacted last summer, and it includes the further reduction in caps stemming from the failure of the “supercommittee.”
If the caps hold, discretionary outlays will be 16 percent lower in 2021 than they might otherwise have been. However, that’s a giant “if” given the track record of Congress. And even if the caps do hold, it would only be a cut of $256 billion in 2021, which would be less than 5 percent of total federal spending that year of more than $5 trillion.
Figure 2 shows that entitlement outlays soared from $1.45 trillion in 2007 to $2.06 trillion in 2011, a giant 42 percent leap in just four years. (I’ve excluded TARP spending, which has distorted the figures in recent years). Note that within a few years entitlement spending (in Figure 2) will be more than twice as large as discretionary spending (in Figure 1).
Looking ahead, CBO’s new projections show entitlement spending rising to $3.27 trillion by 2021. This is the spending explosion that is threatening to enslave young Americans with debt, but ironically it is the part of the budget that policymakers are doing the least to control. This year’s projection for 2021 is down a tiny $61 billion from last year’s projection, partly from the scheduled “sequester” cuts resulting from the failure of the supercommittee.
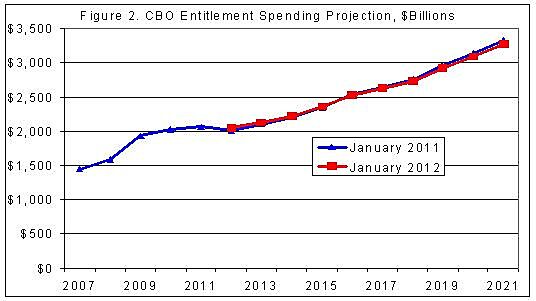
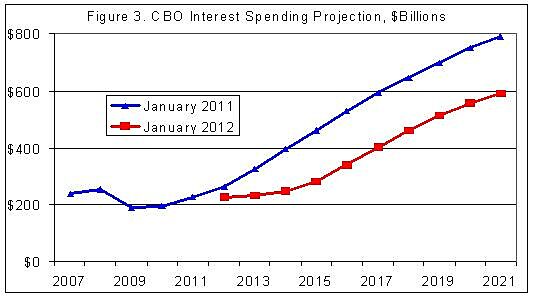
Figure 3 shows that federal interest costs have hovered around $200 billion in recent years, but are set to blast off due to rising federal debt levels and rising interest rates. The CBO has sharply cut its projections of interest costs and interest rates compared to last year’s projections. The more optimistic forecast apparently stems partly from Fed chairman Ben Bernanke’s claim that he will keep interest rates low in coming years. Over nine years (2012–2021) the new projections cut interest costs by $1.6 trillion compared to last year’s projections. It’s not a stretch to say that there is a lot of upside risk to the CBO’s new interest cost projections.
The data in these figures are based on the CBO’s budget baseline, which is an optimistic scenario for what spending may look like without any budget changes. The baseline assumes that the discretionary caps hold, that the scheduled sequester comes into force, and that the “doc fix” cut to Medicare is imposed. It also assumes that Congress doesn’t add any more programs or expand existing ones.
Nonetheless, the new discretionary budget caps and planned sequester are tiny steps toward reducing projected spending growth. Fiscal conservatives in Congress now need to focus on eliminating discretionary programs and permanently reducing benefit levels in entitlement programs. See www.DownsizingGovernment.org.
