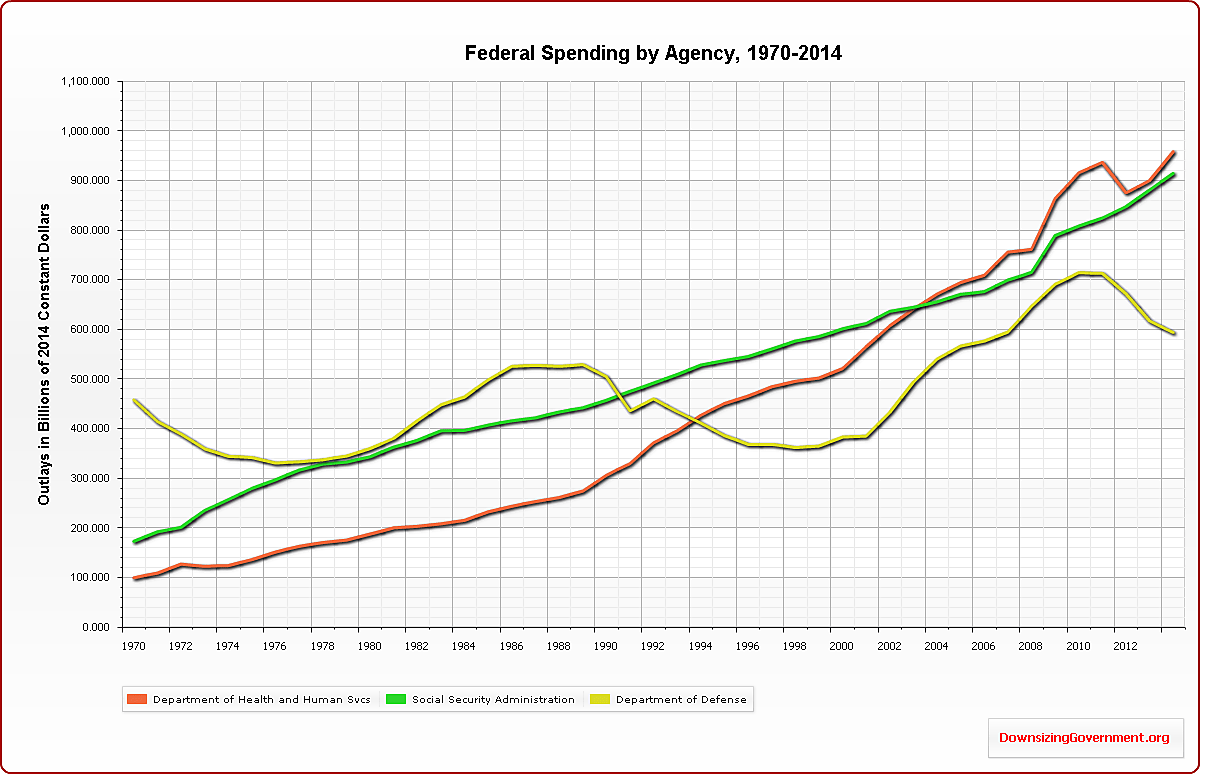
How much does Congress spend on Veterans Affairs, the IRS, or Customs and Border Protection? How much has spending increased over time?
You can answer those questions quickly and easily with Cato’s updated charting tool for the federal budget.
The tool allows you to plot real outlays for about 500 departments, agencies, and programs, 1970–2014. All data is from the Office of Management and Budget.
The chart page opens blank. Click “+” to open a department and then check boxes for the departments, agencies, and programs you want to plot.
To save your chart as an image or a pdf, right click on it.
This chart shows spending on the three largest federal agencies. The data is in constant 2014 dollars.

