E‑Verify is an electronic eligibility for employment verification system run by the federal government. It is supposed to check the identity information of new hires against government databases to see if they are legally eligible to work. The government created E‑Verify to deny employment to illegal immigrants as a means of turning off the wage magnet that attracts so many here in the first place, but it has serious and unsolvable problems. Four states have mandated E‑Verify for all new hires: Arizona, Alabama, South Carolina, and Mississippi. Barely a majority of new hires in those four states are run through E‑Verify currently. A federal mandate would probably have even lower compliance rates.
E‑Verify compliance rates are very low. In the second quarter of 2017, only about 56 percent of all new hires in states with E‑Verify mandates were actually run through the program even though the law in those states mandates that 100 percent of them should have been checked against E‑Verify (Figure 1). It doesn’t get much better when looking at the individual states although I only have data going back to the fourth quarter of 2009 (Table 1). Over the course of E‑Verify’s mandate on the state level, compliance with the program has not improved (Figure 2). The peak compliance rate for each state was 67 percent in Arizona in the third quarter of 2015, 66 percent in Alabama in the first quarter of 2016, 62 percent in the first quarter of 2015, and 53 percent in the third quarter of 2013. That is a low level of compliance for a program that is supposed to stop the hiring of illegal immigrants.
This blog shows lower compliance rates for E‑Verify than in previous publications of mine. That is because the most recent FOIAs actually exclude the number of E‑Verify self-checks and are guaranteed to be tied to the location of the hire rather than the location of the E‑Verify check. In previous FOIAs, the government did not specify that hires in some states were run through E‑Verify in other states. This most recent data corrects for that confusion and allows for a more accurate comparison.
It is time that policymakers in Washington, DC look at the states where E‑Verify is mandatory to judge how it works in reality rather than relying on Pollyanish odes about its intended effects. The low E‑Verify compliance rates in states where the program is mandated point to serious problems that its cheerleaders must directly address.
Figure 1
E‑Verify Compliance Rates in States with Mandated E‑Verify
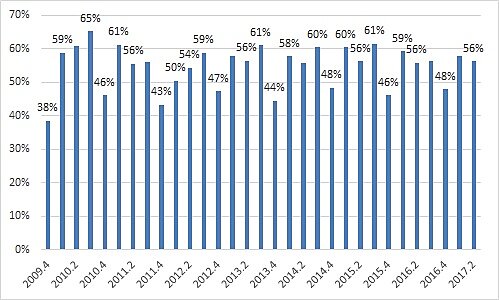
Sources: Department of Homeland Security and Longitudinal Employer-Household Dynamics Survey
Figure 2
E‑Verify Compliance Rates by State, Fourth Quarter of 2009 through Second Quarter of 2017
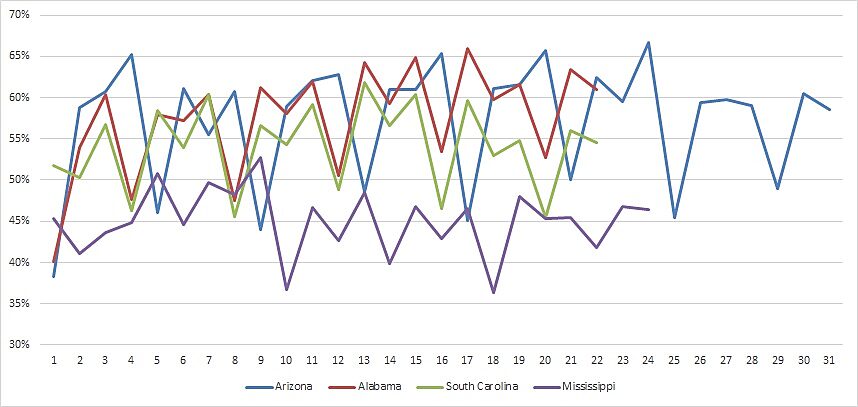
Sources: Department of Homeland Security and Longitudinal Employer-Household Dynamics Survey
Table 1
E‑Verify Checks as a Percent of All New Hires
| Year.Quarter | Arizona | Alabama | South Carolina | Mississippi |
| 2009.4 | 38% | NM | NM | NM |
| 2010.1 | 59% | NM | NM | NM |
| 2010.2 | 61% | NM | NM | NM |
| 2010.3 | 65% | NM | NM | NM |
| 2010.4 | 46% | NM | NM | NM |
| 2011.1 | 61% | NM | NM | NM |
| 2011.2 | 56% | NM | NM | NM |
| 2011.3 | 61% | NM | NM | 45% |
| 2011.4 | 44% | NM | NM | 41% |
| 2012.1 | 59% | 40% | 52% | 44% |
| 2012.2 | 62% | 54% | 50% | 45% |
| 2012.3 | 63% | 60% | 57% | 51% |
| 2012.4 | 49% | 48% | 46% | 45% |
| 2013.1 | 61% | 58% | 58% | 50% |
| 2013.2 | 61% | 57% | 54% | 48% |
| 2013.3 | 65% | 60% | 60% | 53% |
| 2013.4 | 45% | 47% | 46% | 37% |
| 2014.1 | 61% | 61% | 57% | 47% |
| 2014.2 | 62% | 58% | 54% | 43% |
| 2014.3 | 66% | 62% | 59% | 48% |
| 2014.4 | 50% | 51% | 49% | 40% |
| 2015.1 | 62% | 64% | 62% | 47% |
| 2015.2 | 60% | 59% | 57% | 43% |
| 2015.3 | 67% | 65% | 60% | 47% |
| 2015.4 | 45% | 53% | 46% | 36% |
| 2016.1 | 59% | 66% | 60% | 48% |
| 2016.2 | 60% | 60% | 53% | 45% |
| 2016.3 | 59% | 62% | 55% | 45% |
| 2016.4 | 49% | 53% | 45% | 42% |
| 2017.1 | 61% | 63% | 56% | 47% |
| 2017.2 | 59% | 61% | 55% | 46% |
Sources: Department of Homeland Security and Longitudinal Employer-Household Dynamics Survey
Note: NM means “no E‑Verify mandate.”
Note: The Author made some corrections to statistics and figures on April 26, 2018 based on new federal government information.
