Despite the fears expressed in news stories, federal worker furloughs do not seem to have caused major economic disruptions. While the National Parks were closed, most government workers that provide useful services to citizens are at the state and local level, not the federal level.
Thus one advantage of our system of federalism is that budget battles at the national level do not shut down most government services that citizens actually use, such as police, fire, and the schools. Indeed, the ongoing political dysfunction at the federal level should be a warning to avoid any further centralization of American government in Washington.
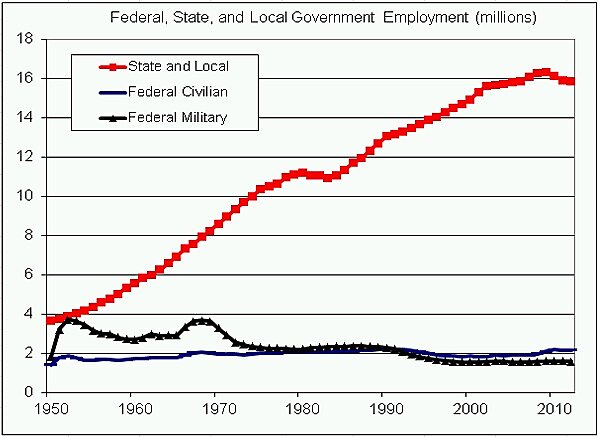
At most, about 800,000 federal workers were furloughed, but that figure is small compared to the 16 million workers in state and local governments. The federal government spends far more than all state/local governments combined, but it has less than one-quarter of the number of workers. When you exclude the uniformed military, there are just one-eighth the number of federal workers as state/local workers.
Outside of the military, the federal government is mainly just a giant cash transfer machine, vacuuming up taxpayer earnings and redistributing them to individuals, businesses, nonprofit groups, and state/local governments through more than 2,000 subsidy programs.
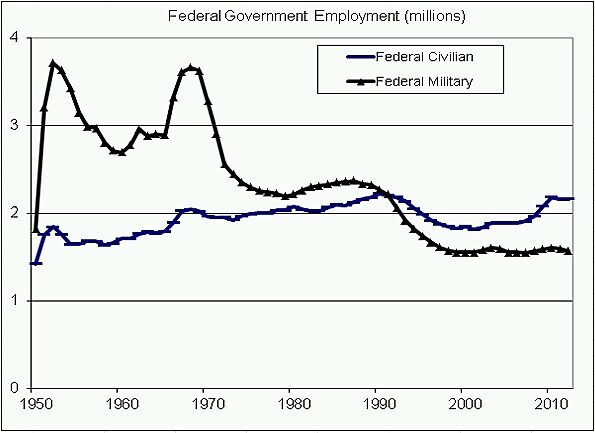
There are two charts below. The first chart shows that state/local government employment has soared since 1950. The second chart shows that federal civilian employment has been comparatively flat.
State/local bureaucracies have grown partly in order to handle the flood of cash and paperwork from the rising number of federal aid-to-state programs. The partial federal shutdown has threatened to turn off the cash spigot to some of these programs, but my view is that the more federal aid programs that we can terminate, the more that we will unhook local activities from future budget chaos in D.C.
(Data notes: Federal “civilian” employment includes nonuniformed Pentagon workers, but it excludes postal workers. The data are from NIPA Table 6.5. and measured in full-time equivalents).