Intercity passenger trains are experiencing a “renaissance” with Amtrak ridership growing “faster than other major travel modes,” says a new report from the Brookings Institution. Indeed, the report continues, Amtrak’s short-distance trains (generally, routes of around 200 to 600 miles) have, on average, a “positive operating balance,” so more such short-distance routes should be added.
As a long-time lover of passenger trains, I wish the report’s statements were true, but they are not. To reach these conclusions, Brookings scholars have selectively used data; ignored one of the major travel modes; and relied on Amtrak accounting tricks to disguise losses.
The rapid growth of rail passenger travel that they report is from 1997 to 2012, but 1997 was near the bottom of a trough in Amtrak ridership. If they had gone back to 1991, which was Amtrak’s peak before 2010, the would have revealed a very different story.
From 1991 to 2012, Amtrak passenger miles grew by a paltry 8 percent (compared with 32 percent between 1997 and 2012), while airline passenger miles grew by 68 percent (vs. 26 percent from 1997 to 2012). Let’s see: air travel grew 68 percent; Amtrak 8 percent. Not much of a rail renaissance, is there?

Of course, using 1991 instead of 1997 makes me just as selective as Brookings. So the chart above just compares the trends from 1990 to 2012. The important thing to note about the chart: Amtrak is insigificant, carrying in recent years little more than 1 percent as many passenger miles as the airlines. Amtrak would appear even more insignificant if the vertical scale were raised to show intercity driving of personal vehicles (as opposed to trucks and buses), which moves about 200 times as many passenger miles as Amtrak.
Amtrak’s performance looks even more dismal on a per capita basis. Amtrak may have posted record ridership in 2012, but the nation’s population was also 25 percent greater than in 1991 when Amtrak per capita ridership peaked at a mere 25 miles per person. Today, it is 13 percent less.
When Brookings compares Amtrak with “other major travel modes,” it implies that Amtrak itself is a major travel mode. In fact, Amtrak’s 22 miles per person in 2012 compares with more than 1,800 miles in air travel and 4,200 miles in intercity auto travel. As a result, Amtrak carries only about 0.36 percent of intercity passenger travel in the U.S. That’s up from 1997, when it was 0.32 percent, but down from 1991, when it was 0.45 percent. Fluctuating between a third and a half percent does not make Amtrak a “major travel mode.”
If Amtrak is a major travel mode, then intercity bus, which (I estimated in a 2011 Cato report) carries three times as many passenger miles as Amtrak, is as well. A more more recent report from DePaul University’s Chaddick Institute found that bus travel is growing twice as fast as Amtrak. Other than a brief hint near the end of its report, Brookings never mentions intercity buses as an alterantive to Amtrak. But if buses are doing so well without large government subsidies, why subsidize Amtrak?
Brookings is on even shakier ground when it discusses Amtrak finances. “Combined, Amtrak’s short-distance corridors generated a positive operating balance,” says the report. But this is weighted by the fact that just one of those short-distance routes, the Boston-to-Washington Northeast Corridor, carries as many passenger miles as the other 27 routes put together. Of the other 27, only three showed a “positive operating balance,” to use Brookings’ term, in 2012: a New York-Raleigh route; and routes from Boston to Newport News and Lynchburg, Virginia. But all of these use the Northeast Corridor as well.
Brookings’ calculations of “operating balances” (note that it never actually says profit) rely on two of Amtrak’s biggest accounting tricks. First, Amtrak counts subsidies from the states–which amounted to $193 million in operating funds and $32 million in capital funds in 2012–as revenues, so Brookings ignores the losses on state-subsidized trains that are offset by state subsidies. As I told USA Today, “A subsidy is a subsidy whether it’s coming from federal, state or local taxpayers.”
Second, generally accepted accounting principles count maintenance as an operating cost, but Amtrak (along with the transit industry) pretends it is a capital cost. This allows Amtrak and Brookings to move a large share of costs off the books when calculating “operating balances.”
According to Amtrak’s 2012 financial statement, adding capital costs (most of which in recent years have been maintenance, not true capital improvements) more than doubles operating losses from about $500 million to nearly $1.2 billion. If apportioned appropriately to routes, this would put even the Northeast Corridor in the red.
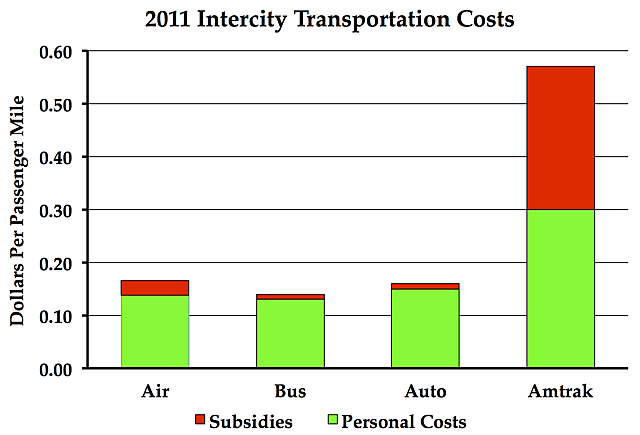
No other form of intercity travel is so costly. My 2012 Cato report on Amtrak found that in 2011 airfares averaged just 13.8 cents per passenger mile and subsidies to air travel added 2.8 cents more. By comparison, Amtrak fares were 31 cents and subsidies added 28 cents more per passenger mile, making Amtrak’s total costs nearly four times greater than the costs of flying. Intercity driving is about the same as air travel (but with smaller subsidies) while intercity buses are even less expensive.
By endorsing Amtrak’s accounting tricks–counting state subsidies as revenues and ignoring maintenance costs–Brookings exaggerates the viability of intercity passenger trains. The reality is, if passenger trains were viable, they wouldn’t need subsidies that are ten times greater, per passenger mile, than those the airlines receive in order to attract slightly more than 1 percent as many passenger miles as the airlines carry.
