The number of monthly removals, also known as deportations, by Immigration and Customs Enforcement (ICE) has dropped to 2,962 in April 2021 from a recent high of 28,118 in October 2019. President Trump’s changes in immigration enforcement policies can explain 90 percent of the drop in removals over that time while actions taken during the Biden administration can explain about 10 percent of the drop.
Many are blaming President Biden’s deportation policies for this slowdown in removals, but the downward trend in removals started before he took office. Figure 1 shows the total number of ICE removals and ICE arrests over time. Most of the arrests are called Enforcement and Removal Operations (ERO) administrative arrests. The number of arrests and removals are correlated over the entire period (+0.76), but not more closely correlated than that because a large percentage of ICE removals comes from Border Patrol apprehensions and not from ICE arrests. In fiscal year 2020 (October 2019-September 2020), 66 percent of all ICE removals were border removals of individuals apprehended by Border Patrol and turned over to ICE for removal, while the remainder were arrested by ICE. Additionally, ICE is removing people under Title 42 but they aren’t being counted as removals.
On March 20, 2020, the Trump administration responded to COVID-19 by implementing Title 42 – an order that allowed Border Patrol to rapidly return apprehended illegal immigrants to Mexico even if they were not Mexicans. As a result, Border Patrol was sending many fewer apprehended illegal immigrants to ICE for removal, so ICE’s removal numbers plummeted as a result. To be sure, ICE changed other policies that resulted in fewer deportations at the same time, but Trump’s implementation of Title 42 explains most of the collapse in ICE removals. In April 2020, the first full month of Title 42, removals had fallen to 9,992 from 19,249 in March – a drop of 48 percent. ICE ERO administrative arrests also collapsed from 10,431 in March 2020 to 5,793 in April – a 45 percent drop.
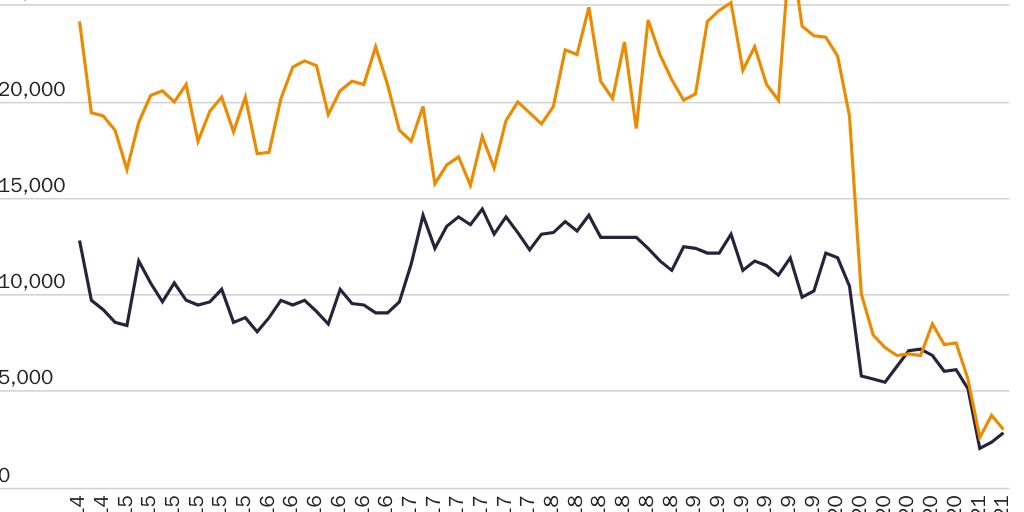
Removals declined from 28,118 at the pre-COVID local maximum of October 2019 to 5,583 in January 2021 and then further to 2,962 in April. Thus, a full 90 percent of the decline from the pre-COVID local maximum happened before Biden’s first full month in office. The Biden administration’s slowdown in removals was real but can only explain a small portion of the decline in removals over the last few years.
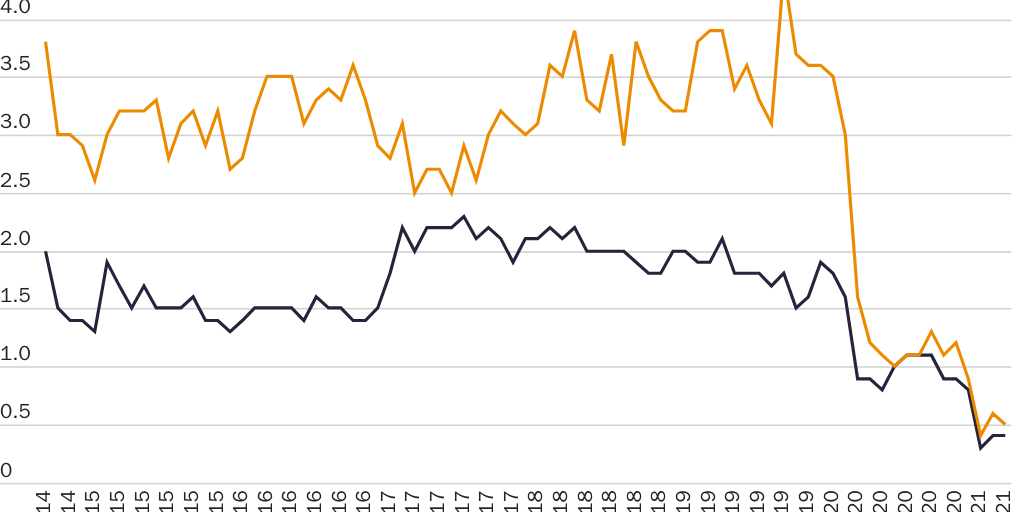
Nick Miroff and Maria Sacchetti of the Washington Post recently wrote an excellent piece about changes in ICE removal policy. They wrote that, “Under new Biden administration rules curtailing immigration enforcement, ICE carried out fewer than 3,000 deportations last month, the lowest level on record. The agency’s 6,000 officers currently average one arrest every two months.” Inspired by their numbers, I decided to look at the number of monthly removals and ERO arrests per ICE agent. ICE agents are classified as Office of Personnel Management code 1811 for federal employment. As of the second quarter of fiscal year 2021 (January 2021-March 2021), there were 6,389 ICE agents. The monthly number of ICE agents and the number of arrests and removals in Figure 2 shows that the monthly change is near-perfectly correlated with the total number of ICE arrests and removals in Figure 1. Figure 2 merely shows the number of removals and arrests per ICE agent over time and that it fell below one in April 2020 and has trended downward since then.
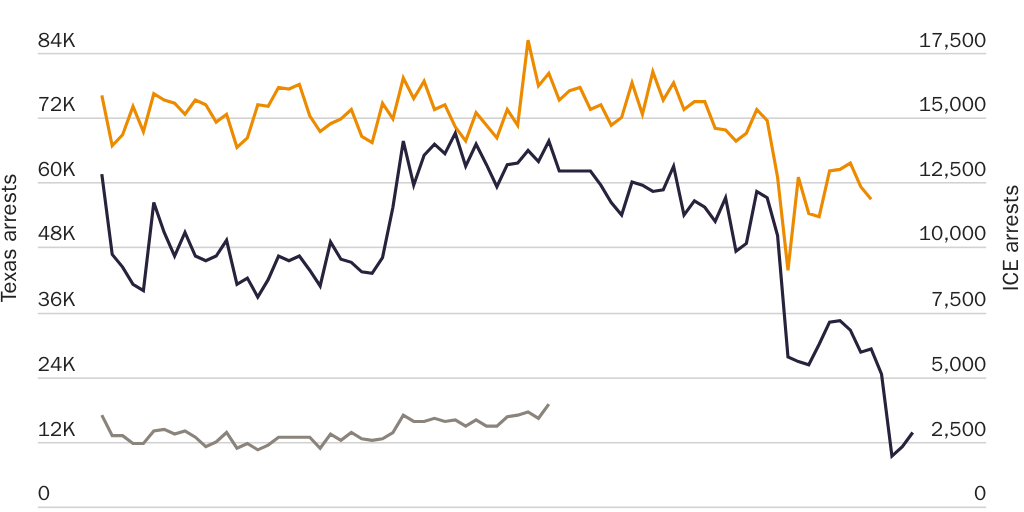
ICE arrests declined in most months after March 2020. That mostly steady decline is different from the initially large decline in the state-level number of arrests by Texas law enforcement per month that fell dramatically in March and April of 2020 before partly rebounding in May (Figure 3). Texas criminal arrests are different from ICE arrests in many ways, such as the facts that ICE is a federal law enforcement agency enforcing federal laws and that Texas arrests include state and local law enforcement agencies enforcing state laws, but the immediate fall in Texas arrests from February to April was 39 percent while it was 51 percent for ICE arrests. The biggest difference is that ICE’s arrests never recovered while the Texas criminal arrests recovered to 80 percent of their February 2020 number – at least through the end of the data set in December 2020. ICE arrests in Texas are included for the limited years for which they are available.
There are a few conclusions from these data. First, 90 percent of the decline in removals from the local maximum number prior to COVID-19 was due to policies implemented under the Trump administration. Second, the Biden administration can plausibly take credit for a maximum of 10 percent of that decline. Third, the Biden administration, in its first three full months in office, has still cut removals by about 60 percent relative to the Trump administration in its last three full months in office. Fourth, criminal arrests on the state-level in Texas partly recovered after crashing at the same time as nationwide ICE arrests crashed but ICE arrests never recovered.
