Global Science Report is a weekly feature from the Center for the Study of Science, where we highlight one or two important new items in the scientific literature or the popular media. For broader and more technical perspectives, consult our monthly “Current Wisdom.”
On Monday of this week, three prominent and influential scientists published an opinion piece in Politico arguing that anthropogenic global warming was responsible for making the destruction from “super storm” Sandy significantly worse than it otherwise would have been. They added that if we don’t “cut industrial carbon pollution,” we are going to get more of the same, and then some.
On the same day, I argued here at Cato@Liberty that it could be reasoned that anthropogenic global warming lessened the impact of Sandy.
The scientific truth about the situation is that it is impossible to know who is right—the uncertainties are just too large. But I think it is fair to say that no matter what direction the influence of anthropogenic global warming was on Sandy, in net it was quite small.
One difference between my piece and the Politico article co‐signed by Dr. Robert Corell (“senior policy fellow for the American Meteorological Society and former Chair of the United States Global Change Research Program”), Dr. Jeff Masters (“the founder and Director of Meteorology for Weather Underground and a former NOAA Hurricane Hunter”) and Dr. Kevin Trenberth (“Distinguished Senior Scientist in the Climate Analysis Section at the National Center for Atmospheric Research”) was that I tried to stick to a scientifically defensible argument. In their piece, they juiced up their case with some—how should I say this?—rather dubious facts.
The worst of these was claiming that “[o]n the stretch of the Atlantic Coast that spans from Norfolk to Boston, sea levels have been rising four times faster than the global average.” They implied that anthropogenic global warming was the reason why.
This is simply untrue.
While it is true that the long‐term (~20th century) rate of sea level rise along that stretch has been about twice the global average over the same period, it is scientifically well‐established that the regional enhanced rate of sea level rise is due to ongoing geologic processes resulting from end of the last ice age. When these non‐anthropogenic processes are properly subtracted out of the tide gauge record of sea level observations, the rate of sea level rise that is left over is virtually the same as the global rate of rise, not four times faster.
The same conclusion is reached if you limit your comparison to the period of satellite observations of sea level, which began about 20 years ago. The figure below shows a map of the satellite‐measured trends in sea level from 1993 through mid‐2012. The global average rate of rise is 0.12 inches per year, which is represented by a sort of greenish yellow color. Turning your attention to the Northeast coast of the United States (you might have to squint a bit), you see that the color there is also sort of greenish yellow—in other words, right about the global average. Places where the sea level is rising four times faster than the global average are colored a light pink; while there are a few such places, none of them are anywhere near the stretch of coast between Norfolk and Boston.
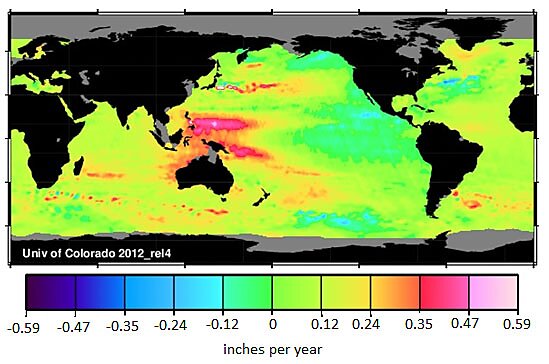
Figure 1. Spatial distribution of the rate of sea level rise across the globe as measured by satellite altimeters (Source: University of Colorado Sea Level Group, modified to reflect English units).
It is somewhat telling when prominent climate scientists have to resort to incorporating incorrect (and readily debunked) science to try to bolster their case for climate alarm—an alarm that was raised to try to scare us into accepting regulations on greenhouse gas emissions.
