Former U.S. Secretary of Education Arne Duncan has taken to the pages of the Washington Post to let you know that you shouldn’t listen to people who tell you that “education reform” hasn’t worked well. At least, that is, reforms that he likes—he ignores the evidence that private school choice works because, as far as can be gathered from the op-ed, he thinks such choice lacks “accountability.” Apparently, parents able to take their kids, and money to educate them, from schools they don’t like to ones they do is not accountability.
Anyway, I don’t actually want to re-litigate whether reforms since the early 1970s have worked because as time has gone on I’ve increasingly concluded that we do not agree on what “success” means and the measures we have of what we think might be “success” often don’t tell us what we believe they do. These are, by the way, major concerns that I’ll be tackling with Dr. Patrick Wolf in a special Facebook live event on Wednesday. Join us!
Rather than assessing the impacts of specific reforms on what are often fuzzy and moving targets, I want to examine one crucial assertion that Duncan says needs to be “noted”: students today are “relatively poorer than in 1971.”
To back this, Duncan links to a Post article from 2015 that said, “For the first time in at least 50 years, a majority of U.S. public school students come from low-income families.” The article is based on a report from the Southern Education Foundation, which only mentions low-income rates as far back as 1989. More important, it is based on the share of students eligible for free and reduced-price lunches (FRPL), a flawed indicator of child poverty.
As the National Center for Educational Statistics (NCES) has pointed out, families earning up to 185 percent of the poverty level are eligible for reduced-price lunches, and now many students get free lunches no matter their income if their schools use the Community Eligibility option. As the NCES summarizes:
[T]he percentage of students receiving free or reduced price lunch includes all students at or below 185 percent of the poverty threshold, plus some additional non-poor children who meet other eligibility criteria, plus other students in schools and districts that have exercised the Community Eligibility option, which results in a percentage that is more than double the official poverty rate [italics added].
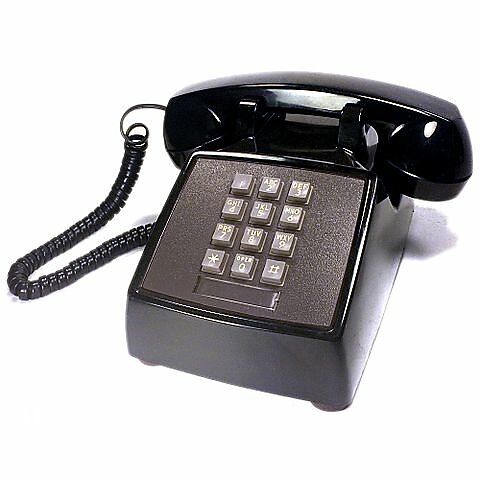
What is the poverty rate for families with children? In 1971, according to the U.S. Census, 12 percent of families with children under the age of 18 had incomes at or below the poverty level. By 2016 the rate was 15 percent. Up, but not hugely. And you have to know what “poverty” means: It is about cash income, and excludes major benefits such as food stamps, housing subsidies, and tax credits. Include those, according to the Center for Budget and Policy Priorities, and incomes for the poorest fifth of Americans have risen from about $20,000 in 1973 to over $22,000 in 2011. And with technological change, what that money can buy has afforded a much higher standard of living. Smartphones versus stuck-to-your-wall phones, anyone?
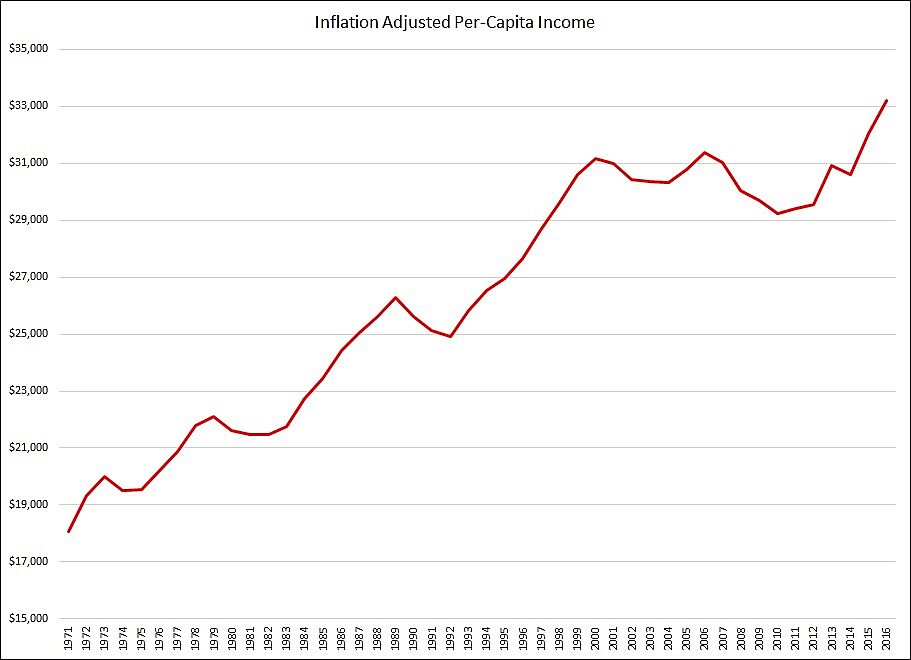
Finally, national test scores don’t gauge the performance of just the poor, but of all Americans. And while the poor are almost certainly better off today than in 1971, the nation as a whole is definitely better off. Indeed, as the figure above shows, inflation-adjusted, per-capita income nearly doubled from $18,603 in 1971 to $33,205 in 2016. Indeed, returning to the telephone theme, 13 percent of Americans didn’t have regular access to a telephone in 1971, versus about 2 percent today without a phone in their “housing unit.”
It is misleading, at best, to say that the “student population is relatively poorer” than in 1971. Burrow into the evidence and it is clear that American students are appreciably better off today than they were in 1971. It’s a basic reality we at least need to acknowledge before crediting broad “reform” for supposedly better outcomes.


