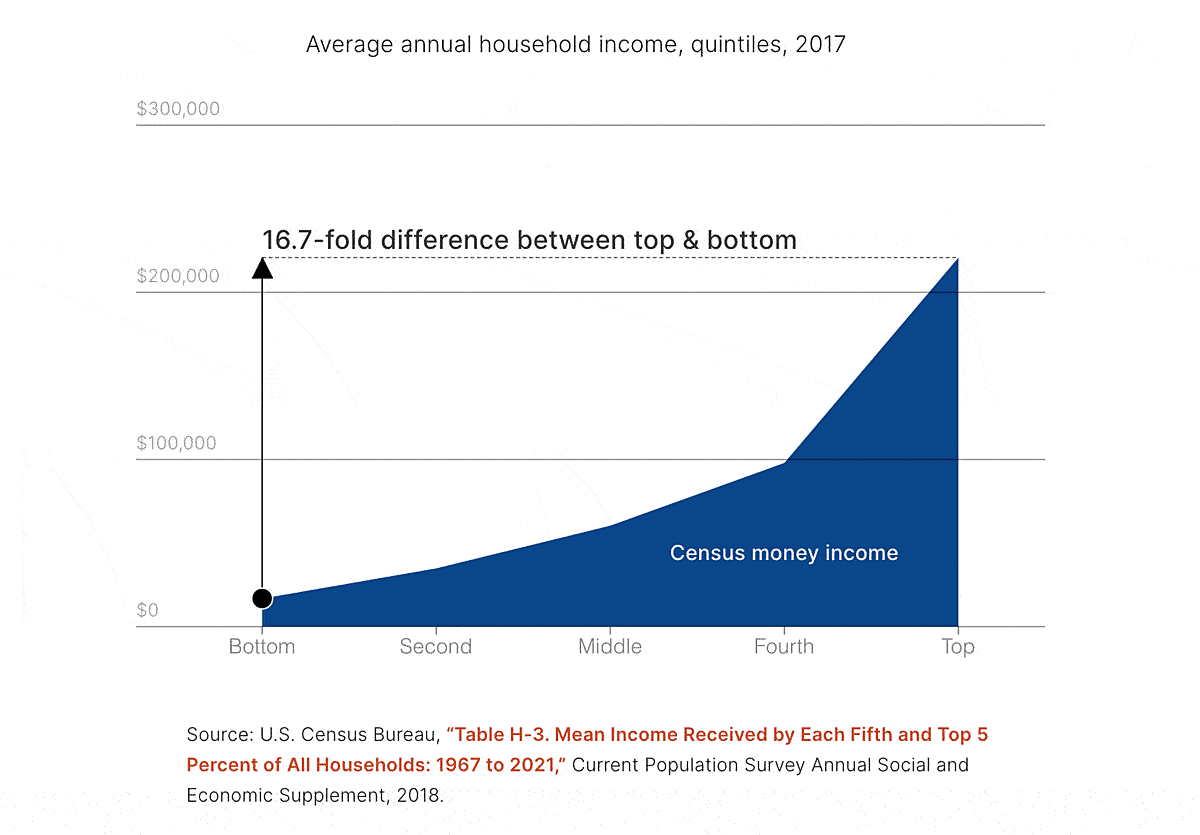
A new study from Cato adjunct scholar John Early explores how the Census Bureau overstates U.S. inequality by excluding taxes and welfare payments from the agency’s income estimates. Early shows that, when accounting for the taxes Americans (mostly middle- and higher-income) pay out of their own income and the welfare payments Americans (mostly lower-income) receive, 2017 income inequality between the top and bottom households shrinks from almost 17-to‑1 to just 4‑to‑1:
Accounting for taxes and transfers, which better reflects Americans’ actual living standards, Early’s report also shows that U.S. income inequality actually declined over the last 70 years – contrary to popular belief.
As he notes, the Census Bureau’s overstated inequality statistics are commonly used to justify even more welfare spending and programs – despite the fact that, as we showed last year, inflation-adjusted transfer payments to low-income Americans approximately tripled between 1979 and 2018, and that the share of transfer payments received by middle-income Americans more than doubled in that same time.
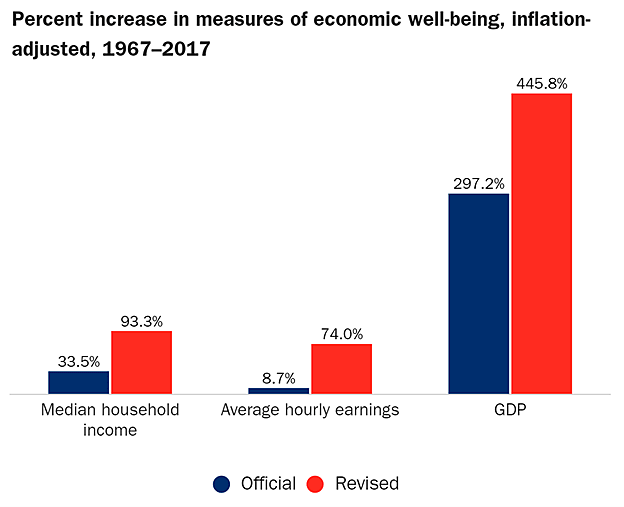
Early’s study also debunks the oft-repeated claim that American incomes and economic well-being have stagnated in recent decades: When accounting for taxes, transfers, and inflation, median household income and average hourly earnings have increased substantially between 1967 and 2017.
Indeed, as the chart below shows, the American middle class is shrinking primarily because households are moving into higher, not lower, income brackets:
More income inequality myth busting can be found in Early’s new book, The Myth of American Inequality: How Government Biases Policy Debate, co-authored with former Sen. Phil Gramm and Dr. Robert Ekelund, available for purchase online and in bookstores now.
(Special thanks to Cato’s dataviz wizards for their help creating the animated chart above.)
