A few weeks ago, American Compass released Rebuilding American Capitalism, A Handbook for Conservative Policymakers. This Forbes column (American Compass Points To Myths Not Facts) provided a very brief critique of the handbook’s “Financialization” chapter, and Oren Cass, American Compass’s Executive Director, released a response titled Yes, Financialization Is Real.
This Cato at Liberty post is the fourth in a series that expands on the original criticisms outlined in the Forbes column. (The first three in the series are available here, here, and here.) This post demonstrates the evidence does not support American Compass’s claims regarding investment. It also further documents American Compass’s failure to clearly specify terms and dates, as well as its selective use of examples that appear to support its positions.
To recap, the American Compass handbook states the following:
American finance has metastasized, claiming a disproportionate share of the nation’s top business talent and the economy’s profits, even as actual investment has declined.” [Emphasis added.]
As with profits, the “Financialization” chapter does not specify a single preferred measure of investment or any time frame for analysis. It simply complains that “In recent decades…actual investment has declined.” [Emphasis added.] The original critique stated, “The claim that investment has declined is also easily verified as false,” and then used National Income and Product Account (NIPA) data to show “investment in fixed assets has been steadily increasing since 1970, a trend that holds even if the data is adjusted for inflation.”
Cass takes issue with the original critique’s use of absolute investment dollars rather than investment as a share of GDP. Cass’s response states:
Of course, investment rises in absolute dollars as the American population grows and economy expands. Who would claim otherwise? The question is what has happened relative to GDP.
Yet, American Compass uses the term actual investment in the introduction to the “Financialization” chapter and purposely uses aggregate data in levels when doing so suits its purpose. But importantly, American Compass fails to settle on any definition of investment.
Here’s a list of direct quotes describing investment from the “Financialization” chapter:
- Unfortunately, in the United States, productive business investment has been in long-term decline and the financial industry now specializes in trading assets around in circles. [Emphasis added, no dates given.]
- Economy-wide, business investment has fallen significantly as a share of GDP. [Emphasis added, no dates given.]
- They instead become savers themselves by acquiring financial assets, effectively deferring the earthy and material work of productive capital investment to others. [Emphasis added, no dates given.]
- Statistically, this transition began in the 1980s, as the share of corporate investment in tangible assets declined and the acquisition of financial assets climbed. [Emphasis added.]
Despite this ambiguity, Cass’s response insists that readers should know exactly what investment data American Compass’s handbook is referring to because “the Rebuilding American Capitalism handbook is a synthesis of our analysis and recommendations and provides copious references to further reading alongside each proposal.” So, here’s a list of direct quotes from two other American Compass reports, none of which provide a clear answer:
- Actual-investment, by which I mean the allocation of capital toward the development of new productive capacity—the building of structures, the installment of machines, the creation of intellectual property—has been weakening in America for decades now. [Found in “The Rise of Wall Street and the Fall of American Investment“ – emphasis added.]
- As non-investors have overrun the banks and markets and taken control of corporations, actual-investment has slowed. The nation’s capital base is smaller by literally trillions of dollars as a result, representing untold enterprises never built, innovations never pursued, and workers never given opportunity. [Found in “The Rise of Wall Street and the Fall of American Investment“ – emphasis added.]
- Net non-residential fixed investment as a share of GDP has fallen by almost half, from 4.1% in the 1970s and 80s to 2.5% in the 2010s. [Found in “The Rise of Wall Street and the Fall of American Investment“ – emphasis added.]
- The classic categories of investment, structures and equipment, account for 87% of the nation’s capital base and the rate of investment there has been declining in both gross and net terms. [Found in “The Rise of Wall Street and the Fall of American Investment“ – emphasis added.]
- Net investment as a share of value-add averaged 4.3% during 1998–2000 and then 0.5% during 2002-04. During 2000–17, the average was 2.2%, leading to a $1.0 trillion shortfall over the period, relative to the 1970–99 rate. [Found in “The Rise of Wall Street and the Fall of American Investment“ – emphasis added.]
- As we have seen, the cumulative gross investment shortfall during 2009–17 as compared to 1970–99 amounted to $3.4 trillion. [Found in “The Rise of Wall Street and the Fall of American Investment“ – emphasis added.]
- Nationwide, net investment as a share of GDP has fallen sharply, and the shortfall since the Great Recession totals roughly $3 trillion (equivalent to the excess outflow from public companies). [Found in “Confronting Coin-Flip Capitalism“ – emphasis added.]
- This creates a vicious cycle in which business leaders pursuing promising opportunities become harder to find, further encouraging the financial sector to develop strategies for deriving profits disconnected from actual investment. [Found in “Confronting Coin-Flip Capitalism“ – emphasis added.]
- From 2009 to 2017, the nation needed $22.9 trillion in gross investment to match the average growth rate of the capital stock during 1970–99 (3.8% of GDP annually). Instead, investment totaled only $19.6 trillion. [Found in “Confronting Coin-Flip Capitalism“ – emphasis added.]
- Even the market fundamentalists—indeed, especially the market fundamentalists—recognize that higher investment levels would be beneficial. [Found in “Confronting Coin-Flip Capitalism“ – emphasis added.]
Setting aside American Compass’s failure to explain whether any of these versions of investment is its single preferred measure of investment to study “financialization,” it is true that there are many ways to describe investment. Indeed, there are even many different time periods, inflation adjustments, aggregation issues, and sub-components of investment that influence how an aggregate investment series behaves.
Moreover, if investment (however defined) declines, or declines slower than some metric, that fact alone would not be evidence that investment is less than optimal. While many American Compass reports imply investment is suboptimal, American Compass has not provided evidence that investment is less than what it should be.
Take, for instance, American Compass’s claim that “Net non-residential fixed investment as a share of GDP has fallen by almost half, from 4.1 percent in the 1970s and 80s to 2.5 percent in the 2010s.” If American Compass believes that that 4.1 percent was the optimal share in 1970, and a 1.6 percentage point lower share in the 2010s “threatens our future prosperity” and requires America to rebuild capitalism, then the least it can do is state a clear hypothesis and make an empirical case. Such critics cannot simply argue that a lower number is less than optimal. (For what it’s worth, American Compass’s “The Corporate Erosion of Capitalism“ also fails to provide such evidence – it is merely an accounting exercise without any economic analysis of the optimal levels of real investment individual firms need to sustain their own operations.)
It turns out, though, that the long-term trend in most of these investment measures is not decreasing. The only way to show that “investment” has declined is to selectively define the measure and period for analysis. Otherwise, it is impossible to say that investment has declined.
Regardless, there is no inherent economic reason that investment, whether in absolute amounts or relative to GDP, whether net or gross, or real or nominal, must constantly increase. A developed economy with evolving working patterns, for instance, would not need to constantly invest more in new corporate structures.
Similarly, the rate of growth of investment does not have to constantly match or exceed GDP (or profit) growth in any historical period. The mere fact that some metric of investment grows slower than some other economic measure – even for an extended period – does not indicate that the economy will be harmed much less that “financialization” caused the “slow” growth.
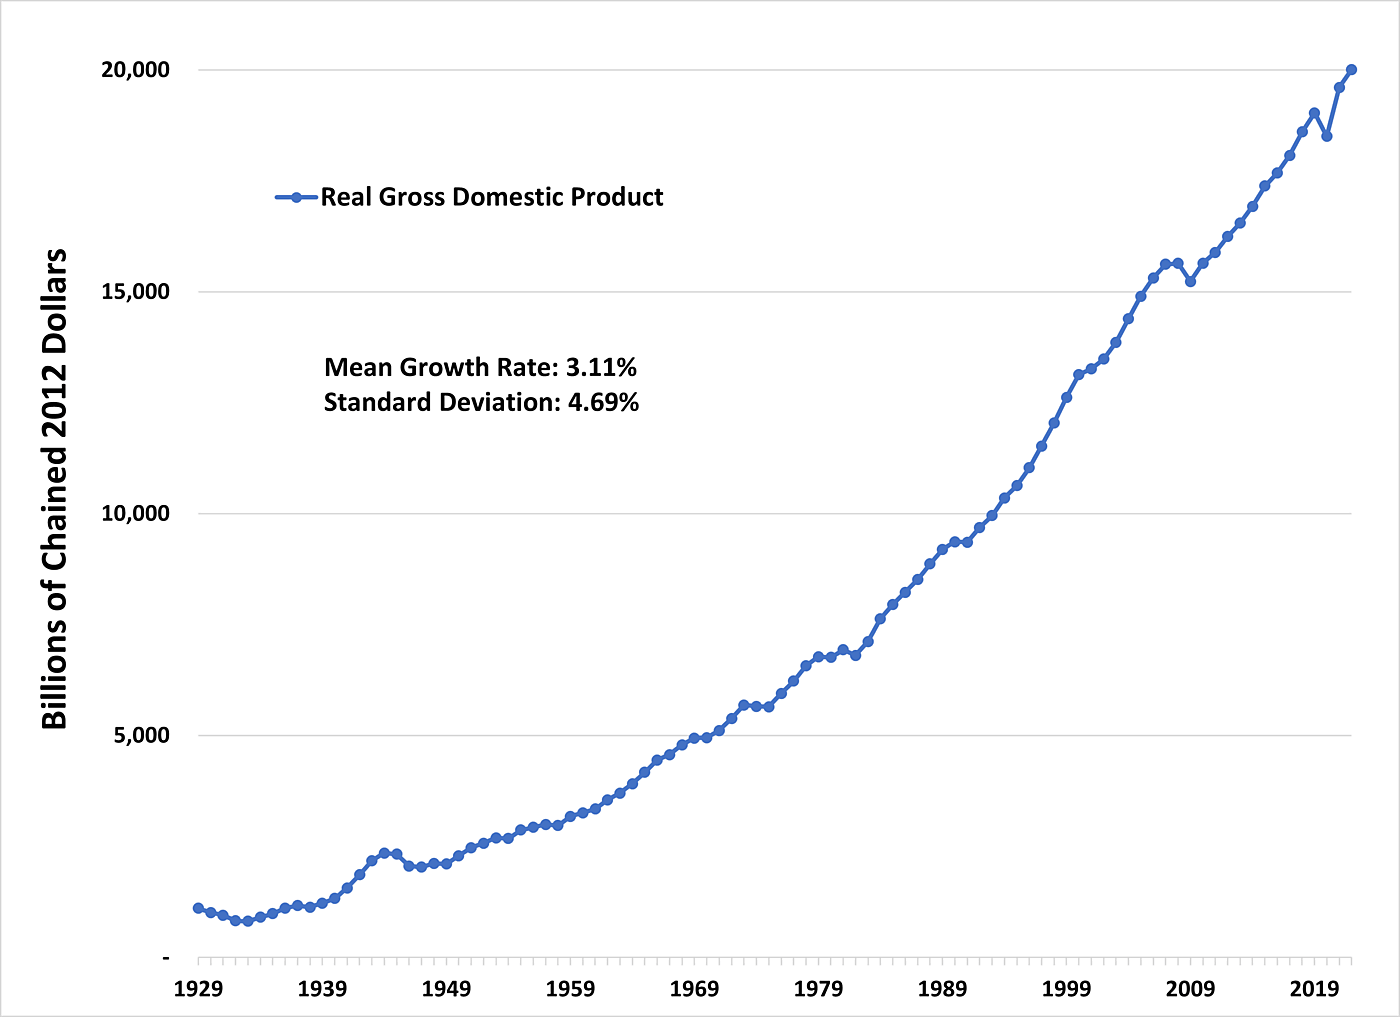
Our analysis now turns to the actual time series of real investment and real GDP, respectively (see Figure 1 and Figure 2). Contrary to what Cass claims in his response, the right question is not always “what has happened [to investment] relative to GDP.” (Even if it was the correct question, simply dividing investment by GDP would not adequately account for confounding factors such as population growth, the cost of investment, productivity, feedback loops, etc.) Bluntly, it is not at all clear that using a relative measure is the “right” way to look at investment.

For starters, nobody invests in amounts relative to GDP, and even American Compass often refers to levels of investment. Regardless, there are some basic mathematical issues that suggest, at the very least, researchers must be very careful drawing inferences from relative investment measures.
As Figure 1 and Figure 2 show, real (gross private domestic) investment and real GDP both display a sharp upward trend. However, the two series exhibit an enormous difference in size and volatility – the standard deviation of investment growth is five times greater than for GDP growth. A 20 percent year-to-year decline in investment is normal, but it would be highly unusual for GDP. Moreover, any decline in the ratio can easily mask the causal relationship between investment and economic growth.
Put differently, GDP is stable but one of its components – investment – fluctuates rapidly. This stability arises as investment accounts for only 13 percent of GDP on average and fluctuations in investment can be offset by counter-cyclical fluctuations in other components of GDP, such as consumption or fiscal spending. Consequently, measuring investment relative to GDP can give the appearance that something dreadful has happened even though such deviations may be the result of a perfectly normal economy, even one with optimal decision making.
Investment’s high volatility is a commonly known macroeconomic fact. Benchmark macro models dating back to the start of macroeconomic modeling itself have highlighted investment’s significant volatility in comparison to the rest of the economy. Successes of models since then are measured (at least in part) by whether their simulated time series can match the observed volatility of macro indicators such as investment.
Leaving the appropriateness of using levels aside, we now examine nominal investment relative to nominal GDP (i.e., the investment-to-GDP ratio), as well as several of its component measures. (See Figure 3.) These nominal metrics are available from 1929, but in fairness to American Compass, we only present the data from 1950 onwards. The series exhibits high volatility between 1929 and 1950 and starting the graph in 1929 biases the data toward a steeper increasing trend for investment and its component measures. (Incidentally, replicating Figure 3 with real investment and GDP figures also shows the ratio exhibiting an increasing trend.[1])
As Figure 3 shows, the investment-to-GDP ratio exhibits variation around a very mildly increasing trend for all of modern U.S. economic history. As for component measures, non-residential investment has grown significantly as a share of the economy, offsetting the decline in the share of residential investment. Finally, net private domestic investment has declined over time. From this set of investment measures, focusing only on net private domestic investment to argue “actual investment” has declined equates to selectively using a sub-component of investment while ignoring others.

Of course, there are still many other ways to describe investment. Assume, for example, that net nonresidential (or business) investment is the “right” measure to analyze, as Cass’s response suggests. Figure 4 presents real net business investment and its subcomponents from 1967 to 2021.[2] It shows that net business investment exhibits a sharp increasing trend. (Figure 3 showed that nonresidential investment as a share of GDP exhibits an increasing trend.) While the trends are not as steep for the subcomponents, Figure 4 shows that net investment in business equipment and intellectual property also display increasing trends. However, net business investment in structures exhibits a decreasing trend. (Interestingly, in The Rise of Wall Street and the Fall of American Investment, American Compass groups structures and equipment together to demonstrate that investment in “Structures & Equipment” is declining.)

Obviously, it would make little sense to argue that “actual investment” is declining by focusing only on the decline in the net structure subcomponent, or any other component of investment for a shorter period. Put bluntly, American Compass is incorrect to use declines in any of these subcomponents to argue that there is some kind of broad decline in investment.
Still, the trends in these subcomponents on Figure 4 are even more problematic for American Compass. Not only do the trends contradict that investment is in a general decline, but American Compass’s story requires an explanation for: (1) why the highly developed U.S. economy needs constantly increasing growth in structures; and, (2) how “financialization” is responsible for a decline in structure investment and a simultaneous increase in equipment and IP investment.
It is also worth noting that while there’s nothing inherently wrong with using net investment figures, as American Compass sometimes does, neither the Bureau of Economic Analysis’s depreciation estimates nor accounting depreciation perfectly coincide with economic depreciation. In other words, even when someone fully depreciates a piece of equipment for tax or accounting purposes, it does not mean that the equipment is no longer useful and must be immediately replaced.
More generally, from a macroeconomic perspective, there is no reason to distinguish between different sub-components of investment. The primary macro indicator of economic health is real GDP growth away from trend (or similar metrics such as output gap and unemployment). Investment is a means of facilitating capital accumulation and it is not immediately clear why one component of it is necessarily better than any other. This is why seminal empirical economic papers always focus on investment as an aggregate. Even highly cited papers that explicitly model net investment don’t bother to include it in their results, instead focusing again on aggregate investment.
Overall, aggregate investment in the United States is not in decline. Yet, American Compass relies on a wide array of investment descriptions, in various time periods, to argue that American investment is in a general decline and below optimal levels. American Compass’s error is only compounded by its imprecise definition of financialization. This combination of errors leaves American Compass with little more than a set of stories that appear to provide evidence financial markets threaten American capitalism.
In the next post, we will conclude this series by discussing American Compass’s flawed characterization of Americans’ income.
[1] It may seem unintuitive that shares would be different between nominal and real variables (prices on the numerator and denominator should cancel out), but the relative price of investment has changed significantly in comparison to overall GDP. Specifically, the deflator for investment has been significantly higher than for GDP, equalizing only since the 2010s.
[2] The BEA provides values for sub-components of investment that only go back to 1967.
