During his State of the Union speech, President Trump will tout his plan for draconian restrictions on legal immigrants. Supporters, like House Judiciary Committee Chairman Bob Goodlatte (R‑VA), justify the plan by claiming that America is “by far the most generous nation in the world for legal immigration.” Not only is “by far” clearly false, but when you consider its wealth, America is already among the least generous to immigrants around the world.
The United States ranks in the bottom third of wealthy countries in terms of net new immigration as a share of total population from 2015 to 2017 as well as total foreign-born residents as a share of total population, according to figures from the United Nations. Trump’s plan would make America even more closed than it already is.
The United Nations data contains information on the foreign-born populations in all countries (or semi-independent provinces) around the world.* U.S. immigration is decidedly unimpressive compared to all countries. Although America does have the highest total number of foreign-born residents in the world, a fair comparison requires controlling for the size of its current population. After all, a million new people entering India with a population of 1.3 billion would have very different effects than a million new people entering Estonia with a population of 1.3 million.
With this in mind, it is clear that America is nowhere near “the most generous country in the world” on immigration. Of the 232 jurisdictions that the UN includes, America ranks just 64th overall. Focusing on the rate of new immigrants as a share of total population, the United States had only the 49th highest net immigration rate from 2015 to 2017 (inflows minus outflows of foreign residents divided by total population). This places the United States rank in the 72nd and 79th percentiles in the world, respectively.
This assessment is still misleading, however, because it compares the United States to countries that very few immigrants would want to immigrate to. The United States’ ranking among more prosperous countries is even less inspiring. Of the 50 countries or provinces which had, according to the United Nations, a gross domestic product (GDP) of at least $20,000 per capita in 2015, the United States has the 34th highest share of foreign-born residents as well as the 34th highest net immigration rate (Table 1). This places the United States rank in the 32nd percentile on both measures.
The 50 most prosperous countries have double both the average foreign-born share and average immigration rate of the United States. Those countries at or above the 50th percentile have an average foreign-born share three times the U.S. share and an immigration rate four times as high as the U.S. rate. The United States is far from generous: it is downright stingy to immigrants. Figure 1 provides the net immigration rate from 2015 to 2017 for the United States and the 33 countries that rank higher than it.
Figure 1: Countries With Highest Net Per Capita Immigration From 2015 to 2017 and a Per Capita GDP Above $20,000 in 2015
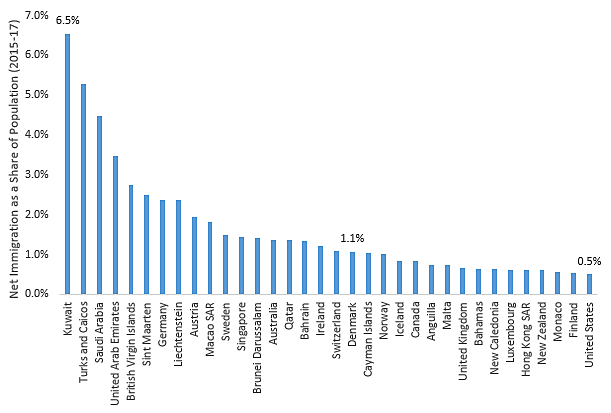
Sources: United Nations (Foreign Populations); United Nations (Total Populations); United Nations (GDP Per Capita)
This still considerably overstates America’s generosity because such a large share of America’s foreign-born population is here illegally: almost a quarter. This appears to be one of the highest shares in the world. Many of America’s immigrants are already defying America’s attitude toward them. In other words, U.S. law is not only hostile toward new immigrants. It is hostile toward its existing foreign-born residents.
By almost any reasonable standard, America is already one of the least generous countries in the world toward legal immigrants. If the United States does implement the White House’s immigration framework, it would be moving its nation’s immigration system in the opposite direction of the rest of the world. Other developed economies are opening their borders to more immigrants than ever, while the United States would have sent its immigration rate back to its lowest level since World War II.
America, however, doesn’t need to be “generous” toward immigrants at all. It is in the country’s self-interest not to prohibit foreigners from living and working in America. Allowing people to freely move and work where they want is not charity. It is an expansion of the free market and allows people to contribute to the economic prosperity of the country and expand the pie for everyone. The president’s plan would make America both less generous and less prosperous.
Table 1: Immigration and Immigrant Population Ranking for Countries with Greater Than $20,000 Per Capita Gross Domestic Product
| Increase in Foreign-Born* From 2015–17 As a Share of Total Population | Total Foreign-Born* Residents as a Share of Total Population | |||
| Country | Rate | Country | Share | |
|
1 |
Kuwait |
6.5% |
United Arab Emirates |
90.8% |
|
2 |
Turks and Caicos |
5.3% |
Kuwait |
79.4% |
|
3 |
Saudi Arabia |
4.5% |
Sint Maarten |
72.9% |
|
4 |
United Arab Emirates |
3.5% |
Turks and Caicos |
71.4% |
|
5 |
British Virgin Islands |
2.7% |
Qatar |
69.4% |
|
6 |
Sint Maarten |
2.5% |
British Virgin Islands |
66.3% |
|
7 |
Germany |
2.4% |
Liechtenstein |
66.0% |
|
8 |
Liechtenstein |
2.4% |
China, Macao SAR |
58.8% |
|
9 |
Austria |
1.9% |
Monaco |
55.5% |
|
10 |
Macao SAR |
1.8% |
Bahrain |
52.7% |
|
11 |
Sweden |
1.5% |
Andorra |
52.6% |
|
12 |
Singapore |
1.4% |
Singapore |
47.4% |
|
13 |
Brunei Darussalam |
1.4% |
Luxembourg |
46.6% |
|
14 |
Australia |
1.4% |
Cayman Islands |
40.6% |
|
15 |
Qatar |
1.4% |
Hong Kong SAR |
39.8% |
|
16 |
Bahrain |
1.3% |
Saudi Arabia |
38.6% |
|
17 |
Ireland |
1.2% |
Anguilla |
38.2% |
|
18 |
Switzerland |
1.1% |
Aruba |
34.8% |
|
|
Average |
1.1% |
Average |
30.9% |
|
19 |
Denmark |
1.1% |
Bermuda |
30.6% |
|
20 |
Cayman Islands |
1.0% |
Switzerland |
30.1% |
|
21 |
Norway |
1.0% |
Australia |
29.6% |
|
22 |
Iceland |
0.8% |
Brunei Darussalam |
26.0% |
|
23 |
Canada |
0.8% |
New Caledonia |
24.5% |
|
24 |
Anguilla |
0.7% |
Israel |
24.3% |
|
25 |
Malta |
0.7% |
Curaçao |
24.3% |
|
26 |
United Kingdom |
0.7% |
New Zealand |
23.1% |
|
27 |
Bahamas |
0.6% |
Canada |
21.9% |
|
28 |
New Caledonia |
0.6% |
Austria |
19.1% |
|
29 |
Luxembourg |
0.6% |
Sweden |
17.9% |
|
30 |
Hong Kong SAR |
0.6% |
Ireland |
17.2% |
|
31 |
New Zealand |
0.6% |
Cyprus |
16.3% |
|
32 |
Monaco |
0.6% |
Bahamas |
16.0% |
|
33 |
Finland |
0.5% |
San Marino |
15.9% |
|
34 |
United States |
0.5% |
United States |
15.6% |
|
35 |
Curaçao |
0.5% |
Norway |
15.4% |
|
36 |
Netherlands |
0.4% |
Germany |
14.9% |
|
37 |
Slovenia |
0.3% |
United Kingdom |
13.5% |
|
38 |
Aruba |
0.2% |
Spain |
12.8% |
|
39 |
San Marino |
0.2% |
Iceland |
12.7% |
|
40 |
Italy |
0.2% |
France |
12.3% |
|
41 |
Belgium |
0.1% |
Netherlands |
12.1% |
|
42 |
Spain |
0.1% |
Slovenia |
11.8% |
|
43 |
Japan |
0.1% |
Denmark |
11.5% |
|
44 |
Republic of Korea |
0.0% |
Belgium |
11.2% |
|
45 |
Greenland |
0.0% |
Greenland |
10.7% |
|
46 |
France |
0.0% |
Malta |
10.6% |
|
47 |
Cyprus |
-0.3% |
Italy |
9.9% |
|
48 |
Bermuda |
-0.3% |
Finland |
6.3% |
|
49 |
Israel |
-0.6% |
Republic of Korea |
2.3% |
|
50 |
Andorra |
-1.3% |
Japan |
1.8% |
Sources: United Nations (Foreign Populations); United Nations (Total Populations); United Nations (GDP Per Capita)
*Note: The UN defines “foreign-born” to include people who receive citizenship through their parents despite being born overseas. Typically, the United States does not consider such people “immigrants” as they are citizens at birth. This results in a higher share of foreign-born for the United States than other estimates.
