Yesterday, another round of scores on the National Assessment of Educational Progress – the so-called “Nation’s Report Card” — came out. They revealed flattened 4th-grade math achivement between 2007 and 2009, and a two point (out of 500) increase in 8th grade.
So what do these bits of data portend? Ask the experts:
“The trend is flat; it’s a plateau. Scores are not going anywhere, at least nowhere important,” said Chester Finn, president of the Thomas B. Fordham Institute, according to the New York Times. “That means that eight years after enactment of No Child Left Behind, the problems it set out to solve are not being solved, and now we’re five years from the deadline and we’re still far, far from the goal.”
Next, former National Center for Education Statistics commissioner Mark Schneider concluded that “either the standards movement has played out, or the No Child law failed to build on its momentum. Whatever momentum we had, however, is gone.”
And then there’s Michigan State University professor William Schmidt, a leading national-standards proponent, who opined in the Baltimore Sun that “there is a hardly any change. There is hardly any difference. How could we as a nation let that happen?” His solution to the problem: National standards, of course.
So what do I think about all this? As a long-time critic of NCLB, I am glad to see people seizing on the latest results and declaring the law a failure. It helps to advance my goal of ending the greatest federal education intervention to date, and I think NCLB supporters kind of deserve these attacks on their law. They have repeatedly given NCLB credit for positive things the evidence couldn’t come close to supporting, and it’s nice to see them on the defensive after all their overreaching.
That said, just as previous NAEP results couldn’t prove that NCLB was working, the latest NAEP scores don’t prove that it is not. We simply don’t have sufficient information about the myriad other variables affecting education to do that.
Which leads me to a much bigger problem: People using ambiguous NAEP scores to push their favorite reforms. Some “standards and accountability” proponents, for instance, argue that achievement improvements came as a result of states implementing standards-and-testing regimes during the 1990s. And William Schmidt suggests that the latest NAEP results demonstrate a need for national standards.
Now, NAEP simply cannot be used in any reasonable way to justify the national-standards assertion. We’ve never had national standards, so we obviously can’t measure their outcomes with NAEP. We can, however, attempt to use NAEP to assess the assertion that the push for state standards and testing in the 1990s drove real improvement. We can attempt, that is, but any conclusions will be riddled with problems.
Let’s start with the NAEP exam from which yesterday’s results came, the “main” mathematics exam. After that, we’ll look at some “long-term” NAEP results.
Take a look at the chart below. It is the 4th-grade trend line for the main math NAEP, with vertical lines separating what I’ll call the pre-accountability period (1990–1996), the state-accountability period (1996–2003), and the NCLB period (2003–2009). The numbers below each period are the per-year changes in scores for the periods above them.
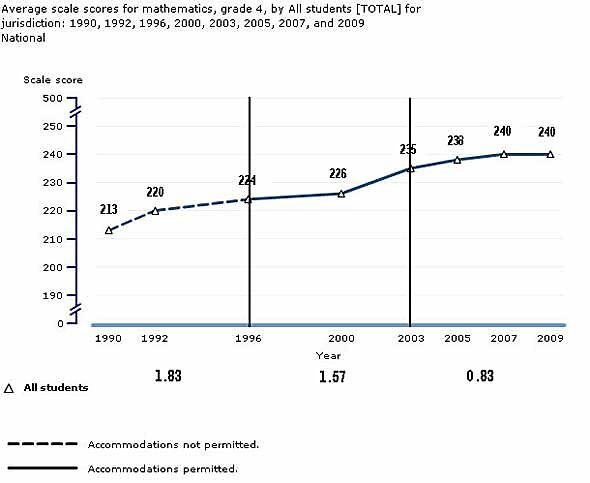
What do the numbers show us? At first blush, the message seems to be that scores were improving slightly faster in the pre-accountability period than the vaunted state-accountability period, and appreciably faster than under NCLB. But this breakdown may beg more questions than it answers.
At what year, for instance, should you peg the start of the state-accountability period? I chose 1996 because by then, according to a count by Hanushek and Raymond (Table 1), twelve states — a pretty large number — had some sort of accountability mechanism in place. I could, however, have chosen 1992, because by 1993 three states had such mechanisms and the accountability movement could certainly be said to have been underway. Similarly, NCLB was enacted in 2002 — is it right to start the NCLB period in 2003? Obviously I couldn’t start the period in 2002 because there is no data for that year, but why not 2005? After all, though enacted in 2002, NCLB took a few years to be fully implemented.
Let’s make an adjustment. I’m going to keep the start of the NCLB era at 2003 because that’s pretty close to the enactment year — though it could very well produce misleading results — but will move the end of the pre-accountability period, and hence the start of the state-accountability period, to 1992.
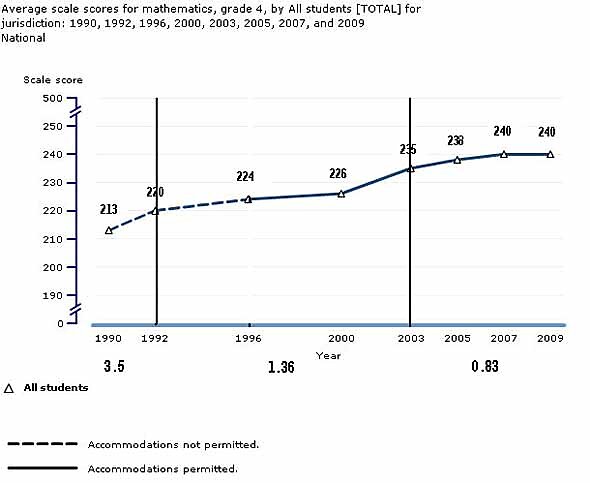
Now what should we conclude? Again, it appears that the pre-accountability period had the best results, but this time by a much bigger margin. That said, that period included only two years — hardly sufficient data to identify a trend. Also, the NCLB period fared better than previously against the state-accountability years.
Of course, the main NAEP gives us data for less than two decades. So what does the long-term NAEP show for 9‑year-olds (roughly 4th graders) in math?
Here’s a long-term trend chart, which like the main NAEP charts above is broken into periods with score-change-per-year noted below. I’ve broken it into the period before the 1983 publication of the landmark A Nation at Risk report, which scared people silly about the schools; the post-ANARbut pre-state-accountability period; the state-accountability period; and the NCLB period.
What do these results show?
In contrast to the main NAEP scores, the greatest improvement on the long-term test occurred during the state accountability period, and the second greatest under NCLB. But again, this raises more questions than it answers: Why the difference between the main and long-term results? When is best to start each period? Does it make any sense to start a period with A Nation at Risk? Should the NCLB period start in 1999, well before the law was enacted, or in 2004, two years after it’s passage? And the questions go on.
Like we did with the main NAEP results, let’s once again look at a different start date, 1992, for the state-accountability period, this time on the long-term exam.
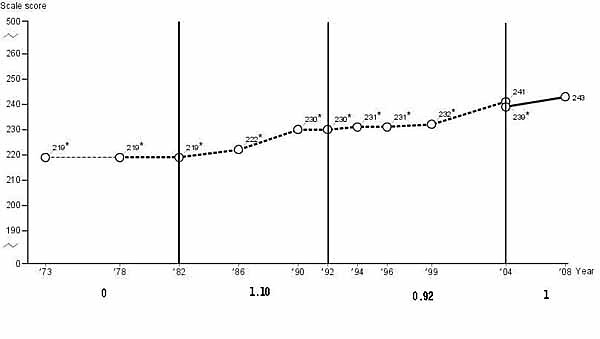
Once again we get a whole different story. Now it is the pre-accountability period, not the state accountability period, that shows the best outcomes. And so the ambiguity continues…
All of this, of course, goes to show that NAEP results cannot be used with any confidence to conclude that any particular reform that occurred within the NAEP time span worked better or worse than any other reform within that span.
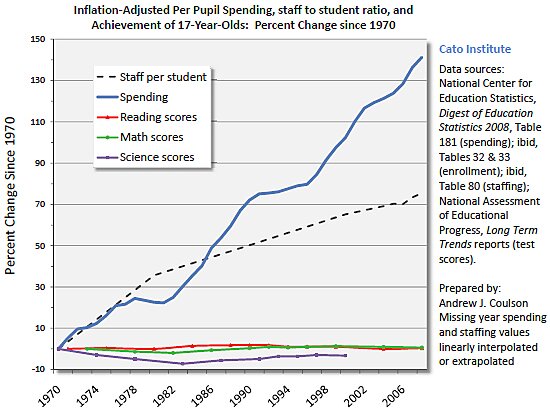
That said, there is one thing that we canuse NAEP to demonstrate very powerfully: As Andrew Coulson’s chart below vividly illustrates, if moving the achievement needle as measured by NAEP is the goal of education spending, then we have really been getting robbed! Moreover, to the extent that standards-based reforms have been a major national phenomenon since the 1990s, it is impossible to conclude that they have done very much good. Indeed, if we are to conclude anything, it is that it is time to focus on reforms that are completely different from the top-down “solutions” that have given us so little, and taken so much.