Global Science Report is a feature from the Center for the Study of Science, where we highlight one or two important new items in the scientific literature or the popular media. For broader and more technical perspectives, consult our monthly “Current Wisdom.”
—
Pat Michaels is in San Francisco this week attending the annual meeting of the American Geophysical Union (AGU) and presenting a poster detailing the widening mismatch between observations of the earth’s temperature and climate model projections of its behavior. Since most global warming concern (including that behind regulatory action) stems from the projections of climate models as to how the earth’s temperature will evolve as we emit greenhouse gases into the atmosphere (as a result of burning fossil fuels to produce energy), it is important to keep a tab on how the model projections are faring when compared with reality. That they are faring not very well should be more widely known—Pat will spread the word while there.
We don’t want those of you who are unable to attend the conference to think you are missing out on anything, so we have reformatted our poster presentation to fit this blog format (it is available in its original format here).
———–
Quantifying the Lack of Consistency between Climate Model Projections and Observations of the Evolution of the Earth’s Average Surface Temperature since the Mid-20th Century
Patrick J. Michaels, Center for the Study of Science, Cato Institute, Washington DC
Paul C. Knappenberger, Center for the Study of Science, Cato Institute, Washington DC
INTRODUCTION
Recent climate change literature has been dominated by studies which show that the equilibrium climate sensitivity is better constrained than the latest estimates from the Intergovernmental Panel on Climate Change (IPCC) and the U.S. National Climate Assessment (NCA) and that the best estimate of the climate sensitivity is considerably lower than the climate model ensemble average. From the recent literature, the central estimate of the equilibrium climate sensitivity is ~2°C, while the climate model average is ~3.2°C, or an equilibrium climate sensitivity that is some 40% lower than the model average.
To the extent that the recent literature produces a more accurate estimate of the equilibrium climate sensitivity than does the climate model average, it means that the projections of future climate change given by both the IPCC and NCA are, by default, some 40% too large (too rapid) and the associated (and described) impacts are gross overestimates.
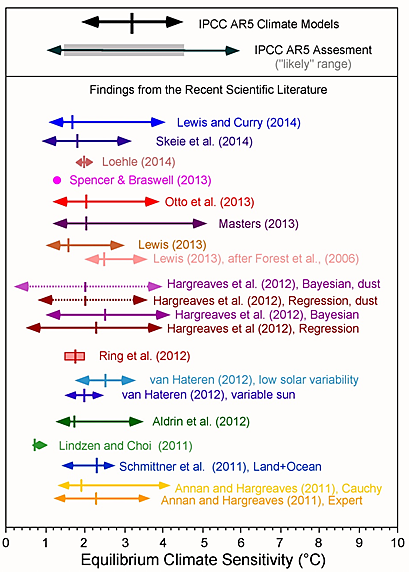
CAPTION: Climate sensitivity estimates from new research beginning in 2011 (colored), compared with the assessed range given in the Intergovernmental Panel on Climate Change (IPCC) Fifth Assessment Report (AR5) and the collection of climate models used in the IPCC AR5. The “likely” (greater than a 66% likelihood of occurrence) range in the IPCC Assessment is indicated by the gray bar. The arrows indicate the 5 to 95 percent confidence bounds for each estimate along with the best estimate (median of each probability density function; or the mean of multiple estimates; colored vertical line). Ring et al. (2012) present four estimates of the climate sensitivity and the red box encompasses those estimates. The right-hand side of the IPCC AR5 range is actually the 90% upper bound (the IPCC does not actually state the value for the upper 95 percent confidence bound of their estimate). Spencer and Braswell (2013) produce a single ECS value best-matched to ocean heat content observations and internal radiative forcing. The mean climate sensitivity (3.2°C) of the climate models used in the IPCC AR5 60% greater than the mean of recent estimates (2.0°C).
A quantitative test of climate model performance can be made by comparing the range of model projections against observations of the evolution of the global average surface temperature since the mid-20th century. Here, we perform such a comparison on a collection of 108 model runs comprising the ensemble used in the IPCC’s 5th Scientific Assessment and find that the observed global average temperature evolution for trend lengths (with a few exceptions) since 1980 is less than 97.5% of the model distribution, meaning that the observed trends are significantly different from the average trend simulated by climate models. For periods approaching 40 years in length, the observed trend lies outside of (below) the range that includes 95% of all climate model simulations.
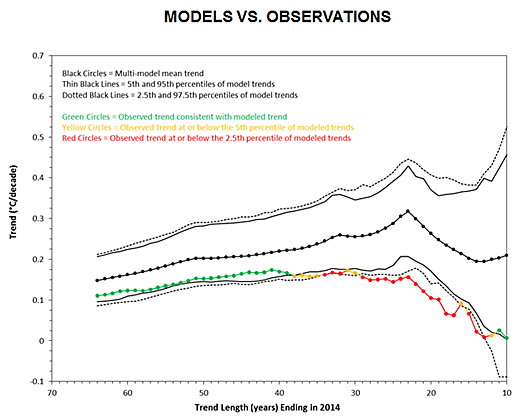
CAPTION: The annual average global surface temperatures from 108 individual CMIP5 climate model runs forced with historical (+ RCP45 since 2006) forcings were obtained from the KNMI Climate Explorer website. Linear trends were computed through the global temperatures from each run, ending in 2014 and beginning each year from 1951 through 2005. The trends for each period (ranging in length from 10 to 64 years) were averaged across all model runs (black dots). The range containing 90 percent (thin black lines), and 95 percent (dotted black lines) of trends from the 108 model runs is indicated. The observed linear trends for the same periods were calculated from the annual average global surface temperature record compiled by the U.K. Hadley Center (HadCRUT4) (colored dots) (the value for 2014 was the 10-mon, January through October, average). Observed trend values which were less than or equal to the 2.5th percentile of the model trend distribution were colored red; observed trend values which were between the 2.5th and the 5th percentile of the model trend distribution were colored yellow; and observed trend values greater than the 5th percentile of the model trend distribution were colored green.
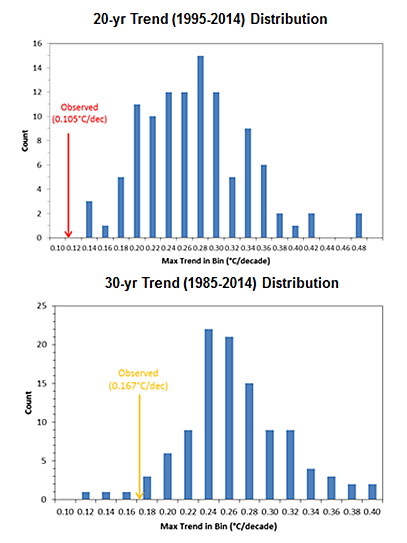
CAPTION: Distribution of 20-yr temperature trends (top) and 30-yr temperature trends (right) from 108 climate model runs during the period ending in 2014 (blue bars). The observed 20-yr temperature trend (bottom) and 30-yr temperature trend (right) over the same intervals are indicated by the arrows colored to match the designations described in the previous figure.
CONCLUSIONS
We conclude that at the global scale, this suite of climate models has failed. Treating them as mathematical hypotheses, which they are, means that it is the duty of scientists to reject their predictions in lieu of those with a lower climate sensitivity.
It is impossible to present reliable future projections from a collection of climate models which generally cannot simulate observed change. As a consequence, we recommend that unless/until the collection of climate models can be demonstrated to accurately capture observed characteristics of known climate changes, policymakers should avoid basing any decisions upon projections made from them. Further, those policies which have already be established using projections from these climate models should be revisited. Assessments which suffer from the inclusion of unreliable climate model projections include those produced by the IPCC and the U.S. Global Climate Change Research Program (including their most recent National Climate Assessment). Policies which are based upon such assessments include those established by the U.S. Environmental Protection Agency pertaining to the regulation of greenhouse gas emissions under the Clean Air Act.
REFERENCES
Aldrin, M., et al., 2012. Bayesian estimation of climate sensitivity based on a simple climate model fitted to observations of hemispheric temperature and global ocean heat content. Environmetrics, doi: 10.1002/env.2140.
Annan, J.D., and J.C Hargreaves, 2011. On the generation and interpretation of probabilistic estimates of climate sensitivity. Climatic Change, 104, 324–436.
Hargreaves, J.C., et al., 2012. Can the Last Glacial Maximum constrain climate sensitivity? Geophysical Research Letters, 39, L24702, doi: 10.1029/2012GL053872
Intergovernmental Panel on Climate Change, 2013. Climate Change 20013: The Physical Science Basis. Contribution of Working Group I to the Fifth Assessment Report of the Intergovernmental Panel on Climate Change. Final Draft Accepted in the 12th Session of Working Group I and the 36th Session of the IPCC on 26 September 2013 in Stockholm, Sweden.
Lewis, N. 2013. An objective Bayesian, improved approach for applying optimal fingerprint techniques to estimate climate sensitivity. Journal of Climate, doi: 10.1175/JCLI-D-12–00473.1.
Lewis, N. and J.A. Curry, C., 2014. The implications for climate sensitivity of AR5 focring and heat uptake estimates. Climate Dynamics, 10.1007/s00382-014‑2342‑y.
Lindzen, R.S., and Y‑S. Choi, 2011. On the observational determination of climate sensitivity and its implications. Asia-Pacific Journal of Atmospheric Science, 47, 377–390.
Loehle, C., 2014. A minimal model for estimating climate sensitivity. Ecological Modelling, 276, 80–84.
Masters, T., 2013. Observational estimates of climate sensitivity from changes in the rate of ocean heat uptake and comparison to CMIP5 models. Climate Dynamics, doi:101007/s00382-013‑1770‑4
Michaels, P.J., et al., 2002. Revised 21st century temperature projections. Climate Research, 23, 1–9.
Morice, C.P. et al. 2012. Quantifying uncertainties in global and regional temperature change using an ensemble of observational estimates: The HadCRUT4 dataset. Journal of Geophysical Research, 117, D08101, doi:10.1029/2011JD017187 (and updates, current version 4.3.0.0).
Otto, A., et al., 2013. Energy budget constraints on climate response. Nature Geoscience, 6, 415–416.
Ring, M.J., et al., 2012. Causes of the global warming observed since the 19th century. Atmospheric and Climate Sciences, 2, 401–415, doi: 10.4236/acs.2012.24035.
Schmittner, A., et al. 2011. Climate sensitivity estimated from temperature reconstructions of the Last Glacial Maximum. Science, 334, 1385–1388, doi: 10.1126/science.1203513.
Skeie, R. B., et al., 2014. A lower and more constrained estimate of climate sensitivity using updated observations and detailed radiative forcing time series. Earth System Dynamics, 5, 139–175.
Spencer, R. W., and W. D. Braswell, 2013. The role of ENSO in global ocean temperature changes during 1955–2011 simulated with a 1D climate model. Asia-Pacific Journal of Atmospheric Science, doi:10.1007/s13143-014‑0011‑z.
van Hateren, J.H., 2012. A fractal climate response function can simulate global average temperature trends of the modern era and the past millennium. Climate Dynamics, doi: 10.1007/s00382-012‑1375‑3.
