In our recent brief on immigrant crime, we focused on the 18 to 54 age range when looking at the incarcerated and non-incarcerated populations. This was necessary because the American Community Survey data for weighted responses does not distinguish between the type of group quarters – which are prisons, universities and colleges, mental health facilities, nursing homes, and others.
By narrowing our focus to those in the 18 to 54 age range we were able to cut out about 1.4 million folks in elderly care facilities but only excluded about 206,000 prisoners or about 9.2 percent of the total. Excluding those under the age of 18 also removed most respondents in mental health facilities but only decreased the adult criminal population by 0.2 percent.
Figure 1 did not make it into our final brief but it shows a big difference in the distribution of ages between the three groups we examined. The median age of illegal immigrants and natives is 35 – almost exactly in the middle of the 18 to 54 age range. Interestingly, there is a dip in the age distribution for natives in their late thirties and early forties while the age distribution of illegal immigrants is shaped like a bell. In contrast, the median for legal immigrants was 41 which is on the older side of the distribution.
Figure 1
Age (18–54) Distribution of Illegal Immigrants, Legal Immigrants, and Natives
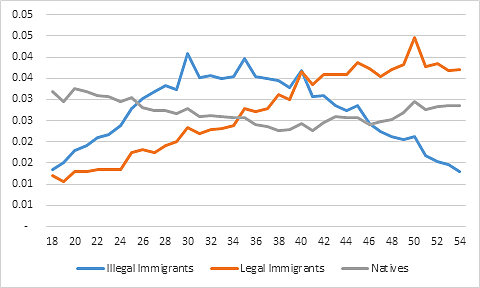
Source: ACS and authors’ calculations.
Criminals are disproportionately young so it would be reasonable to expect natives to be more crime-prone before the age of 27 and illegal immigrants to have a higher crime rate than legal immigrants. That could explain part of the difference in crime rates between natives and illegal immigrants. The surprising result is that illegal immigrants are so much less crime prone when immigration-only offenders are excluded even though they are younger than legal immigrants and have a median age that is the same as natives. The young age and low education of illegal immigrants are consistent with more criminality in other populations.
The most surprising finding from our brief is that illegal immigrant women are less than half as likely to be incarcerated as women who are legal immigrants or natives (Figure 2). Illegal immigrants are slightly less likely to be women in this age range, only 48.5 percent compared to 51 percent for legal immigrants and 50 percent for natives, but that doesn’t explain the difference in rates. It could be related to low female illegal immigrant labor force participation rates (LFPR) or caused by the same mechanism that induces those lower LFPRs.
Figure 2
Characteristics of Prisoners by Sex and Nativity, Ages 18–54
|
Natives |
Legal Immigrants |
lllegal Immigrants |
All |
|
| Female |
11.47% |
10.73% |
4.58% |
11.06% |
| Male |
88.53% |
89.27% |
95.42% |
88.94% |
Source: ACS and authors’ calculations.
