Twenty years ago last week, Congress enacted the most extensive welfare reform law since the 1960s, the Personal Responsibility and Work Opportunity Reconciliation Act. Cato scholars have long championed a particular aspect of the reform bill that excluded recent legal immigrants from federal means-tested public benefits and have argued for extending the law’s restrictions. Welfare reform was successful: immigrants thrived without government support.
The theory behind welfare reform was that depriving benefits from immigrants would incentivize those already here to find jobs and encourage only those who wanted to work to come. This theory has appeared to work out in practice. Following the law’s enactment, immigrants who were most likely to be targeted by its restrictions responded by working more, which decreased the prevalence of poverty in their households.
While the 1996 reform restricted welfare in some ways for both native-born citizens (natives) and naturalized citizens, the law imposed the harshest restriction on noncitizens, barring them from any means-tested public benefits until they became eligible to apply for citizenship—5 years after receiving lawful permanent residency in the United States. The Census Bureau’s Current Population Survey details the unemployment among noncitizens and native-born or naturalized citizens.
All groups saw reductions in unemployment post-welfare reform, but noncitizens saw the greatest reduction in unemployment from 1996 to 2016. In 1996, natives had an unemployment rate that was 3 percentage points lower than the rate among noncitizens. By 2016, the rates for each group had converged. While unemployment among naturalized citizens also declined during this time, the noncitizen unemployment dropped much further (3.4 percent compared to 0.9 percent).
Figure 1: Unemployment Rate among Noncitizen, Native-Born and Naturalized Citizens
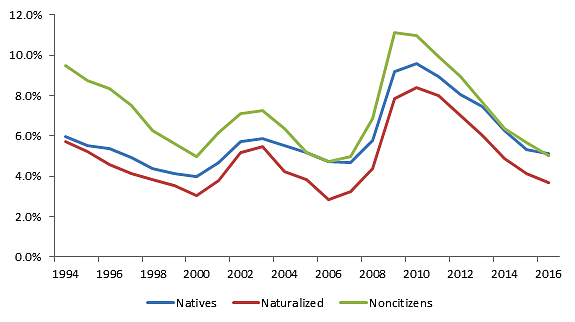
Source: Current Population Survey
Unemployment did not decline as a result of immigrants abandoning the labor force either. In fact, the labor force participation rate (LFPR) among noncitizens rose rapidly after 1996. The native LFPR was nearly 2 percentage points above that for noncitizens in 1996. In 2016, it was 3.7 percentage points higher for noncitizens. Again, naturalized citizens improved, but not as greatly (0.6 percentage points).
Figure 2: Labor Force Participation Rate among Noncitizens, Native-Born and Naturalized Citizens
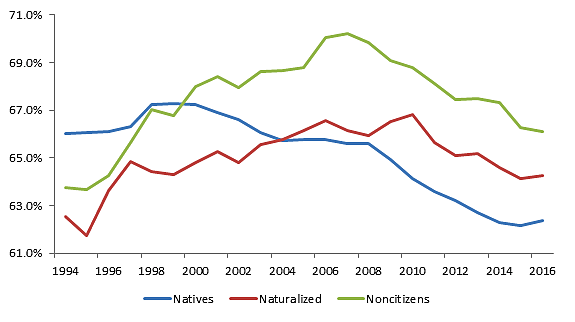
Source: Current Population Survey
But the most important trend is this: not only did poverty decline among noncitizens from 1994 to 2014, they were the only group of the three citizenship classes to see a decline in poverty. Noncitizens experienced an 5.1 percentage point decrease in their rate of poverty (an 18.4 percent drop in their 1996 rate), compared to a 2.1 percentage point increase for naturalized citizens (20.2 percent growth) and a 0.3 percentage point increase for natives (2.6 percent growth). Because this poverty statistic includes all cash public benefits, this means that noncitizens performed best even after welfare payments to citizens.
Figure 3: Poverty Rate among Noncitizen, Native-Born and Naturalized Citizen Households
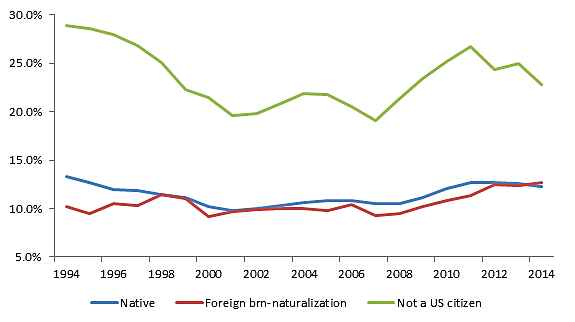
Source: Current Population Survey, March Supplement
If these increases in employment and labor force participation were partially the result of welfare reform, we would expect two conditions to hold. First, the main effect of the law would be felt in the first five years after enactment as the first cohorts of immigrants enter without benefits. After five years, the population of immigrants becoming eligible for benefits each year roughly matched the population entering without benefits, so the rate of welfare receipt among legal immigrants would remain roughly constant.
And this is exactly what we see. Nearly all of the gains in labor force participation, unemployment, and poverty occurred between 1996 and 2000. Of course, the absolute gains during that time were a result of the late 1990s booming economy, but the relative gains for noncitizens compared to naturalized and native-born citizens also occurred during this period and were maintained later, just as the theory predicts.
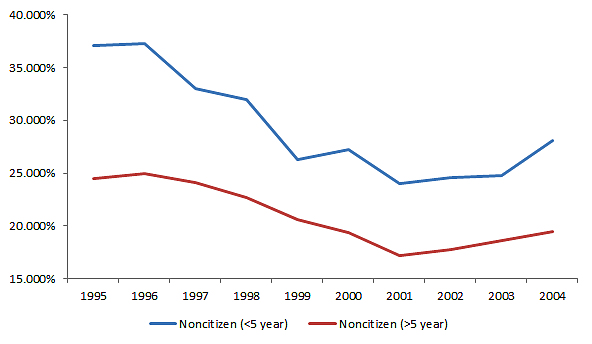
The second prediction is this: the gains should have occurred most strongly among noncitizens who arrived within the prior five year period because, as mentioned before, noncitizens are ineligible for federal benefits only in their first five years in the country. Unfortunately, the Current Population Survey data on year of entry that I found using its Data Ferret tool only extends through 2004, but this slice reveals that noncitizens who were barred from federal benefits once again did better than other noncitizens.
In 1996, the unemployment rate among recent immigrants was 5.5 percentage points more than the unemployment rate among the established immigrants. By 2004, the difference was just a half a percentage point. The vast majority of the gains occurred in the recent immigrant group.
Figure 4: Unemployment Rate among Noncitizens Who Arrived in Prior 5 Years and Other Noncitizens
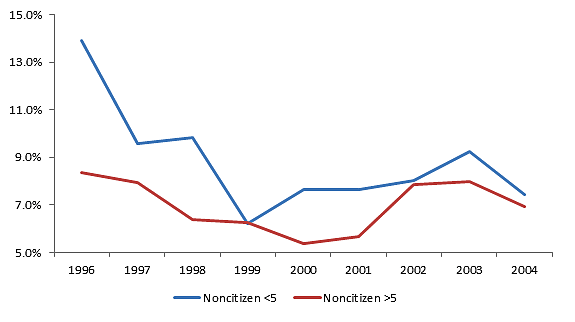
Source: Current Population Survey, March Supplement
The same pattern can be seen in the labor force participation rate data. Noncitizens of both types improved from 1996 to 2004, but immigrants barred from benefits did better. Recent immigrants were 8.4 percentage points less likely to be working or looking for work in 1996 than established immigrants. They were 5.3 percentage points less likely to do so in 2004.
Figure 5: Labor Force Participation Rate among Noncitizens Who Arrived in Prior 5 Years and Other Noncitizens
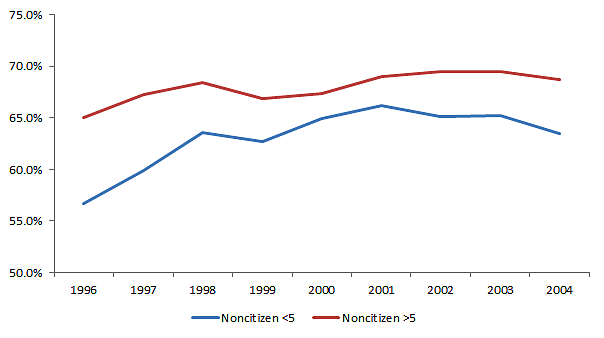
Source: Current Population Survey, March Supplement
Noncitizen outcomes reflect their increased employment. Those without access to public benefits saw the greatest reduction in poverty of any group in the United States. From 1996 to 2004, the poverty rate among noncitizens who arrived in the prior five years declined 9 percentage points compared to 5 percentage points for other noncitizens.
Figure 6: Poverty Rate among Noncitizen Households Whose Head of Household Arrived in Prior 5 Years and Other Noncitizen Households
Source: Current Population Survey, March Supplement
The theory is not complicated by the fact that the trends for noncitizens outside of the five-year bar were also positive (though much less so). Other research has shown that noncitizens who were eligible for benefits also used them less following the 1996 act. Social scientists have debated the reasons for this “chilling” effect—confusion over the law or community norms could have a role—but in either case, they also appear to have benefited from the law.
The unambiguous lesson of this story is that welfare reform did not decimate the immigrant poor. It is impossible to know for sure the full reasons for these trends, but although exceptions undoubtedly exist, it is clear that the vast majority of immigrants can thrive without federal benefits. The United States could financially afford to accept many more immigrants if it further restricted such benefits, allowing it to be even more welcoming to another generation of hardworking immigrants.
