Fifty years ago, one of the biggest-spending presidents in U.S. history was settling into office after coming to power the prior November. Lyndon Johnson signed into law Medicare, Medicaid, and hundreds of subsidy programs for the states and cities.
Johnson was followed in office by one of the worst presidents of the 20th century in terms of domestic policy. Richard Nixon added and expanded many programs, and he helped to cement in place the array of new federal interventions pioneered by Johnson.
The chart below shows federal spending over the five decades since Johnson. Spending is divided into four components and measured as a share of gross domestic product (GDP).
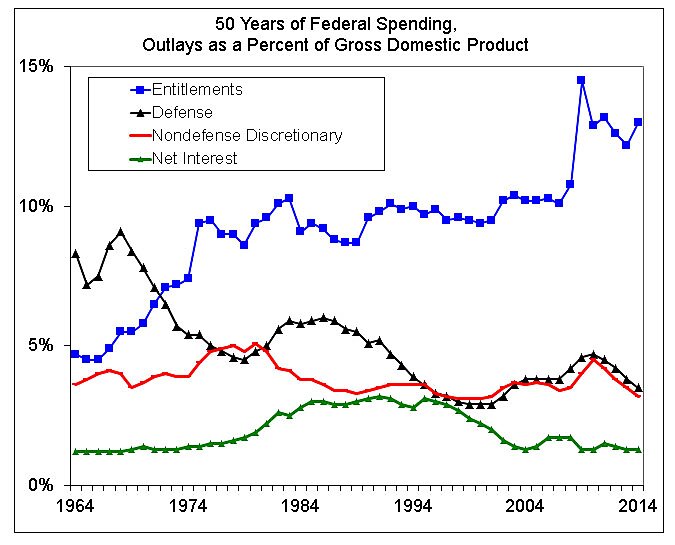
Blue Line: Entitlement spending soared from the mid-1960s to the early-1980s. Medicare and Medicaid grew rapidly after being created in 1965, and Nixon signed into law numerous large increases in Social Security for current recipients. A month before the 1972 election, Social Security recipients received a letter informing them that Nixon had just signed a law bumping up their benefits by 20 percent. The recent spike in spending stems from increases in Medicare, Medicaid, food stamps, and other programs.
Black Line: Defense spending spiked in the late 1960s due to the Vietnam War. The number of U.S. troops in Vietnam peaked in 1968, then fell steadily after that. The Ronald Reagan and George W. Bush defense build-ups are also visible on the chart.
Red Line: Defense spending fell as a share of GDP in the 1970s, while nondefense discretionary spending rose. Then in the 1980s and 1990s, nondefense spending was restrained under Reagan and Bill Clinton, but then rose under George W. Bush in the 2000s.
Green Line: Bush and Barack Obama have been lucky budgeters because federal interest costs have been low during the past decade, despite the large deficits run by these two presidents. The luck won’t last: under its baseline, CBO projects that interest costs will rise from 1.3 percent of GDP today, to 2.7 percent by 2020, and to 4.1 percent by 2030.
Update: All data from the 2015 Federal Budget, Historical Tables, Table 8.4.
