In recent years, construction employers have complained about difficulty in finding skilled workers and asked Congress for reforms to the immigration system to address the issue. The data support their on-the-ground impressions. Since 2000, the labor market in construction has never been tighter than it was in 2017. Immigration reform would help employers find skilled workers and increase production in the construction industry.
Some commentators compare construction employment to other industries in order to evaluate its need for workers, but this is inappropriate. Construction projects are by their nature temporary and often seasonal, and so the natural rate of unemployment at any given time will always be higher for construction than other industries. For this reason, it is important to compare the construction labor market today to its labor market in prior years. This tells us how difficult it is for employers to fill jobs—how “tight” the labor market is—given the industry’s peculiarities.
The best measure of labor market tightness is unemployment relative to job openings. Following the housing bust, the number of unemployed construction workers shot up to nearly 1.8 million in 2009, while the number of job openings fell to less than 52,000. The total number of unemployed was almost 35 times higher than the number of job openings. As Figure 1 shows, the number of unemployed was only 3 times higher than the job openings rate in 2017. In other words, the labor market was 90 percent tighter in 2017 than in 2009. No year on record had an average ratio of unemployment to job openings as low as 2016 and 2017 did.
Figure 1: Unemployed Workers Per Job Opening in Construction, 2000* to 2017.
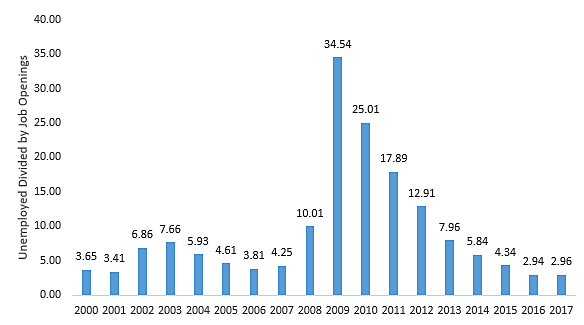
Sources: Bureau of Labor Statistics JOLTS Survey; Bureau of Labor Statistics, *Only December
Another way to view this information is to plot the unemployment rate and job openings rate (i.e. the share of new jobs out of total jobs) for each month on a scatter plot. Figure 2 incorporates each month since 2001. In the figure, the further up and to the left a point is the tighter the labor market was in that month. The points with the 35 tightest labor markets are colored separately. The yellow months are 2017; the red 2016; and green and dark green 2006 and 2007, just before the housing bubble collapsed. More than half of the 35 tightest months for the construction labor market were in 2016 and 2017. Only four months out of the 35 were in years other than 2016–17 or 2006–7—each was in 2005 or 2015.
Figure 2: Unemployment and Job Openings Rates for Each Month, 2000–2017, 35 tightest Labor Markets Highlighted
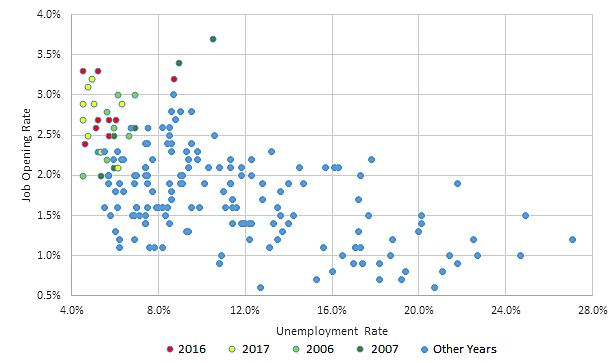
Sources: Bureau of Labor Statistics JOLTS Survey; Bureau of Labor Statistics
While the Bureau of Labor Statistics has only collected job openings data since December 2000, the Current Population Survey has collected monthly industry-specific unemployment data since 1994. But even focusing solely on the unemployment rate, only one year (2000) had a lower unemployment rate than 2017’s rate.
The construction industry is booming, and restrictions on the ability of these firms to hire foreign workers ultimately limit production and raise prices.
