
The Inflation Reduction Act (IRA) became law on August 16, 2022. Despite its name, the act was mostly designed to decarbonize the US economy by providing subsidies to producers of clean energy and consumers of low-carbon-emitting preferred products such as electric vehicles.
A contentious point of debate surrounding the passage of the IRA was its budgetary impact—how much liability American taxpayers would have to take on to subsidize clean energy. Various governmental and nongovernmental organizations estimated fiscal costs that turned out to be too low and that they later revised upward.
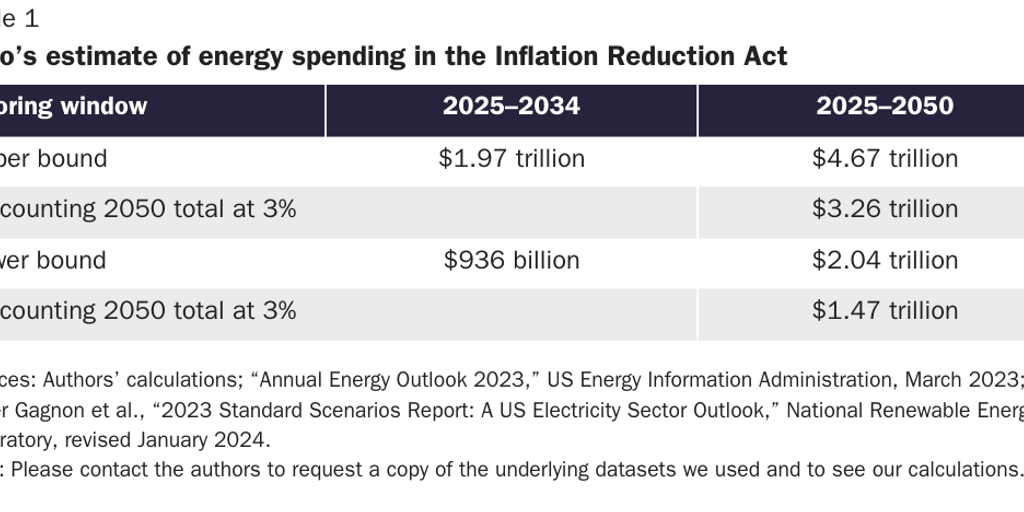
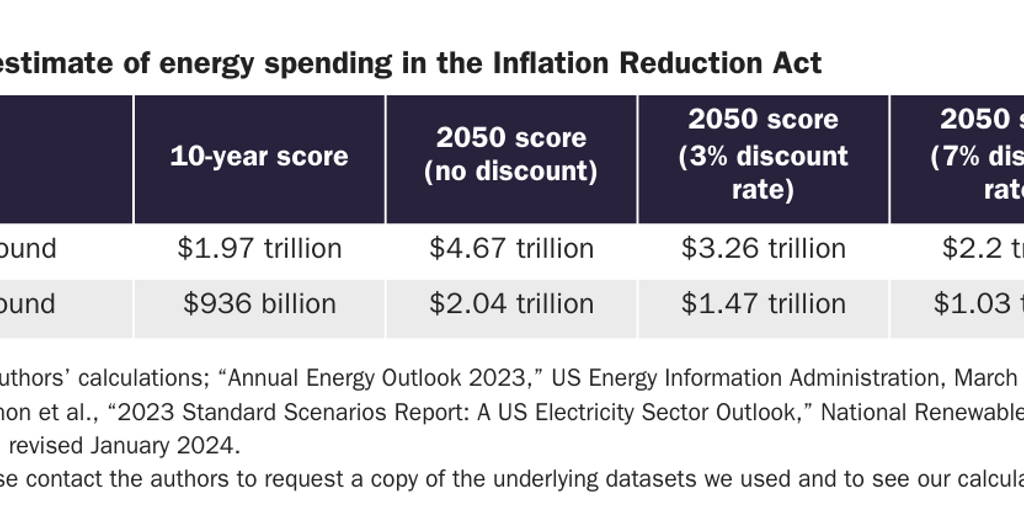
Using a transparent budget scoring methodology, we estimate that the energy subsidies in the act will cost between $936 billion and $1.97 trillion over the next 10 years, and between $2.04 trillion and $4.67 trillion by 2050. This estimate is substantial because several of the IRA’s largest subsidies are uncapped.
Related Video
When Congress passed the IRA, the Congressional Budget Office (CBO) and the Joint Committee on Taxation (JCT) estimated the energy-related IRA subsidies would cost about $370 billion. An analysis by Goldman Sachs later estimated the IRA’s 10-year cost would be $1.2 trillion.
However, the IRA’s energy subsidies are multiple times larger than initial estimates, and they expose American taxpayers to potentially unlimited liability. Congress should repeal all the energy subsidies in the IRA. At a minimum, Congress should cap total spending on energy subsidies and require budget experts at the CBO, JCT, and other government organizations to publish transparent and updated estimates of the IRA’s long-term costs.
Introduction
The Inflation Reduction Act (IRA) became law on August 16, 2022. Despite its name, the act was mostly designed to expedite the decarbonization of the US economy by providing subsidies to producers of low-emission energy and some consumers of low-carbon-emitting products such as electric vehicles. A contentious point of debate surrounding the passage of the IRA was the various estimates of its budgetary impact—how much liability American taxpayers would have to take on to subsidize clean energy. Various governmental and nongovernmental organizations estimated fiscal costs that turned out to be too low and that they later revised upward.
In this paper we aim to explain the energy spending in the IRA and demonstrate that it is highly variable, uncapped, and has been underestimated; provide a transparent and replicable method for scoring the IRA in the upcoming 10-year budget window; estimate a range of total spending (total taxpayer liability) through 2050; highlight the major spending drivers; and advocate for full legislative repeal of the IRA while noting significant reforms that could be made to the IRS guidance and regulations dealing with IRA implementation.
Table 1 summarizes the upper- and lower-bound estimates of energy spending in the IRA, both for the coming 10-year budget window and for a longer budget window stretching to 2050. It also shows the effect of applying a 3 percent discount rate to the spending in the 2050 budget window, which is to reduce the net present value of the stream of IRA spending by approximately 30 percent.
History of the Inflation Reduction Act
The most salient goal of the IRA was not to reduce inflation—it was to accelerate the decarbonization of the US economy. In July 2024, President Joe Biden wrote that his administration had passed “the most important climate legislation in the history of the world.”1 Biden is correct if we judge the significance of legislation by the amount of government spending it enables—there is not a single piece of legislation or other government action that commits more public spending to address climate change than the IRA.2
Biden signed the IRA into law on August 16, 2022, following party-line votes in the House and the Senate, to pass the bill through the budget reconciliation process.3 Advancing as a budget reconciliation measure meant the IRA could pass on a simple majority in the Senate instead of requiring a filibuster-proof majority of 60 Senate votes.4 By the same token, the IRA can be repealed as part of a budget reconciliation package.
Related Media
The final version of the IRA was the culmination of a long process of shaping the climate portion of Biden’s Build Back Better agenda.5 An earlier iteration of climate-related spending was approved by the House Energy and Commerce Committee in 2021 as the Clean Electricity Performance Program—scored at approximately $150 billion of the $3.5 trillion Build Back Better package—but this early proposal failed to gain political traction.6 The IRA ultimately moved forward with the energy subsidies analyzed in this paper and some provisions unrelated to climate, such as price caps on medication.7
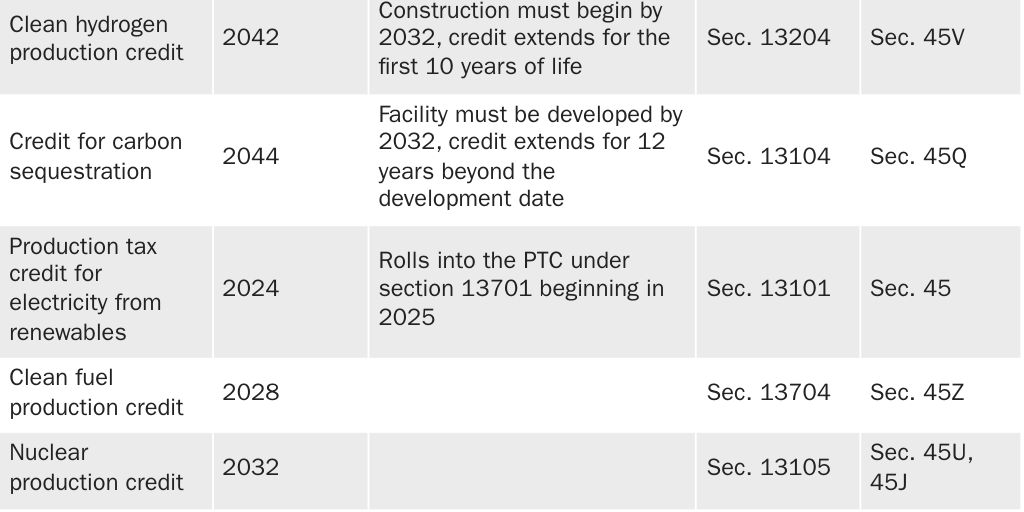
Table 2 summarizes the various energy-related subsidies in the IRA and shows the expiration dates for each, as well as the locations of each provision in the IRA statute and the IRS code.
Total IRA Spending Is Difficult to Estimate
Other estimates of IRA spending range from about $350 billion to more than $1 trillion. When Congress passed the IRA, the Congressional Budget Office (CBO) and the Joint Committee on Taxation (JCT) estimated that its energy-related subsidy provisions would cost between $369 billion and $383 billion over the 10-year budget window. In contrast, several third-party estimates suggested that costs could exceed three times those projected by the CBO and the JCT.8 The wide range in estimates is a result of the open-ended nature of many of the IRA’s energy subsidies, which are highly sensitive to factors such as industry growth, market adoption, and technological advancements.
Related Media
Each provision in Table 2 represents a different category of spending that contributes to the ultimate cost of the IRA, and the forecast range of annual spending in each category is wide. Furthermore, the length of the budget window has a significant effect on the analysis. Many of the IRA’s subsidy provisions expire in 2032, such as the tax credits for electric vehicles (EVs) and existing nuclear power plants. However, some of the IRA’s largest subsidies phase down only when the level of greenhouse gas (GHG) emissions from the electricity sector falls to 25 percent of the 2022 baseline.9
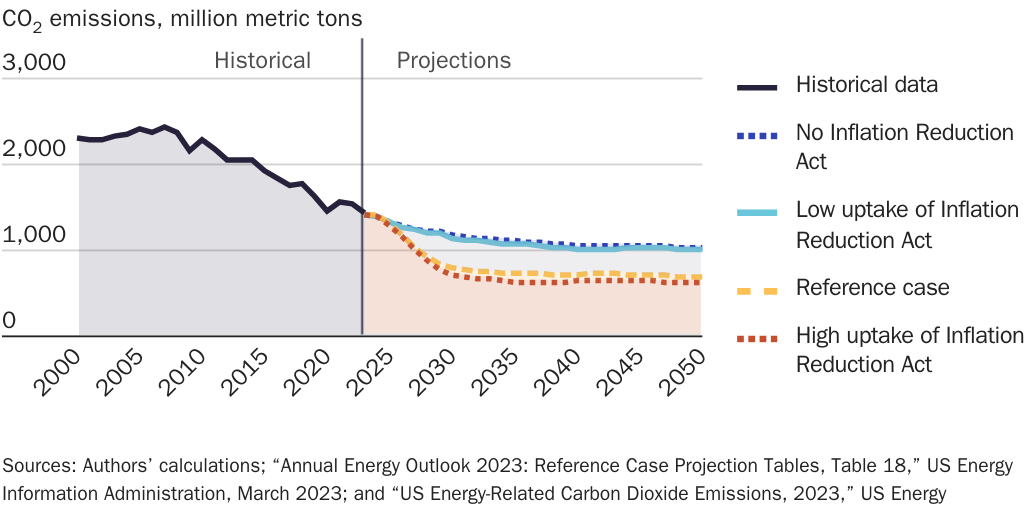
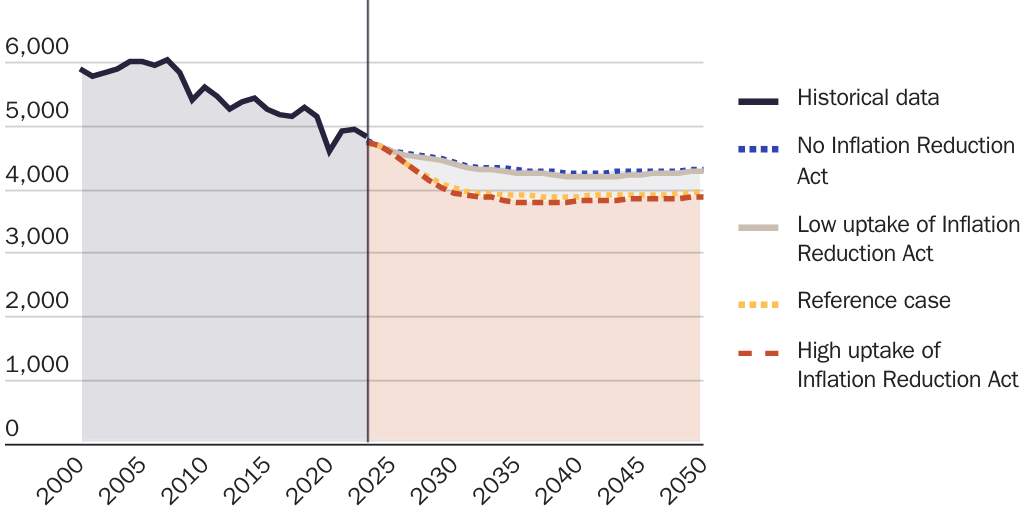
The electricity sector is highly unlikely to reduce the GHG emissions by 75 percent from 2022 levels in the next 10 years, especially if electricity demand continues to grow.10 Further, the IRA promotes electrification—as with EVs—which will contribute to increased electricity demand, thus making the GHG target more difficult to reach. Figure 1 illustrates GHG projections from the Energy Information Administration (EIA), which show that electricity sector emissions will remain far above the IRA’s target of 25 percent of the 2022 level through 2050, even in the scenario that assumes a “high uptake” of IRA subsidies.11
Major Spending Drivers
Some of the costliest provisions of the IRA are the production tax credit (PTC) and the investment tax credit (ITC) for clean electricity production under IRS code sections 45Y and 48E, respectively, and the advanced manufacturing tax credit under IRS code section 45X. In the case of the 45Y production tax credit, the owner of a power plant that qualifies for clean electricity credits will receive an inflation-adjusted payment per unit of clean electricity produced. In 2023, the going rate for the PTC was $27.50 per megawatt-hour. The section 48E investment tax credit reimburses a percentage—typically 30 percent—of the up-front investment cost of a power plant that produces clean electricity or an electricity storage facility, such as a battery or pumped storage hydroelectric facility. Starting in 2025, a clean electricity production facility will have the option of choosing either the section 45Y production tax credit or the section 48E investment tax credit, but not both. The section 45Y and 48E credits in the IRA will likely cost taxpayers between $70 billion and $180 billion per year in the years just before the GHG target is met.12
The section 45X tax credit for advanced manufacturing includes an uncapped production tax credit for critical minerals. Under section 45X(c)(6) of the IRS code (section 13502 of the IRA), the federal government will indefinitely subsidize 50 different “critical minerals.” This includes high-volume production minerals such as aluminum, lithium, nickel, and cobalt. These subsidies, particularly in the context of rising demand for lithium-ion batteries used for EVs and energy storage, risk creating a compounding effect, where multiple subsidies stack across the supply chain. For example, in a “solar plus storage” context, taxpayers not only subsidize the solar energy production through the PTC, but also the battery through the ITC and the minerals that go into that battery via section 45X(c)(6). Recent guidance on section 48E added another layer of taxpayer liability, as some transmission upgrades for new sources will also be subsidized by the ITC.
Given recent trends—including growing demand for electricity and the looming Trump administration reversal of power plant regulations issued by the Environmental Protection Agency (EPA)—the decarbonization of the grid is likely to slow, or perhaps stall, in terms of total emissions.13 As one significant data point, the most recent capacity auction for electricity generation resources in the PJM Interconnection, which is the wholesale electricity market covering 13 states in the mid-Atlantic region and the District of Columbia, retained every GHG-emitting power plant that offered capacity.14 In other regions with faster-growing deployment of renewable resources, such as Texas, decarbonization of the electricity sector has been modest, in part because reductions in the GHG intensity of electricity generation are being offset by increased electricity use overall.15
If the growth in nationwide electricity consumption continues, many of the existing GHG-emitting power plants will be needed for reliability—and this is true independent of their profitability. If supply shortfalls are imminent, grid operators will not allow fossil-fueled power plants (mostly coal and natural gas) to close in the near term.16 Finally, a reversal of the EPA’s power plant GHG rule would allow for a variety of natural gas–fired power plants to be built to meet rising electricity demand, further increasing GHG emissions and lengthening the term of subsidies as currently designed in the IRA.17
Initial Estimates of the IRA’s 10-Year Budget Cost
The one-page summary of the budget impacts of the IRA circulated by Senate Democrats in July 2022 said the Energy Security and Climate Change section of the IRA would cost $369 billion, but it did not itemize the wide-ranging set of provisions.18 In August 2022, the CBO and the JCT released an itemized estimate that revised the 10-year cost of the IRA’s energy-related provisions to approximately $383 billion, due to minor adjustments.19 These estimates are challenging to deconstruct and replicate because the agencies do not publish replication codes or detailed methodologies. However, third-party estimates from the same period align with the initial CBO and JCT estimates. Researchers using the Penn Wharton Budget Model found that the climate and energy provisions of the IRA would cost $384 billion in August 2022.20 Also, that same month, the nonpartisan Tax Foundation estimated there to be $352 billion in expanded tax credits in the IRA.21
Updated Estimates of the IRA’s 10-Year Budget Cost
Although the various initial estimates of IRA spending all clustered around the original score of roughly $370 billion, the CBO and others have since updated their estimates multiple times. As summarized in a February 2024 article by the Tax Foundation, the CBO and the JCT found that “the IRA credits appear to cost approximately $786 billion over the new budget window (2024–2033).”22 The updated amount is more than double the original CBO and JCT estimate.
Estimates by private firms, think tanks, and researchers are even higher. The updated Penn Wharton Budget Model estimated the IRA’s climate and energy provisions will cost just over $1 trillion by 2032.23 The Brookings Institution found that the 10-year cost could be roughly $800 billion— again, more than twice the CBO’s original estimate.24 A widely circulated report by Goldman Sachs estimated the 10-year cost would be $1.2 trillion, more than triple the CBO’s original estimate and 50 percent larger than the CBO’s revision.25 Figure 2 summarizes the findings of these groups as well as Cato’s upper- and lower-bound estimates for the upcoming 10-year budget window.
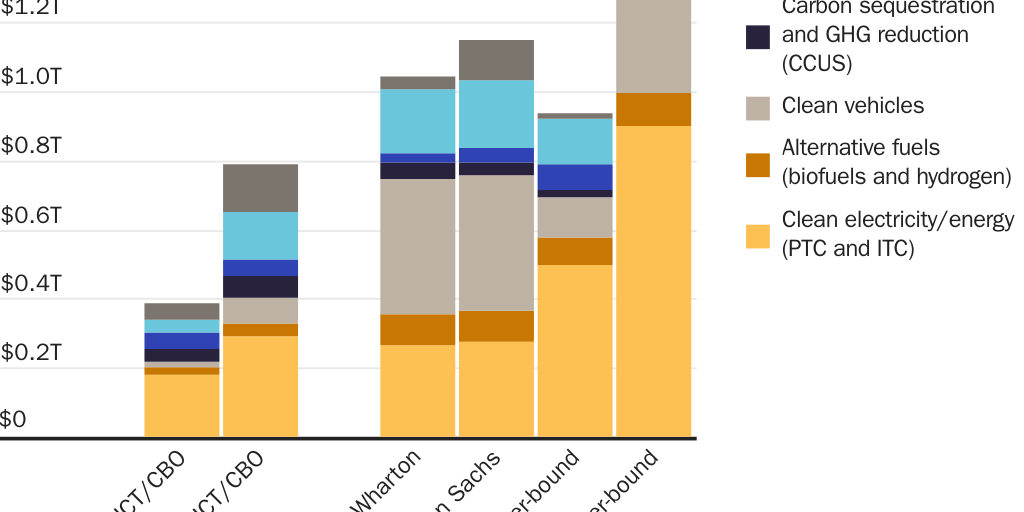
There have been several regulatory changes since the IRA became law that might contribute to the discrepancies in estimates over time. On March 20, 2024, the EPA finalized tighter tailpipe emissions standards that were projected to increase EV sales by raising the relative price of cars with internal combustion engines, which would boost consumer use of the IRA’s clean vehicle credit. Those regulations could have contributed to the increase in the cost of the clean vehicle provision from the CBO/JCT’s estimate of $14 billion in 2022 to $73 billion in February 2024.26 The future of the EPA regulations is uncertain, and so is the future of market demand for EVs without the regulations or credits. Figure 2 shows much lower spending on the EV tax credit in the Cato estimates than the Penn Wharton and Goldman Sachs estimates, partly because we expect slower growth in the US EV market due to factors such as consumer demand and other market constraints.
The JCT estimated that changes to regulations—including updated guidance by the IRS—are likely to double initial cost projections for some credits. Goldman Sachs determined that most of the disparities between initial and later cost projections are “driven by higher estimates for all categories, especially our significantly higher estimates for advanced manufacturing tax credits (45X) and EV tax credits.”27 Overall, the 10-year spending estimates have shifted from the initial range of less than $400 billion to a new range of $1 trillion or more.
Early Data from Tax Returns
Although IRA spending projections are inherently uncertain, new information from the IRS shows that the actual subsidies included in tax filings have surpassed initial projections. For example, the Treasury Department recently highlighted the rapid uptake of the residential clean energy credit and the energy-efficient home-improvement credit. These two credits cost $8.4 billion in 2023, but initial estimates were a fraction of that.28
The residential clean energy credit was estimated to cost $459 million in 2023, with a total cost of $22 billion by 2031.29 The IRS data show an actual cost to taxpayers of $6.3 billion in 2023, roughly $4 billion of which is attributable to the IRA (as the original credit would have still been in effect until the end of 2023).30 At this pace, the total cost would exceed $200 billion by 2032.
Actual costs for the energy-efficient home-improvement credit in 2023 were $2.1 billion.31 This is nearly eight times the original estimate of $273 million for 2023 and exceeds the initially estimated 10-year total of $2 billion.32 The sharp growth of these two credits shows how initial, and even revised, estimates have been off by billions of dollars, not only collectively but for many of the individual provisions within the IRA.
Estimates of the IRA’s Cost Beyond the 10-Year Budget Window
Few modelers have attempted to estimate what the IRA might cost beyond a 10-year window. One such estimate comes from Wood Mackenzie, an energy transition analytics company. Two Wood Mackenzie analysts estimated that the clean electricity portions of the IRA—the PTC and the ITC for clean electricity generation and storage—will cost nearly $3 trillion by 2060.33 Wood Mackenzie has since identified issues, namely interconnection delays and slow expansion of transmission capacity, that could push the phasedown year for the PTC and the ITC even later because they would delay hitting the 75 percent reduction goal.34
How We Approach Our Cost Estimates
We create a simple model to estimate a range of spending on the energy subsidies in the IRA. Using projections published by the EIA and the National Renewable Energy Laboratory (NREL), we take levels of deployment for each subsidized technology and estimate the cumulative amounts of the various tax credits in the IRA. This methodology is then applied to all subsidized technologies and investments (electricity generation resources, energy storage, EVs, etc.).
Related Event
Because there are many moving parts in the IRA framework, we make educated guesses about the type of subsidy a given project developer is likely to select, as well as the magnitude of the subsidy. For example, developers of offshore wind facilities may select the ITC rather than the PTC, so we estimate the offshore wind subsidies in the IRA by multiplying the amount of offshore wind investment by the subsidy level. The range established in the statute goes from 6 percent to at least 50 percent of the cost of the project. We assume a 30 percent ITC. Our estimated offshore wind subsidy for each year, then, based on EIA and NREL projections, is 30 percent of the estimated investment in offshore wind facilities.
We repeat this estimate for each year out to 2050, using projected deployment levels from both the EIA’s Annual Energy Outlook and NREL’s modeling of state goals for offshore wind. In this case, NREL’s projection is significantly higher than the EIA’s, so the subsidy estimate that relies on the NREL projection is much higher than the EIA-based estimate. In most cases, the EIA’s estimate for subsidy-eligible technologies is lower than NREL’s estimate, and the difference in deployment levels between the EIA and NREL provides the lower and upper bound, respectively, for the annual subsidy estimates.
What this paper does not do. We do not offer a mid-point estimate for the total cost of the IRA, either over the 10-year budget window or out to 2050, because there are too many uncertainties involved; our estimates would be based on arbitrary assumptions, and we want to avoid the false appearance of precision. Further, although IRA spending will likely continue beyond 2050, we do not make any spending projections beyond 2050 because the number of variables—including changes to energy technology or broader economic conditions—would push our analysis further toward the realm of pure guesswork. Finally, we do not use capacity expansion models; contributions from these models would be unlikely to contradict our findings.35 Our goal is to present an IRA spending estimate that is generally accessible, transparent, and replicable using basic spreadsheet software.36
Full versus partial credits. Estimates of the IRA’s fiscal impact hinge, in part, on whether the full credits are attainable, which depends on variables such as supply-chain decisions made by private companies. For example, some of the ITCs range from 6 percent of the total investment to 50 percent or more, depending on factors such as labor requirements and domestic sourcing of materials. As noted before, to simplify our estimates, we model all ITCs at 30 percent, which is consistent with long-standing levels of the solar ITC.37 As another example, the tax credit for purchasing an EV depends on production decisions made by automakers and the income level of the household purchasing the EV.38 In our lower- and upper-bound estimates, we model partial and full EV credits, respectively.
Election of the ITC or the PTC. Developers of new or expanded low-GHG electricity generation resources can choose between an up-front ITC of typically 30 percent or a 10-year stream of PTC payments (the 2023 value of the PTC was $27.50 per megawatt-hour of electricity generation).39 To model the choice between the ITC and the PTC in our estimates, we assumed that developers of offshore wind and new nuclear resources will elect the ITC, and other energy-generation resources will choose the PTC. Although that assumption may not always be true in all regions or for all years, we believe it will yield accurate results. In addition, the ITC/PTC distinction may not significantly alter the total cost of the IRA by 2050. However, it does change the timing of subsidy payments because spending will occur earlier if more developers choose the ITC and later if more developers choose the PTC and, hence, could impact the discounted values of IRA spending. Notably, for some technologies such as energy storage, which includes everything from batteries to pumped hydroelectric generation resources, the ITC is the only category of IRA subsidy available.
IRS guidance. Many of the cost estimates depend on ongoing changes and clarifications to the implementation guidelines issued by the IRS. For example, owners of some existing low-GHG electricity generators can take advantage of the IRS’s so-called 80/20 rule by “repowering,” meaning retrofitting facilities that are already in service.40 In the context of energy tax credits, this rule states that the IRS will treat a retrofitted electricity generation or storage unit as if it were new, and thus it would be eligible for tax credits for new resources if the value of the new components is at least 80 percent of the total market value of the refurbished facility.
We assume that a gradually increasing portion of existing hydroelectric facilities, starting at zero in 2024 and increasing to 25 percent of all hydroelectric generation units by 2050 in our upper-bound estimates, will take advantage of the 80/20 rule.41 We also assume in our upper-bound estimates that all owners of wind and solar resources will repower and requalify for the PTC when they are eligible to do so.42 In contrast, our lower-bound estimates assume that no repowering of wind and solar resources takes place.
Data sources and sensitivity analysis. We rely on data from forecasts published by government sources, namely the EIA and NREL. Our assumptions and analysis are informed, in part, by previous work by private and academic researchers, such as Wood Mackenzie, Goldman Sachs, and Princeton University’s REPEAT Project.43 We note that the forecasts we rely on are inherently uncertain and produce large differences in spending estimates.
A major difference between our lower-bound estimate of IRA spending by 2050 and our upper-bound estimate is driven by the difference between the EIA’s relatively lower projection of solar generation and NREL’s relatively higher projection. Similarly, deployment levels of new or repowered nuclear energy represent about a $600 billion difference between lower- and upper-bound estimates, or zero new deployment versus 200 gigawatts (GW) by 2050, respectively.
The 200 GW upper bound for new nuclear deployment comes from the Biden administration’s stated goals and the authors’ judgments about possible deployment levels for new nuclear under a high-load growth scenario. For our upper-bound estimates of tax credits for offshore wind and EVs, we also go beyond government projections and substitute relevant policy goals, such as states’ offshore wind mandates and the previous administration’s goal of EVs being 50 percent of new vehicles sold by 2032.
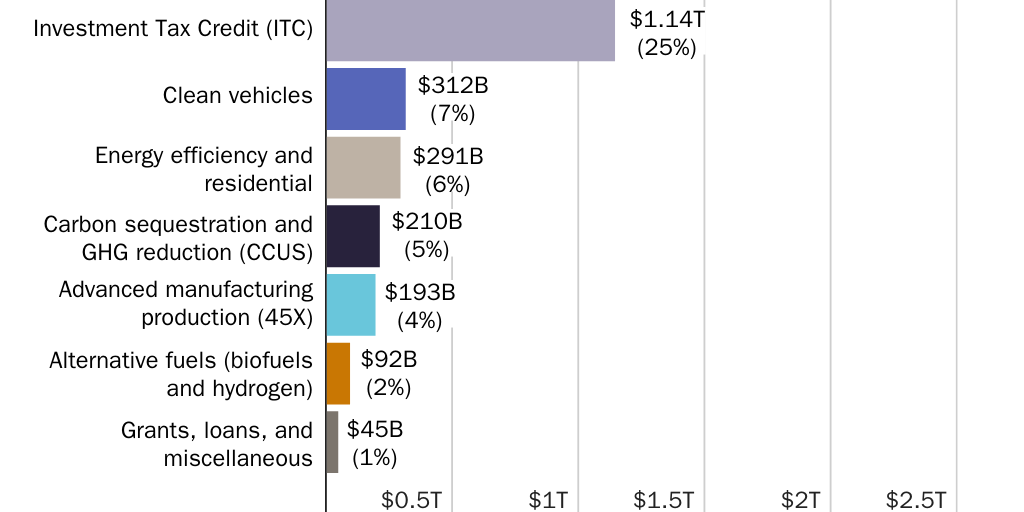
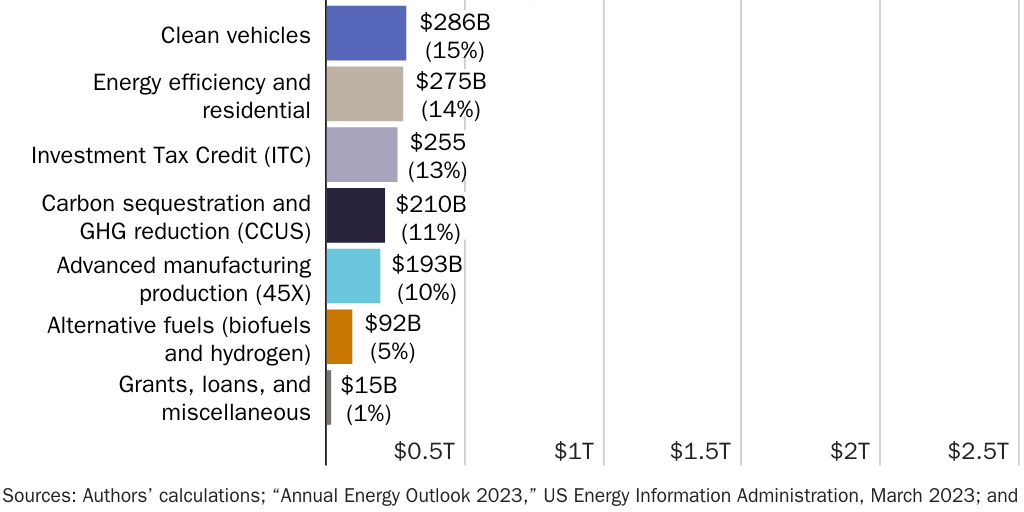
Figures 3 and 4 show the share of total IRA spending by subsidy category in our lower-bound and upper-bound scenarios, respectively. Note the large difference in ITC payments, which reflects the much higher deployment levels of new nuclear and offshore wind resources in our upper-bound estimate.
In each estimate, our goal is to establish a sound framework for analyzing IRA spending—within the 10-year budget window as well as through 2050—and to advance a transparent and accurate framework for others to build on.44
Expiration dates for IRA subsidies. A difficult element to predict is the end date for the energy subsidy provisions that expire only when the electricity sector meets certain GHG targets. To repeat, the PTCs and the ITCs phase down only when the level of GHG emissions from the electricity sector falls to 25 percent of the 2022 level. The required reduction will likely not occur by 2050 because there will be significant growth in electricity demand, making a target based on a GHG level (rather than a GHG intensity) more difficult to reach. This is consistent with NREL modeling.45
Although the phasedown year is not easy to forecast, a shorter subsidy window is unlikely to materially change the cost of the IRA between now and 2050 because hitting the GHG target implies aggressive deployment of subsidized resources.46 In other words, IRA subsidies will be significant even if the GHG targets are achieved well before 2050.
Methodology Specific to the 10-Year Budget Window Estimates
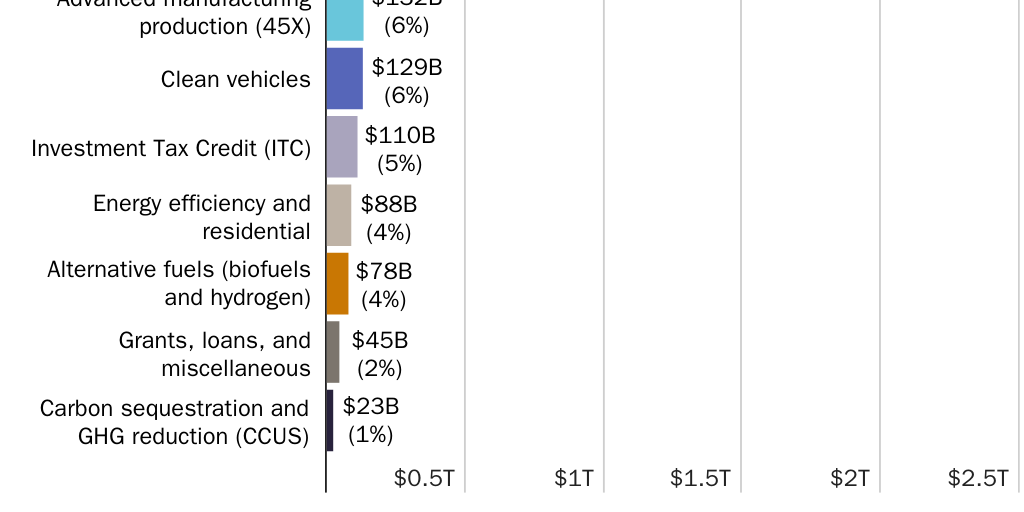
Among the provisions that expire in 2032, we provide our own estimate for some of the tax credits, including the EV credit and the residential clean energy credit. For other provisions, we rely on the CBO, JCT, and other estimates for the contribution of those provisions to total spending. For example, we rely exclusively on external estimates for the total 10-year cost of subsidies for hydrogen production, biofuels, carbon capture, and the manufacturing tax credit. Figure 5 illustrates our upper-bound 10-year estimate broken down by subsidy type.
Methodology Specific to Estimating Beyond the 10-Year Budget Window
Our estimates of the long-term cost of the PTC and the ITC follow the methodology of projecting the amount of subsidized activity, such as eligible clean energy production for the PTC and the eligible clean energy investment for the ITC, and then applying an estimated subsidy. We assume developers of all new onshore wind, solar, geothermal, and hydroelectricity production will claim the standard value of the PTC, which was $27.50 per megawatt-hour in 2023. If new projects elect the ITC rather than the PTC, that will shift projected spending to earlier years because ITC subsidies are paid up front, whereas PTC payments are spread over 10 years but may not substantially change total costs.
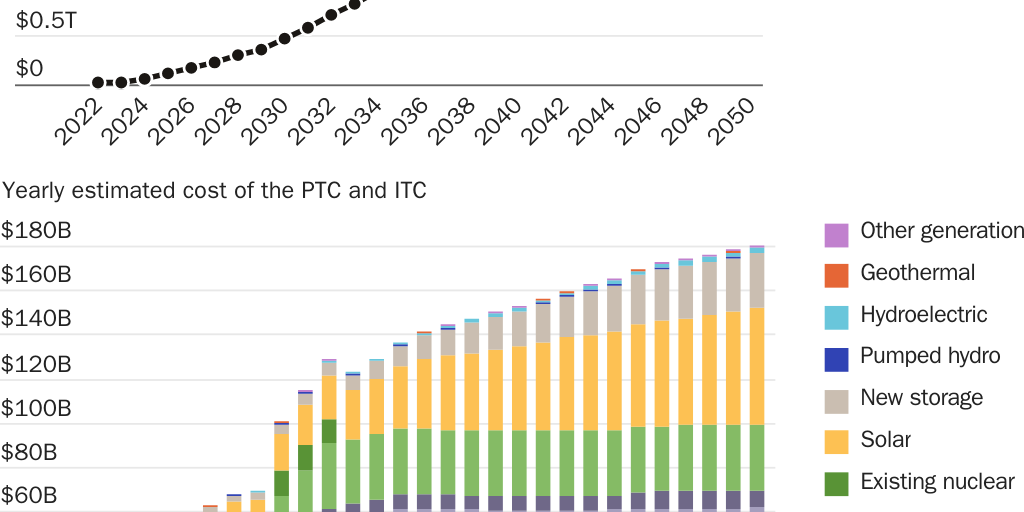
Figure 6 breaks down IRA spending by year and shows the contribution of each type of subsidy. Note that the total spending rises relatively steadily for every year from 2033 through the end of the projection. By 2050, the annual cost of the IRA’s energy subsidies reaches $180 billion, which is nearly half the original CBO/JCT score of $369 billion.
We assume developers of all new offshore wind and new nuclear facilities will choose to receive the ITC. Projected levels of investment in offshore wind in each year through 2050 vary significantly—the EIA’s Annual Energy Outlook shows little investment (23 GW), whereas NREL modeling of state policies mandating offshore shows high investment (112 GW).47 To convert installed gigawatts to investment spending, we use the EIA’s base overnight construction cost of offshore wind (with no adder applied) of $5,338 per kilowatt.48 To derive tax credit spending amounts, we apply a 30 percent ITC to the level of new investment in each year.
New energy storage projects are eligible for only the ITC. The arithmetic for quantifying tax credits under a 30 percent ITC for energy storage is calculated the same way as for offshore wind, with the credit applied to a percentage of the capital investment in eligible projects. Hence the level of the tax credit is based on the project’s up-front cost. However, each input for our energy storage projections—total installed capacity and cost per unit—features variability that is difficult to capture in a simple model. We found the EIA’s projection of new storage deployment to be implausibly low, even for a lower bound, so we rely instead on the REPEAT Project for a lower-bound estimate of energy storage investment and on NREL for the upper bound. Our estimates account only for the capital costs of battery storage and not total system costs, as formulated by NREL.49 Opting to use total system costs would increase the ITC costs by approximately $80 billion by 2050, depending on the cost scenario used.50
To the best of our knowledge, no one has attempted to estimate the long-term cost of the advanced manufacturing (45X) credit for critical mineral production. The critical mineral provision within section 45X has no expiration date and applies to approximately 50 critical minerals, including some minerals whose domestic production could rise sharply, such as lithium.51 Similarly, the Electric Power Research Institute estimates that the production tax credits for clean hydrogen (45V) could cost between $385 billion and $756 billion by 2050.52 These high-end figures are not reflected in our own estimates, but we note them here to illustrate the open-ended nature of IRA spending.
Related Media
Findings
Within the upcoming 10-year budget window (2025–2034), we estimate the IRA spending will range between $936 billion under a set of lower-bound assumptions and $1.97 trillion under a set of upper-bound assumptions. By 2050, total IRA spending could range between $2.04 trillion and $4.67 trillion. Table 3 shows Cato’s estimated total spending on IRA energy subsidies through the upcoming 10-year budget scoring window, as well as through 2050, including present values of IRA spending through 2050 using discount rates of 0, 3 percent, and 7 percent.
The original CBO/JCT 10-year score significantly underestimated the subsidy payments authorized by the IRA, but third-party estimates of the IRA’s 10-year budget score—such as the Goldman Sachs estimate of $1.2 trillion—fall comfortably between our lower- and upper-bound estimates for the upcoming 10-year budget window.
Our estimates also reflect total spending through 2050, calculated using present values of projected 2050 spending levels with discount rates of 0, 3 percent, and 7 percent. For example, applying a 3 percent discount rate to upper-bound spending yields a present value of $3.26 trillion, which is approximately 30 percent lower than the undiscounted total of $4.67 trillion. Although we recognize that spending beyond the 10-year budget window is unlikely to be scored as part of budget reconciliation legislation, it is an important consideration as policymakers weigh reform or repeal.53
We also note the possibility of applying a longer-term scoring window to match tax cuts with spending cuts beyond the typical 10-year budget window. Because IRA spending on the PTC and the ITC is likely to continue to increase throughout the 2040s, extending the budget window for a reconciliation package beyond the typical 10 years will increase the amount of offsets made available by IRA repeal.
Policy Recommendations
The federal government passed the largest climate bill in history, vastly underestimated the costs, and subjected taxpayers to unlimited liability. We recommend full repeal of the IRA’s energy subsidies. If full repeal is not possible, Congress should limit taxpayer liability by capping the dollar value of subsidies, putting an expiration date on the subsidies regardless of emissions levels, or both. For example, Congress could limit the level of IRA subsidies to the August 2022 CBO and JCT score of $383 billion.
Related Media
Disparities in cost estimates highlight the need for policymakers to require budget experts at the CBO, JCT, and other government research organizations to publish transparent estimates of the IRA’s long-term costs.54 Given the size and volatility of IRA cost estimates—initial estimates of roughly $370 billion over 10 years have grown to $4.67 trillion by 2050—the forward-looking budget reconciliation score for IRA repeal should be fully transparent and replicable by outside researchers.
Finally, in addition to legislative reform or repeal of IRA spending, the Trump administration should limit the availability of IRA subsidies by unwinding the series of IRS guidance documents that have vastly expanded the cost of the IRA. In addition to the repowering issue outlined above, in December 2024, the IRS extended the section 48E ITC to include components of the transmission system—an action contemplated by Congress that was expressly removed from the climate portion of the Build Back Better agenda.55 Such IRS guidance is inappropriate; it could fail judicial review and is remediable by the executive branch.
Conclusion
The IRA was passed to decarbonize the US economy, and the CBO and the JCT estimated it would cost less than $400 billion over 10 years. Using the methods described above, we estimate far larger costs of up to $1.97 trillion over 10 years and $4.7 trillion by 2050. The American people and our elected representatives cannot make informed decisions about the IRA without an accurate assessment of its cost, and we should not have had to wait two years to understand the IRA’s impact on the budget.
Further, Congress should stop issuing blank-check subsidies with no expiration date. The massive cash transfer from taxpayers to private firms under the guise of environmentalism creates an overwhelming and undue burden on taxpayers who continue to pay for fiscally irresponsible federal spending. By nearly any metric, the IRA is a flawed policy that should be repealed.
Appendix
There are significant problems with applying a strict cost-benefit analysis to the IRA. We note that many economists view cost-benefit studies as central to analyzing climate policy, however, and we offer a cost-benefit framework to those economists. In the case of the IRA, both the benefits and the costs are highly uncertain. The uncertainties on the cost side are the subject of this paper. The range of potential benefits is also wide because there is a large range of plausible estimates of the social cost of carbon dioxide (SCC), which is the most readily available estimate of the social benefit of carbon dioxide (CO2) reduction. The SCC that was estimated by the EPA during President Barack Obama’s administration was about $50 per ton, and the EPA’s most recently proposed SCC is $190 per ton of CO2, both of which were estimated using a global scope. In addition to debates about the correct scope to use when estimating the SCC (global versus domestic), there are also valid debates about the appropriate discount rates.56
As shown in Figure A1, the EIA’s reference case projects that all-sector CO2 emissions in the United States will decrease by 0.7 percent annually through 2050. In comparison, in the absence of the IRA, emissions would decline by 0.4 percent annually. In terms of tons of CO2 rather than percentages, the EIA projects that the IRA will reduce CO2 emissions by 9.122 billion metric tons by 2050 relative to the no-IRA case. Applying our lower-bound and upper-bound estimates of the cost of the IRA by 2050, we estimate that the CO2 abatement cost of the IRA is between $224 and $535 per ton. Different assumptions about the cost of the IRA, its impact on CO2 emissions levels, and the social cost of CO2 would yield different results.
Citation
Fisher, Travis, and Joshua Loucks. “The Budgetary Cost of the Inflation Reduction Act’s Energy Subsidies: IRA Energy Tax Credits Could Cost $4.7 Trillion by 2050,” Policy Analysis no. 992, Cato Institute, Washington, DC, March 11, 2025.

About the Authors


This work is licensed under a Creative Commons Attribution-NonCommercial-ShareAlike 4.0 International License.