You Ought to Have a Look is a feature from the Center for the Study of Science posted by Patrick J. Michaels and Paul C. (“Chip”) Knappenberger. While this section will feature all of the areas of interest that we are emphasizing, the prominence of the climate issue is driving a tremendous amount of web traffic. Here we post a few of the best in recent days, along with our color commentary.
—
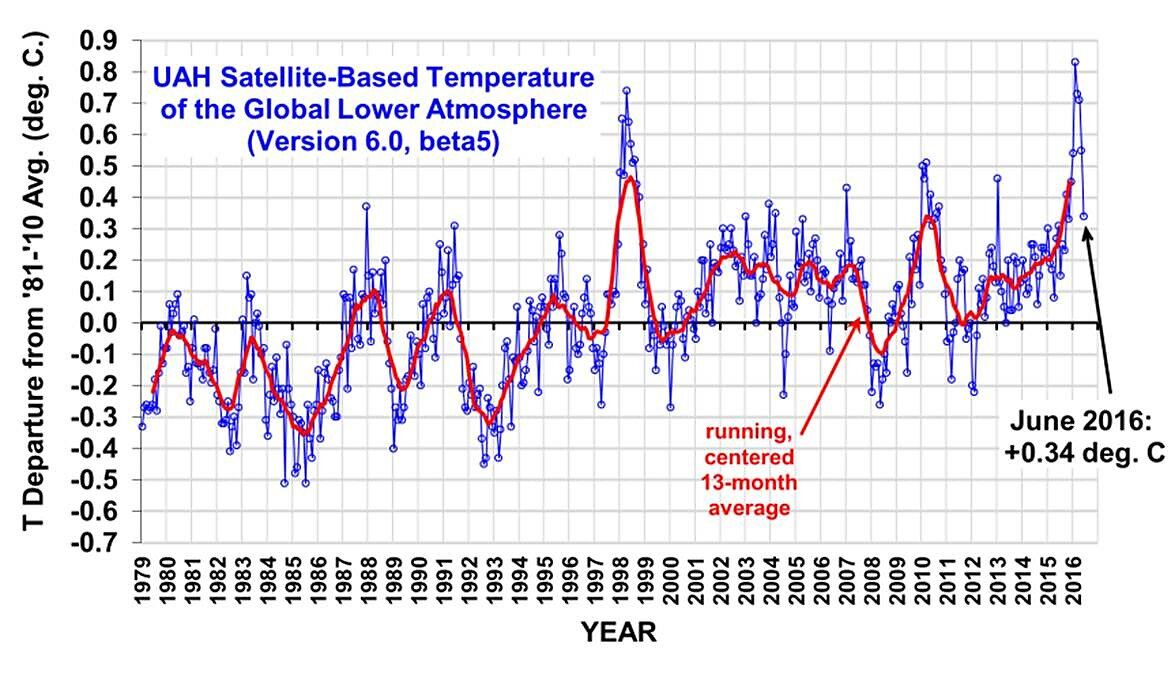
At the top of our list of things you ought to have a look at this week is a pair of blog posts by Dr. Roy Spencer updating the recent post-El Niño evolution of the satellite-observed temperature record of the earth’s lower atmosphere. In Roy’s first post, he updates the satellite record through June 2016, noting the big drop in temperatures as the effect of the recent big El Niño wanes. The take home figure looks like this:
Figure 1. Global average temperature of the lower atmosphere as derived and compiled by researchers at the University of Alabama at Huntsville, January 1979 through June 2016.
Roy notes that the “2‑month temperature fall of ‑0.37 deg. C, which is the second largest in the 37+ year satellite record.”
In a follow-on post, Roy looks to see what the prospects are for the 2016 annual temperatures being the highest in the 38-year satellite temperature history. In late June, Roy had concluded that is “2016 Will Likely See Record Global Warmth in Satellite Data.” But with the big drop in June temperatures, he is now reconsidering, writing that his previous prediction “looks…well…premature.”
Be sure to check out all Roy’s analysis and keep tuning in to see how the year’s temperatures are progressing. We surely will be.
Next up is a piece from Retraction Watch that notifies us that a (controversial) paper published last year that found that “Air pollution from fracking operations may pose an under-recognized health hazard to people living near them” and led to headlines like “Fracking could increase risk of cancer, new study finds,” well, was wrong. Turns out that the authors had used the wrong units in some of their calculations, and when they made the necessary correction, air pollution levels near fracking wells were well within EPA’s acceptable risk levels and below those that would increase cancer risk. Oops!
Be sure to check out the entire Retraction Watch article, it is chock-full of interesting tidbits.
And finally, the bottom of our post brings to the bottom of the world and a look at the increase in sea ice there.
The growth of sea ice around Antarctica that has been ongoing for at least the past 25 or so years is a somewhat inconvenient fact for global warming cheerleaders in that climate models predict that the region should be losing its sea ice (see for example the findings of Shu et al.).
For a long time, the U.N.’s IPCC did its best to downplay (deny?) the increase was indeed real (e.g., https://www.masterresource.org/climate-science/yet-another-incorrect-ipcc-assessment-antarctic-sea-ice-increase/). Finally, they capitulated under the weight of the growing (!) evidence, including in their 2013 Fifth Assessment Report: “It is very likely that the annual mean Antarctic sea ice extent increased at a rate in the range of 1.2 to 1.8% per decade (range of 0.13 to 0.20 million km2 per decade) between 1979 and 2012.”
Even so, when climate change worriers get together to talk impacts, they rarely mention the goings on with the sea ice around Antarctica, preferring instead to hyperventilate about Arctic sea ice declines (which, by the way, have no impact on sea level rise—like the floating ice in your cocktail glass, when it melts, it doesn’t affect the level of your drink).
That is, until now. Just this week a paper was published by Gerald Meehl and colleagues makes it safe to finally discuss Antarctic sea ice trends. Why? Because, Meehl & Co. link the increase to…wait for it…natural variability! Which means that while the poor climate models have been getting the sign of the trend wrong, it is not because of their inability to correctly ascertain the impacts of human-caused greenhouse gas increases, but rather that random processes—which the models are generally not expected to get the timing of—have been acting to overwhelm the model-projected decline. Whew!
Somehow, as is his inimitable fashion, Chris Mooney of the Washington Post manages to use this finding to proclaim that this is “bad news for climate change doubters.” We helped Valerie Richardson of the Washington Times get it right.
Bottom line is that if natural variability is leading to a slowdown of the warming around Antarctica (and leading to sea ice growth there), when it swings back the other direction, it should help prime the atmosphere with moisture (warmer air can hold more moisture than colder air) that should result in greater snowfall over Antarctica and a growing ice load on land—which does impact global sea levels, acting to lower them (that is, partially offset the rise from warming oceans). This sea level rise offsetting effect has long been expected but has been slow to be manifest (although there is some evidence that it is underway).
We’ll have to see how all of this develops in the future, but regardless of the outcome, it won’t be “bad news” for climate skeptics.

