Chairman Camp, Ranking Member Levin, and distinguished members of the Committee, I thank you for the invitation to appear at today’s important hearing. I am Mark Calabria, Director of Financial Regulation Studies at the Cato Institute, a nonprofit, non-partisan public policy research institute located here in Washington, DC. Before I begin my testimony, I would like to make clear that my comments are solely my own and do not represent any official policy positions of the Cato Institute. In addition, outside of my interest as a citizen, a homeowner and a taxpayer, I have no direct financial interest in the subject matter before the Subcommittee today, nor do I represent any entities that do.
As the Committee will note from my biography, I have spent most of the last two decades involved in various aspects of housing and mortgage finance policy. Without a doubt, I believe housing is a critical component of our economy. Moreover, I believe that housing is one of the basic necessities of life, if not the most important. Without stable, decent, and affordable housing, many other goals in life become quite difficult, if not impossible, to achieve.
With that in mind, our current tax code does little in helping to achieve those goals. A tax code that would both improve economic growth and housing affordability would ultimately be a code with low, simple, flat rates with few, if any, deductions. Accordingly I would urge the Committee, as an ultimate objective, to entirely eliminate the mortgage interest deduction (MID) and the deduction for local property taxes. I would also encourage the Committee to do so in a budget-neutral manner, lowering overall tax rates. As households have made significant investments and decisions based upon the current tax code, such a change should be phased in over a reasonable number of years. I would suggest no more than 7 years.
Residential Housing and the Tax Code
The tax code provides for four “preferences” for residential real estate: 1) the deductibility of mortgage interest; 2) the deductibility of local property taxes; 3) the non-taxation of “imputed rent” for homeowners relative to renters; and 4) the exclusion of capital gains on the sale of a primary residence for most owners. It should be emphasized that the deductibility of mortgage interest and property taxes is not exclusive to homeowners, in that landlords can also expense these items as well as claim a depreciation allowance for rental properties. It is the differential taxation of imputed and actual rents that favors homeownership, not the mortgage interest deduction.
Before I go into additional detail, it is worth summarizing what the academic literature has to say in relation to tax preferences for residential real estate, particularly for the mortgage interest deduction. Almost all of these conclusions reflect a general consensus within the academic community. Despite the public disputes over issues like stimulus spending or monetary policy, there is actually a very broad and consistent consensus on tax preferences for homeownership:
- The mortgage interest deduction does not have a significant impact on homeownership rates.
- The housing price impact of the MID differs dramatically across U.S. cities, with the largest impact in cities with constrained housing supply and while insignificant in relatively elastic (“loose”) markets.
- Benefits of the MID are highly concentrated among both the highest income and most-leveraged households.
- Tax “savings” from the non-taxation of imputed rent is almost twice that of the MID; tax savings from property tax deduction is much smaller than either.1
- Some portion of the subsidy value of the MID is captured by lenders via higher mortgage rates.2
- The value of the MID is positively related to the level of outstanding interest rates.
- To the extent that high mortgage loan-to-values contributed to the recent financial crisis, removal of the MID would improve financial stability.
Profile of Households and Mortgages
As a frame of reference, there are currently just over 76 million owner-occupied housing units in the United States. Of those, almost 26 million own their home free and clear of any mortgage, or almost a third of all homeowners. About half of these “free and clear” owners are aged 65 or older. Surprisingly, 4.8 million homeowners, living below the poverty level, also own their homes free and clear; a substantial portion of these households are elderly. Households that own free and clear are disproportionately, but far from exclusively, living in rural and suburban areas.
According to the Census Bureau’s American Housing Survey, about 50 million homeowners have either a regular mortgage, home equity loan and/or reverse mortgage. 43 million of these hold only a single mortgage. The typical (median) mortgagor has been paying on their mortgage for seven years and has an outstanding balance of $120,000, representing a median loan-to-value of 71 percent. The median monthly mortgage payment is $1,015 on a loan with a median interest rate of 5.3 percent. Five and a half million owners currently have rates of over seven percent.
Median and average values can be informative, but also misleading. If we assume a marginal effective tax rate of 25 percent, the typical median married family with a standard deduction of $11,900 would need a mortgage of at least $180,000 before it would become attractive to itemize based solely on their mortgage interest. So as a “back of the envelope” calculation around 25 million owners, or about half those with a mortgage, have mortgages that are simply too small for them to benefit from itemizing solely based upon the MID, which is usually a household’s largest deduction. Of course, combined with other deductions, use of the MID can become attractive for these households.
The Joint Committee on Taxation’s most recent estimates suggest that 34 million returns claim the mortgage interest deduction, totaling $68 billion in deductions. Seventy-six percent of the value of the MID is taken by households earning over $100,000.
The Joint Committee on Taxation estimates the value of the MID steadily increasing, on an annual basis, to $83 billion by 2017. Total value over the period of 2013 to 2017 is estimated to equal $379 billion. Of course, these estimates are extremely sensitive to the forecast of future interest rates. Much higher rates could easily increase these estimates considerably.
While the preceding is meant to offer a general frame of reference for the mortgage market, it also helps to remind us that about a third of owners do not have a mortgage and another third do not have a mortgage large enough to justify claiming the MID, leaving only a third of owners really impacted by any change to the MID. This, of course, says nothing about renters, who represent about a third of our population.
Mortgage Interest and Homeownership
Setting aside the obvious fact that the MID is a preference for home debt, not homeownership per se, the MID’s ability to lower the cost of housing is matched by the deductibility of mortgage interest on rental properties. Accordingly, the cost of mortgages on both rental and owner-occupied properties is lowered, with the net impact on tenure choice depending on both market conditions and the propensity of relevant households to itemize (currently the only way to take advantage of the MID). The propensity to itemize is positively related to income. Thus, at lower levels of household income, tax preferences to rent are stronger, whereas tax preferences to own dominate at higher income levels. As the lack of sufficient income is the foremost obstacle to homeownership, the current structure of real estate tax preferences encourages those to buy who are already likely to buy, whereas those likely to rent are encouraged to rent.
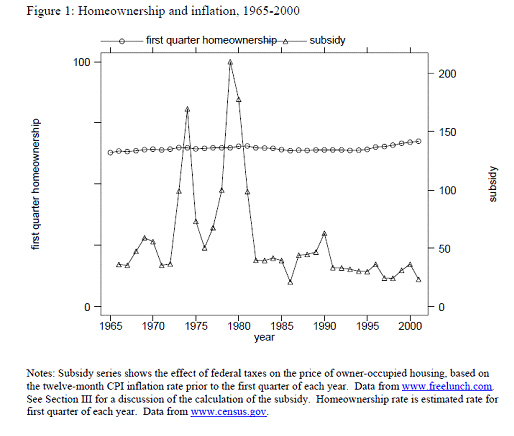
The lack of impact on homeownership from the MID is not simply a theoretical curiosity, but supported by the empirical evidence. Glaeser and Shapiro (2002) for instance calculate the annual value of the MID for 1965 to 2000 (see Figure 1 below)3. The aggregate value of the MID shows considerable variation over time. For instance, the after-inflation value of the MID in 1990 was about one-fourth of that in 1980, without a noticeable change in homeownership rates during the intervening decade. There is simply no empirical relationship in the United States between the value of the MID and the homeownership rate over this period.
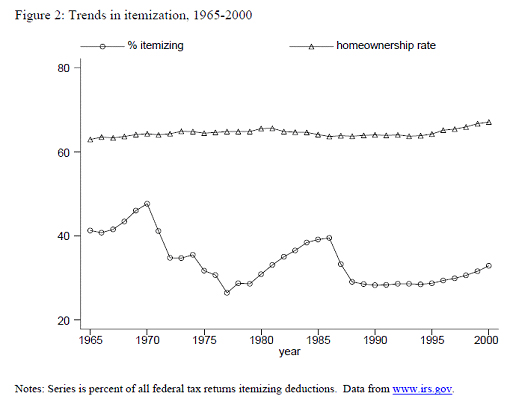
Nor (as illustrated in Figure 2) has this trend been driven by trends in the percent of households itemizing. After tax reform in 1986, the percent of returns itemizing declined dramatically, again with no noticeable impact on home-ownership rates. Comparing across states, Glaeser and Shapiro find that the higher the value of the average MID subsidy, the lower the state’s homeownership rate— the opposite of what one would expect if the MID increased homeownership.
It is worth mentioning that it is not inconsistent for the MID to have no impact on homeownership rates but still have a positive impact on the amount of housing consumed. At least over the short run, the MID likely facilitates the purchase of larger homes that would otherwise be built and consumed. Clearly, some amount of that subsidy will be captured by the seller (or builder) depending upon local supply conditions. So to the extent we debate the merits of the MID, it is really a debate about how much housing is consumed, rather than about the level of homeownership. While there is a sizable literature demonstrating a positive correlation for homeownership, on average, and a variety of positive social outcomes, this literature has not demonstrated a social benefit from larger house or lot sizes. And, of course, homeownership is not without its costs, as some scholars have found that higher homeownership rates are associated with higher levels of structural unemployment, as well as increased NIMBYism.
Geography of the Mortgage Interest Deduction
Rather than providing a uniform subsidy across American states and cities, the impact of the MID is highly concentrated. Sinai and Gyourko (2004) estimate that around a fifth of the value of the MID is received by households residing in California.4 Other high-cost housing states such as New York, Illinois, Massachusetts, and New Jersey are not far behind. Large population states such as Florida and Texas also receive substantial aggregate amounts due to the size of their population. That New Jersey receives more MID benefits than all of Texas illustrates those differences are being driven by housing prices, as well as the propensity to itemize across states.
One might argue that removal of the MID would have a disproportionately negative impact on those areas currently receiving the bulk of the benefits. I would argue, however, that these areas would in fact be the largest beneficiaries, as removal would help improve the affordability of housing in those locations. Generally, the bulk of the benefits of the MID go to areas where median housing prices are several times that of median incomes. For instance, in San Francisco, the median existing home price is almost eight times the median income. Such a disparity forces potential buyers to stretch to afford homeownership and to do so in a manner that makes them particularly vulnerable to any adverse economic shocks. Given that it is appears quite unlikely that median income in San Francisco will increase by 100s of percentage points anytime soon, family stability would be greatly improved by declines in house prices that would occur by removal of the MID. Given that about a fourth of San Francisco homeowners spend 40 percent or more of their income on housing, as reported by the Census Bureau, it would appear that a decline in prices is exactly what is needed there.
MID and Interest Rates
Figure 1 (above) illustrates how sensitive the value of the MID is to the outstanding level of interest rates in the economy. Quite simply, the higher the interest rates, the higher the value of the MID. This also implies that the higher the interest rates are, the greater their impact of the MID on house prices. Obviously the converse holds; the lower the interest rates are, the lower the value of the MID, and thus the lower the house price impact of a removal.
If we wish to minimize the price impact of eliminating or reducing the MID, then, all else equal, we should do so at a time when interest rates are at their lowest possible levels. It is difficult to imagine a time when mortgage rates will be lower than they are today. Accordingly, for the purposes of minimizing any adverse impact on the housing market, the optimal time for elimination of the MID is right now. As interest rates begin to increase, the cost and impact of doing so will only increase.
Towards Tenure Neutrality
As indicated in the preceding, the real reason the tax code favors owning over renting is not due to the MID but rather to the non-taxation of owners’ imputed rent. Although a handful of countries do tax owners’ imputed rent, I believe a far simpler system would be to move towards tenure neutrality by eliminating the taxation of rent.
My estimate, based upon Census data, is that renters pay around $33 billion annually in rent. As landlords can expense mortgage interest, repairs, fees and depreciation, I suspect only about two-thirds of that amount, or $22 billion, shows up as net rental income. Assuming an average effective tax rate of 25 percent, it is likely that somewhere around $6 billion is collected as tax revenue on rental income. Interestingly enough, this is roughly the amount spent on the low-income housing tax credit (LIHTC). Swapping out the LIHTC for a reduction in tax on rental income would shift much of the benefit away from larger developers to smaller property owners and individual landlords. As the LIHTC does add some new units to the stock (although there is considerable “crowd-out”), the question becomes whether a supply response by smaller property owners would be sufficiently large to offset any reduction by large developers dependent on the LIHTC. Swapping a reduction in rental income tax for the LIHTC would have the benefit of reducing transaction costs, as some amount of the LIHTC is captured by lawyers and syndicators.
Improving Financial and Macroeconomic Stability
A significant driver of the recent housing boom and bust, as well as the financial crisis, was the increasing leverage of household balance sheets. There are a number of reasons for this increase. One of these, however, is the tax treatment of mortgage interest. After the elimination of deductibility of non-mortgage interest in 1986, many households shifted their borrowing from consumer credit to home equity lines or other types of mortgage credit (see Maki 1996)5. There were certainly some benefits to households by doing so, but this shift induced households to reduce their home equity, leaving many in a more vulnerable position when housing prices inevitably declined. It should be noted that this effect was far from uniform. The increase in the standard deduction in 1986 induced some households at the margin to reduce their mortgage debt and switch away from itemizing. Dunsky and Follain (2000) estimate that about 4.5 million homeowners households switched from itemizing in 1983 to taking the standard deduction in 1989, while reducing their mortgage debt by an average of $8,000.6 On an aggregate level, this effect was however swamped by the number of households who increased their mortgage debt from 1983 to 1989.
Property Tax and Capital Gains
My focus has been on the mortgage interest deduction. The tax code also provides deductions and exclusions for property taxes paid on residential real estate and capital gains on the sale of principal residences. The Joint Committee on Taxation estimates these provisions are worth (2012) $24.5 billion and $22.3 billion respectively. Since landlords can expense property taxes paid, there is no net preference for homeownership that arises from property tax deduction. The subsidy is inherently one for local governments. The deduction likely reduces the monitoring and pressure on local governments from local citizens, leading to reduced efficiency and accountability. This deduction should be phased out in favor of a simpler and more neural tax code.
The exclusion for capital gains on the sale of a primary residence is a much harder issue to address. As the recent housing boom and bust illustrates, often what appears to be capital gains is merely illusory. As Yale Professor Robert Shiller has demonstrated, over long periods of time the after-inflation return from housing has been quite low. In general, I do not believe we want to tax households on inflation-driven gains. On the other hand, the exclusion of capital gains in housing likely adds to speculative behavior in the housing market. Given that over long periods of time most of the “gains” on housing are due from inflation and are quite volatile over the short run, the current exclusion of capital gains on a primary residence might be the least-bad policy. A family having to sell their home in 2009 (or 2003) would have recognized much smaller capital gains than a family selling in 2006, all else equal. It seems unwise to encourage families to time major life decisions based upon where we are in the housing cycle.
A Note of Caution on Scoring
As discussed in the preceding, households do not sit passively in the face of changes to the tax code. They “reshuffle” their assets and liabilities. In fact, one of the reasons to change the tax code is to influence household behavior. So while elimination of the MID would decrease households’ demand for mortgage debt, thereby reducing the leverage in our mortgage finance system, households will seek other avenues for reducing their tax liability, including a shift towards taking the standard deduction. For this reason, among others, estimates as to tax savings from the elimination of the MID should be taken with considerable caution. Follain and Melamed (1998) argue that in the face of household portfolio shifts that we can reasonably expect the scoring of elimination of the MID to be only around a fourth of the official “tax expenditure” figures.7 Beracha and Tibbs (2010) argue the actual benefits range between 50 and 75 percent of the estimates produced by JCT.8 I do not believe, however, such concerns should deter us from elimination of the MID, as the policy grounds for doing so dominate whatever the actual scoring might be.
Budget Neutrality
Elimination of the MID and deductions for local property taxes can be expected to increase tax revenues by tens of billions of dollars annually. Any estimate will have a very large margin of error. I am reluctant to offer a point estimate, but would suggest that removing these two reductions would increase revenues by between $30 and $40 billion annually, after households have adjusted. I would urge that instead of using removal as a method to raise revenue, Congress uses that “savings” to lower marginal rates.
A carefully structured reduction in marginal rates can “hold harmless” most households, in that their net tax liability would be unchanged or be subject to only minor changes. Essentially, I am suggesting that we lower tax rates largely on the same households that currently receive the most benefit from the MID. For instance, increasing the standard deduction by $500, as an offset for the MID, would hold harmless the vast majority of taxpayers with incomes under $100,000. In fact, increasing the standard by only $200 would hold harmless the majority of filers with incomes below $75,000. This would induce a restructuring of household balance sheets in a manner that would both improve financial stability and economic growth.
To use myself as an illustration, always a risky exercise I recognize, I reside here in the District of Columbia. As a homeowner here in a relatively expensive housing market, I have a relatively large mortgage. I have some ability to pay down a portion of that mortgage and reduce my overall leverage. I suspect I am not alone and that many households would prefer to be less leveraged. Should I do so, however, I would face a significant tax penalty. I would suggest that any tax system which punishes households for wanting to become more financially responsible is one we should change.
Conclusions
Our current tax code introduces significant, and costly, distortions into our housing and financial markets. As a general matter, I do not believe government should pick winners or losers. I would extend this point to the choice between renting and owning, as well as the choice between debt and equity. Currently our tax code favors owning for some households and renting for others. For all households, our tax code favors debt over equity. Reform of the current tax preferences for real estate should aspire to be tenure-neutral, debt-equity neutral and budget-neutral.
To achieve these aspirations, I would suggest the Committee adopt the following: full elimination of the deductibility of mortgage interest and property taxes, along with the elimination of taxing rental income. The net tax “savings” of such should be used to lower marginal tax rates so as to reduce the current tax penalty on labor income.
Reducing the code’s subsidies for mortgage debt would also induce investment to flow away from housing as an asset and toward productive capital. We should not forget that what ultimately grows wages and incomes is an increase in labor productivity, which comes about from an increase in productive capital, human or otherwise. Encouraging households to take on additional mortgage debt has not ultimately made them any wealthier or any more productive. Using the tax code to increase asset prices (such as houses) primarily benefits those who already hold those assets. These policies are inherently regressive and add to current levels of wealth inequality.
Notes:
1 James Poterba and Todd Sinai, “Tax Expenditures for Owner-Occupied Housing: Deductions for Property Taxes and Mortgage Interest and the Exclusion of Imputed Rental Income.” American Economic Review: Papers and Proceedings 2008, 98:2, 84–89.
2 Andrew Hanson, “The Incidence of the Mortgage Interest Deduction: Evidence from the Market for Home Purchase Loans,” Public Finance Review. 2012.
3 Edward Glaeser and Jesse Shapiro. 2002. The Benefits of the Home Mortgage Interest Deduction. Harvard Institute of Economic Research. Discussion Paper #1979.
4 Todd Sinai and Joseph Gyourko. 2004. The (Un)changing Geographic Distribution of Housing Tax Benefits: 1980 to 2000. National Bureau of Economic Research. Working Paper #10322. Also see Ike Brannon, Andrew Hanson, and Zackary Hawley, “The Geographic (and Political) Distribution of Mortgage Interest Deduction Benefits,” 2011.
5 D.M. Maki. 1996. “Portfolio Shuffling and Tax Reform” National Tax Journal XLIX(3): 317–329.
6 Robert Dunsky and James Follain, “Tax-Induced Portfolio Reshuffling: The Case of the Mortgage Interest Deduction.” Real Estate Economics 28(2000)#4:683–718.
7 James Follain and Lisa Sturman Melamed, “The False Messiah of Tax Policy: What Elimination of the Home Mortgage Interest Deduction Promises and a Careful Look at What It Delivers.” Journal of Housing Research 9(1998)#2: 179–200.
8 Eli Beracha and Samuel L. Tibbs, “A Closer Look at the Value of Tax Benefits for Homeowners,” Journal of Real Estate Practice and Education. 13(2010)#2:131–139.
About the Author
