I am Paul C. Knappenberger, Assistant Director of the Center for the Study of Science at the Cato Institute, a nonprofit, non-partisan public policy research institute located here in Washington DC, and Cato is my sole source of employment income. Before I begin my testimony, I would like to make clear that my comments are solely my own and do not represent any official position of the Cato Institute.
For the past 25 years, I’ve conducted research on climate and climate change including working to quantify potential human influences upon it.
Let me start off by saying that climate change results from a variety of factors, both human and natural, and takes places on times scales spanning decades to eons. Within the separation of causes, numerous influences are at play. Human contributions include large-scale changes to the natural landscape including the effects of urbanization, agriculture, and forestry, as well as atmospheric emissions of greenhouse gases such as carbon dioxide along with aerosol particulates and their precursors. Natural influences to the climate include internal oscillations (such as El Niño) as well as external influences such as variations in solar activity and volcanic eruptions. Together, all of these factors, and, in fact, many others, act to steer the earth’s weather and climate, through both time and place.
These facts are undisputed. What is disputed is the degree to which we can separate and identify the influence of those individual factors, on global, and even more importantly, on local scales (the scale in which we as individuals interact with the climate). While there is broad agreement that the earth’s average surface temperature has risen nearly a degree Celsius over the past 150 years or so, the level of uncertainty in our understanding of the individual factors behind this observed rise is substantial. For example, while it is well understood that an increase in the atmospheric concentration of carbon dioxide will exert a warming pressure on the earth’s temperature, the magnitude and character of the climate change that may result is still a matter of considerable scientific research and discussion. As a consequence, bankable and actionable projections of the evolution of earth’s future climate are, in many cases, not possible. Furthermore, the projections that are being produced, not only of climate change but also as to its impacts, are subject to so many competing assumptions that they can be readily manipulated to produce virtually any outcome—a non-robust situation in the light of the large diversity of current political opinions.
With those caveats in mind, I’ll take a look at some of the projections of climate change as a direct result of atmospheric emissions from human activities—primarily the burning of fossil fuels such as coal, oil, and natural gas, to produce energy. As a metric of climate change, I’ll use the change in the global average surface temperature. My focus will be on the impact of U.S. regulations and proposals aimed at mitigating future climate change by reducing the carbon dioxide emissions from the consumption of energy produced by greenhouse-gas emitting fossil fuel sources. I’ll also place the U.S. impacts in a global reference frame.
Using a readily available tool that was in part developed through support of the U.S. Environmental Protection Agency—a climate model emulator acronymed MAGICC for the Model for the Assessment of Greenhouse-gas Induced Climate Change1—I (or anybody else for that matter) can input the greenhouse gas emission reductions that are anticipated to be accomplished by federal regulations or other actions, and have them turned into global temperature savings. MAGICC is a widely used tool both in U.S. federal climate assessments as well as those produced by the United Nation’s Intergovernmental Panel on Climate Change (IPCC) to explore climate outcomes resulting from alterations to emissions scenarios or other climate parameters.
One would think that employing MAGICC to assess the climate impact of the myriad of federal regulations and other actions specifically targeted towards mitigating future climate change would be standard operating procedure, however, quizzically, it is not often done (or reported?). Instead, the impacts of the new or proposed regulations are usually touted in terms of emissions savings—which are not a metric of climate change. Here, I will fill this glaring omission by translating the reported emissions savings into an actual climate metric—the resulting change to the projected global average temperature.
First, I’ll look at the EPA’s Clean Power Plan. According the EPA, the goal of the Clean Power Plan is to reduce the level of carbon dioxide emissions produced by U.S. power plants in the year 2005 by 32% by the year 20302. Through the powers of MAGICC, it is revealed that those emissions savings would result in a global temperature savings (that is, projected temperature rise averted) by the end of this century, of about 0.02°C (two one-hundredths of a degree Celsius) (assuming a middle of the road emission scenario (SRES A1B) and a climate sensitivity of 3°C (a value that is increasingly looking to be too high, more on this later)). As I discussed earlier, there is a considerable level of uncertainty about this estimate, but the uncertainty revolves generally around whether the Clean Power Plan will avert one one-hundredths of a degree or three one-hundredths of a degree of future temperature rise. In other words, it doesn’t change the overall picture—that the Clean Power Plan, in and of itself, produces no meaningful or even scientifically detectable, for that matter, alteration to the future course of the earth’s climate.
If this information is included in the actual Clean Power Plan or its supporting documents, I could not find it, nor has anyone pointed it out to me. However, the documentation of the Clean Power Plan prominently includes a lengthy discourse on the EPA’s assessment of anthropogenic climate change and its perceived negative impacts. The lack of quantification of how the Clean Power Plan will serve to mitigate those changes or impacts represents an awkward omission.
Using the same methodology described above, one can run the numbers for the longer-term targets that President Obama has put forward—that is, an overall reduction of greenhouse gas emissions from the U.S. of 80% by the year 2050. Again, this scenario is readily input into EPA’s MAGICC tool and the resulting temperature “savings” is about 0.11°C—in other words, about one-tenth of one degree.
It is this environmentally inconsequential number which must be at the forefront of any and all discussions as to whether to force the transformation of our energy system necessary to meet such a target.
And yet such discussions are taking place with scarce mention of this scientific reality.
At the end of this month, in Paris, France, the U.N. will hold its 21st meeting of the Conference of the Parties (aka COP21) to the 1992 United Nations Framework Convention on Climate Change (aka the Rio Treaty)—whereby nations of the world agreed to try to “stabilize greenhouse gas concentrations in the atmosphere at a level that would prevent dangerous anthropogenic interference with the climate system.”
Last year, at COP20, in Lima, Peru, countries were assigned a homework project to be completed prior to this year’s meeting—to come up with their own “Intended Nationally Determined Contributions” towards reducing greenhouse gas emissions with an eye towards achieving the objective of the Rio Treaty. In the INDCs, each country got to decide for itself (rather than from an international mandate) how it was going to handle the issue of climate change and what steps it was going to take to mitigate it. In its INDC, each country shared its specific intents with the rest of the world.
In the U.S. INDC it says “the United States intends to achieve an economy-wide target of reducing its greenhouse gas emissions by 26-28 per cent below its 2005 level in 2025 and to make best efforts to reduce its emissions by 28%” and added that “This target is consistent with a straight line emission reduction pathway from 2020 to deep, economy-wide emission reductions of 80% or more by 2050. The target is part of a longer range, collective effort to transition to a low-carbon global economy as rapidly as possible.”3
Interesting, and perhaps reflecting current U.S. emissions trends, the U.S. INDC is a slight weakening of the pledges previously offered at the 2009 UN COP15 in Copenhagen, Denmark. At the COP15, the U.S. pledged to reduce its national greenhouse gas emissions by 17% below the 2005 levels and added in a footnote that “The pathway set forth in pending legislation would entail a 30% reduction in 2025 and a 42% reduction in 2030, in line with the goal to reduce emissions 83% by 2050.” That “pending legislation” never came into law.
Figure 1 shows historical U.S. carbon dioxide emissions from 1990-2013 along with the pledges offered in COP15 and COP21. U.S. greenhouse gas emissions peaked in 2007 and have declined since, largely as a result of an economic downturn, natural gas replacing coal in the mix of fuels used to generate electricity, with a smaller contribution from the increase in renewable energy sources and other federal actions aimed at reducing greenhouse gas emissions.4 If the downward trend from 2005-2013 were to continue through 2020, the goal of reaching a level 17% below the 2005 level would be achieved. However, a continuation of that trend is uncertain given the ongoing economic recovery and a lessening of the rate at which natural gas is replacing coal in the energy mix. The slackening of the downward trend in emissions in recent years is perhaps one of the reasons that the 2025 target in the US INDC is slightly lower than its COP15 (Copenhagen) pledge.
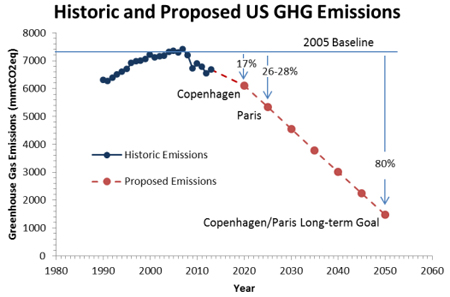
Figure 1. Historic and proposed greenhouse gas emissions from the United States.5
But even with the less aggressive INDC pledge, it is unlikely that the U.S. will be able to achieve its 2025 target with existing legislation. A recent analysis by Climate Action Tracker, a consortium of four research groups established to track the climate effectiveness of the country-by-country INDCs, reports that while the Clean Power Plan is a vital part of U.S. efforts to meet its pledged 26-28% reduction, it, along with all current regulations, is insufficient. They write:
“According to our analysis, the finalised Clean Power Plan issued in August 2015 contributes to moving towards the emission levels indicated in the INDC. But the US will need to implement additional policies to reach its proposed targets. The planned policies (e.g. the additional actions mentioned in the Climate Action Plan), if fully implemented, are sufficient to meet the 2020 pledge. The US will have to implement additional policies on top of the currently planned policies to reach its 2025 pledge, which requires a faster reduction rate than the rate before 2020.”
Figure 2 is a graphic developed by Climate Action tracker that indicates the level of deficiency. Even considering everything on the books, being proposed, or still under development, the projected trajectory of future greenhouse gas emissions from the U.S. is not such that it will meet the 2020 goal (or a linear continuation of that target to 2050).
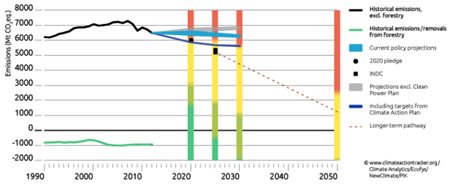
Figure 2. Historic (black line) and projected (colored lines) U.S. greenhouse gas emissions. The grey line indicated the projected emissions without including the anticipated impacts of the Clean Power Plan, the blue line are the projected emissions including the Clean Power Plan, and the purple line includes additional emission reductions from efforts described in the President’s Climate Action Plan. The black circle is the US 2020 pledge made in COP15 and the black square is the US pledge made in its INDC for COP21.6
But even if the US were to achieve its 2025 INDC pledge it will produce little in the way of mitigating climate change. Again, turning to MAGICC, if the U.S. successfully achieved its 2025 INDC target and maintained that emissions level throughout the rest of the 21st century, the projected temperature rise averted by the year 2100 would amount to about 0.04°C. As previously mentioned, the U.S.’s intended 80% decline by 2050 averts about 0.11°C of future warming.
But these values are, as usual, absent from the U.S. INDC itself.
One reason often given for why such numbers are not included in such analyses is that the U.S. actions should not be judged in isolation, but as part of a larger global effort to mitigate climate change.
So I’ll answer the question “If everyone else in the world played along, how much global warming would that avert?”
With the build-up to the Paris U.N. climate conference, several analyses have been undertaken by independent organizations to assess the global temperature implications from the complete collection of the 130+ INDCs (currently covering over 90% of sglobal carbon dioxide emissions) which have been submitted by the parties to the Rio Treaty. In a recent report7, the World Resources Institute collected together these various temperature change projections and reported that they range from an end of the century temperature rise of 2.7°C up to 3.7°C. The WRI noted that “[s]cenarios showing higher temperature increases by 2100. . .assume no continued progress after the INDCs are achieved. . .[while] [t]he scenarios showing lower temperature increases. . .assume that mitigation effort of 2020-2030 continues throughout the century.”
A critical look at the “baseline” scenarios—that is, those that do not include explicit actions addressed at mitigating climate change—indicates that the projected temperature rise by the year 2100—is in the 3.0°C to 4.0°C range8. Which means that the current set of global INDCs barely departs from the baseline (i.e., business-as-usual) expectations for the global economy going forward.
This outcome is indicated by the U.N.’s own assessment of the INDCs as shown in Figure 39. The orange range indicates the pre-INDC case of global greenhouse gas emissions and the yellow bars (at 2025 and 2030) indicate the range of emissions expected to result if the pledges made within the INDCs are actually met. As a comparison, the blue ranges indicate the global emissions pathways (beginning in either 2020, 2025, or 2030) required to limit the total global average temperature rise to 2.0°C—a number identified by the U.N. as necessary to avoid a dangerous human impact on the climate. Note that the pathway indicated by the INDCs bears little relation to the necessary steps to keep total warming beneath 2.0°C. Rather, the nations are signaling their intent to support efforts to grow their local economies rather than limit global temperature change.10
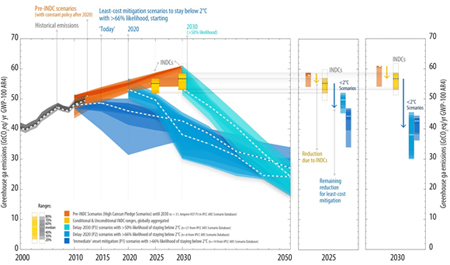
Figure 3. Comparison of global emission levels resulting from the intended nationally determined contributions in 2025 and 2030 with other trajectories (source: United Nations).
Despite this reality, the possibility of limiting the temperature rise from human greenhouse gases to 2.0°C above the pre-industrial level is still not out of the question (if you are so inclined as to place significance on the 2.0°C number).
All of the temperature projections that I have described thus far in my testimony have been determined based on the assumption that the earth's climate sensitivity—that is, how much the average surface temperature of the earth will increase under a doubling of the atmospheric concentration of carbon dioxide—is about 3.0°C. In fact, there is a growing body of scientific literature, and a growing consensus, that the earth's climate sensitivity is actually close to 2.0°C (Figure 4).11
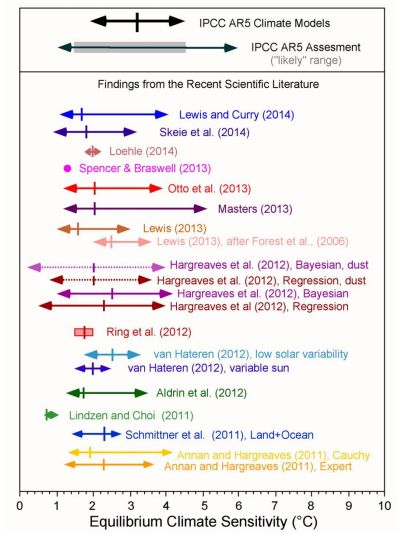
Figure 4. Climate sensitivity estimates from new research beginning in 2011 (colored), compared with the assessed range given in the Intergovernmental Panel on Climate Change (IPCC) Fifth Assessment Report (AR5) and the collection of climate models used in the IPCC AR5. The “likely” (greater than a 66% likelihood of occurrence) range in the IPCC Assessment is indicated by the gray bar. The arrows indicate the 5 to 95 percent confidence bounds for each estimate along with the best estimate (median of each probability density function; or the mean of multiple estimates; colored vertical line). Ring et al. (2012) present four estimates of the climate sensitivity and the red box encompasses those estimates. The right-hand side of the IPCC AR5 range is actually the 90% upper bound (the IPCC does not actually state the value for the upper 95 percent confidence bound of their estimate). Spencer and Braswell (2013) produce a single ECS value best-matched to ocean heat content observations and internal radiative forcing. The mean climate sensitivity (3.2°C) of the climate models used in the IPCC AR5 60% greater than the mean of recent estimates (2.0°C).
When the MAGICC model is rerun with this lower value of the climate sensitivity, the projected temperature changes (both temperature rise and temperature rise averted) decrease by about 25 percent.
The implication is two-fold. First, the already minuscule impact that U.S. actions will have on future climate change is reduced still further, and second, the overall temperature rise associated with business-as-usual global greenhouse gas emissions will result in a less than commonly advertised global warming (and concomitant impacts—both on the natural environment and on human society) that is very close to the U.N.’s 2.0°C temperature target. These two considerations lower the urgency, and bring into question the necessity, of climate mitigation efforts like the EPA’s Clean Power Plan, the President’s Climate Action Plan or pledges to the United Nations.
When making decisions on matters regarding climate change, I urge you all to examine the projected quantitative impacts that the actions under discussion are expected to have on the climate and its future evolution. This type of information is vital in order to weigh the reasonably expected benefits against the reasonably expected costs. In most cases, I believe that you will be surprised at how small and uncertain the former actually are.
NOTES
1 Model for the Assessment of Greenhouse-gas Induced Climate Change, MAGICC: http://live.magicc.org/
2 EPA’s Clean Power Plan as it is described in the Federal Register: http://www.gpo.gov/fdsys/pkg/FR-2015-10-23/pdf/2015-22842.pdf
3 United States Intended Nationally Determined Contribution:
http://www4.unfccc.int/submissions/INDC/Published%20Documents/United%20States%20of%20America.pdf
4 U.S. Energy Information Administration, “U.S. Energy-related Carbon Dioxide Emissions, 2013”: http://www.eia.gov/environment/emissions/carbon/
5 Data on historic greenhouse gas emissions are from the EPA: http://www3.epa.gov/climatechange/ghgemissions/usinventoryreport.html
6 Climate Action Tracker, “USA”: http://climateactiontracker.org/countries/usa.html
7 World Resources Institute “INSIDER: Why Are INDC Studies Reaching Different Temperature Estimates?” http://www.wri.org/blog/2015/11/insider-why-are-indc-studies-reaching-different-temperature-estimates
8 Paul C. Knappenberger presentation to the Cato Institute Conference “Preparing for Paris, What to Expect from the U.N.’s 2015 Climate Conference”: https://www.cato.org/multimedia/events/preparing-paris-what-expect-uns-2015-climate-change-conference-panel-3-realistic
9 United Nations “Synthesis Report on the Aggregate Effect of INDCs”:
http://unfccc.int/focus/indc_portal/items/9240.php
10 Cass, O., 2015. Leading Nowhere: The Futility and Farce of Global Climate Negotiation. Manhattan Institute: https://www.manhattan-institute.org/html/leading-nowhere-futility-and-farce-global-climate-negotiations-7816.html
11 Michaels, P.J., and P.C. Knappenberger, 2014. Quantifying the Lack of Consistency between Climate Model Projections and Observations of the Evolution of the Earth's Average Surface Temperature since the Mid-20th Century. American Geophysical Union Fall Meeting, San Francisco, CA, Dec. 15-19, Paper A41A-3008.
About the Author
