
Fifty-five percent of private schools that responded to our survey reported enrollment increases between the 2021–22 school year and 2022–23, while 20 percent saw decreases and 25 percent reported no change. The average change was 10 students, around a 5 percent increase from the 2019–20 average. Nearly half reported having more applicants than seats.
Introduction
When COVID-19 looked like it might devastate American private schooling, Cato’s Center for Educational Freedom began tracking the sector’s health, first cataloging schools going under and then cataloging enrollment trends. While private schooling took a hit in the early part of the pandemic, as COVID-19 progressed we started seeing evidence that private schooling was rebounding, likely because private schools had gotten back into the academic swing of things faster than public schools, including reopening to in-person instruction.
How is private schooling doing now? Has the increasing enrollment we saw in 2021 ended, or has the 2022–23 school year seen a continuation of growing enrollment?
Resources
Most Schools See Enrollment Rise
Our latest enrollment data indicate that private education is indeed continuing to see growth, even as public schools have slowly returned to instructional normalcy. Among our respondents—derived from a large, web “scraped” sample rather than a small random sample—55 percent had enrollment increase between the end of the 2021–22 school year and the start of 2022–23, 25 percent reported no change, and 20 percent saw enrollment decline (see Figure 1).
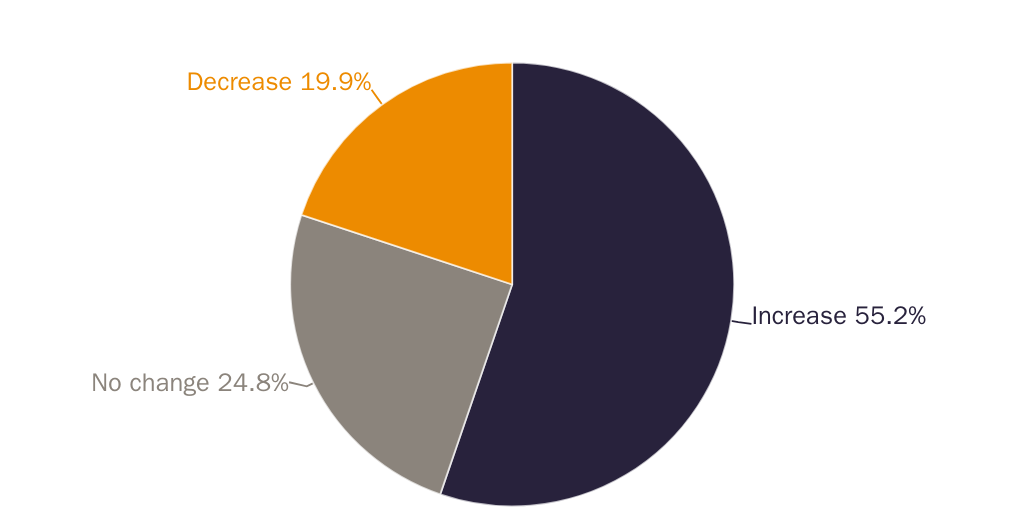
The average enrollment change was a bit over 10 students, with fluctuations ranging from a loss of 75 to a gain of 200. With the average private school in fall 2019 enrolling almost exactly 180 students, that is more than a 5 percent average increase.
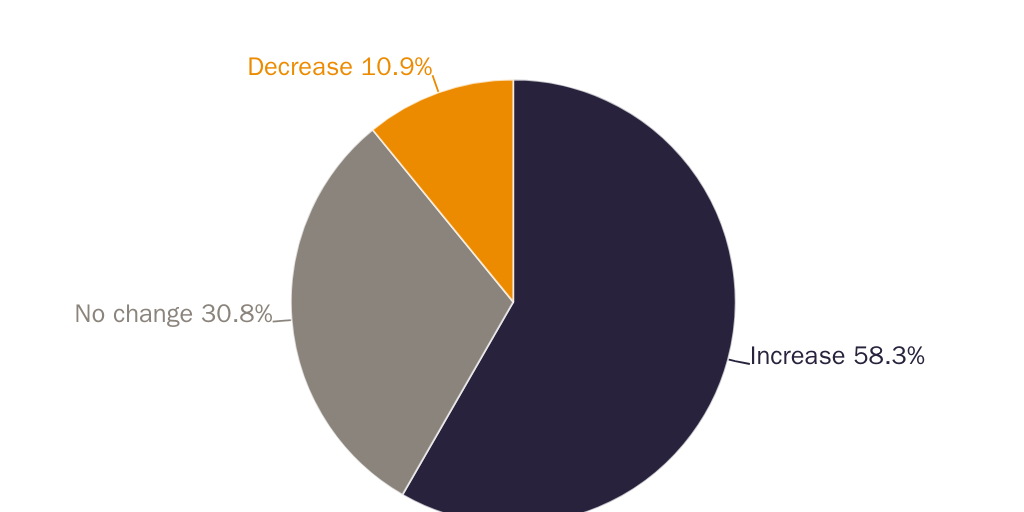
Most Schools Had Increased Applications, and Almost Half Had More Applicants than Spaces
This year we added questions about changes in applications and whether schools had more applicants than spaces available. If the latter were the case, it would suggest that demand for private schooling is greater than what is indicated only by enrollment changes.
Applications did indeed rise, with 58 percent of schools reporting increased applications, 31 percent no change, and 11 percent drops (see Figure 2).
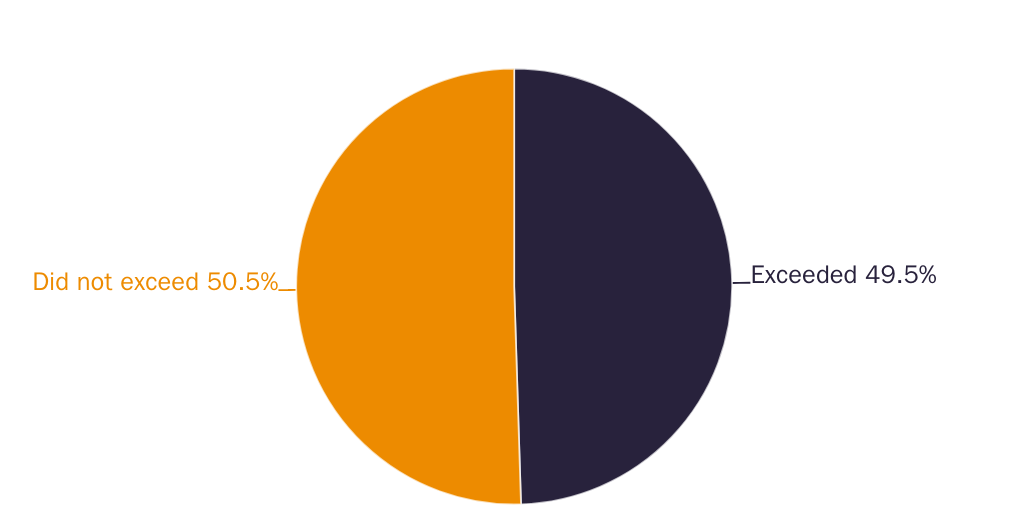
Many schools also had more students apply than they could accommodate. Nearly half of respondent schools reported having more applications than seats available (see Figure 3).
Implications
Fears about private schooling suffering a devastating blow from COVID-19 have not been realized. After losing enrollment early on, the sector appears to be bouncing back and may, in fact, be healthier than before the pandemic as public schools struggled to respond to COVID-19 in ways that satisfied all parents. The question going forward is whether private schooling will continue to see growth even while public schools have generally returned to normal operations this year.
Methodology
We changed our methodology from previous years in an effort to significantly increase our sample and reduce our margin of error. Rather than selecting a relatively small, random sample of schools from the federal Private School Universe Survey, we electronically “scraped” school websites from Private School Review (PSR), an online database of American private schools, and then used Hunter.io to find associated email addresses. Our goal was to come as close to reaching the whole population of private schools as possible.
We began with a list of 27,259 schools collected from PSR. Of those, 2,854 were identified as closed, leaving 24,405 open. Using the web-scraping program, we obtained emails for 11,289 schools. Removing duplicate emails and schools for which we already had an email address left 10,781 schools without emails. We randomized the order of that list and manually searched for emails from a sample of schools. We found 599 additional emails after looking through 997 schools, providing a total of 11,888 schools with at least one email address.
We sent an invitation to participate in the survey to the first email address we had for each of the 11,888 schools. Of those, 1,744 bounced or failed to deliver and 312 were duplicates. The email was successfully sent to 9,826 unique emails. We sent two reminder emails to the schools. We also had alternative emails for some schools and sent the survey to those addresses for 9,928 of the schools. Of those, 1,411 bounced or failed to send and 296 were duplicates. The email was successfully sent to 8,225 unique emails. We sent the survey to a second alternative email for 8,678 schools. Of those, 1,313 bounced or failed to send and 103 were duplicates. The email was successfully sent to 7,264 unique emails. We sent the first and second alternative addresses two reminders.
We also called a random sample of schools that did not respond to the email and attempted to administer the survey over the phone. We called 260 schools and were able to administer the survey completely to 52.
We collected data from October 12 to October 31, contacting 10,549 unique schools. We had 298 schools respond to at least some portion of the survey, and 286 provided the data for the primary variable of interest: whether enrollment had increased, decreased, or stayed the same, giving us a response rate of 3 percent. Different variables reported here had slightly different numbers responding, but assuming essentially a random distribution of response, all fell within a +/- 6 percent margin of error at the 95 percent confidence interval.
Limitations
Our past surveys had very small samples leading to large margins of error. We reduced the sample problem, though we would, of course, have preferred a higher response rate and, hence, larger sample. On the flip side, by attempting to contact the entire population of private schools, it is possible that our sample systematically missed schools with characteristics that might have impacted their enrollment. For instance, schools whose web domains could not be “scraped” from PSR might have related characteristics, such as, perhaps, administrative staff sizes, that make them more or less likely to see enrollment increases or decreases. If that is the case, our results would not be nationally representative.
There are also more clear limitations. Microschools, which are small schools that may serve fewer than 10 students, appear to have had a recent surge in growth and are likely underrepresented in PSR and therefore underrepresented in our survey. We also did not include schools with no electronic contact information available—email or telephone—which exist but likely serve communities, such as the Amish, that would tend to only have changing enrollment as a result of changing numbers of school-age children, as opposed to parents sending children to a different school. Finally, it is possible that schools that answered the survey tended to have characteristics that might have made them more or less likely to see enrollment increases or decreases than schools that did not answer.
We do have some indications that our sample is roughly representative of the country, based on the limited data about responding schools that we collected with the survey and additional data we are collecting for future analysis. First, state shares of schools in our sample and of private schools nationally are roughly the same. As of 2019, for instance, Alabama accounted for 1.3 percent of private schools nationally while it accounts for 2 percent of our sample. Florida accounts for 8.2 percent of all private schools and 6.9 percent of our sample. Virginia has 3.3 percent of all private schools and 4.9 percent of our sample.
We also have a breakdown by school type that is roughly similar to federal private schooling data, though how schools are classified may not be consistent between ours and federal data. Roman Catholic schools are 14.6 percent of our sample but 21.2 percent of private schools nationally, Lutheran schools are 7.7 percent of our sample but 4.6 percent of all private schools, and schools for students with disabilities are 3.8 percent of our sample but 5.9 percent of private schools nationally.
Emily Ekins, Colleen Hroncich, Jordan Gygi, and Kayla Susalla contributed to this report. Any questions can be sent to Cato Center for Educational Freedom director Neal McCluskey.
About the Author


This work is licensed under a Creative Commons Attribution-NonCommercial-ShareAlike 4.0 International License.