
Introduction
The Cato Institute 2021 Immigration and Identity National Survey of 2,600 U.S. adults seeks to explore and examine why Americans support or oppose a more open immigration regime. Americans have complex views on the subject—views they often are unsure how to express. Most Americans have very positive views of immigration and few have outright wholly negative views. However, many Americans remain conflicted, perceiving immigration to present both immense benefits but also challenges. Academic scholarship and in-depth interviews with experts and laypersons who support more or less immigration informed the questionnaire design for this survey. The survey seeks to quantify these different beliefs and then moves deeper to understand what drives support or opposition to immigration. Given the many benefits of immigration, careful attention is paid to understanding opposition to increasing immigration and the desire to decrease it. For simplicity, this report often refers to those who want to decrease immigration as “immigration Restrictionists,” those who want to increase immigration as “immigration Expanders” and those who want to maintain current levels as “immigration Maintainers.”
Resources
In addition, the survey pays careful attention to the beliefs, attitudes, and experiences among foreign-born first-generation immigrants, immigrants’ American-born children identified in this report as second-generation immigrants, the grandchildren of immigrants identified as third-generation immigrants, and other native-born Americans for whom all grandparents were born in the United States. The survey included additional oversamples of Latino (N=300) and Asian (N=300) American respondents who are more likely to be or have family involved in immigration. The survey results show that attitudes across immigration backgrounds often vary and provide unique and helpful insights into how Americans of all immigrant backgrounds view the United States and the world. The survey was conducted in English and thus the responses among first-generation immigrants are limited to those with English fluency.1 This means that responses among the first-generation will reflect the beliefs among this subset of first-generation, English-fluent immigrants. For this reason, careful attention is also paid to second-generation immigrants to gain perspective on how first-generation immigrants’ views may be similar to or different from other Americans’. Furthermore, caution should be used when interpreting results of first-generation immigrants, as they are not representative of first-generation immigrants who are not fluent in English.
Section I: What Americans Think about Immigration
Americans’ Preferences for Immigration Levels
Support for More Immigration Is on the Rise
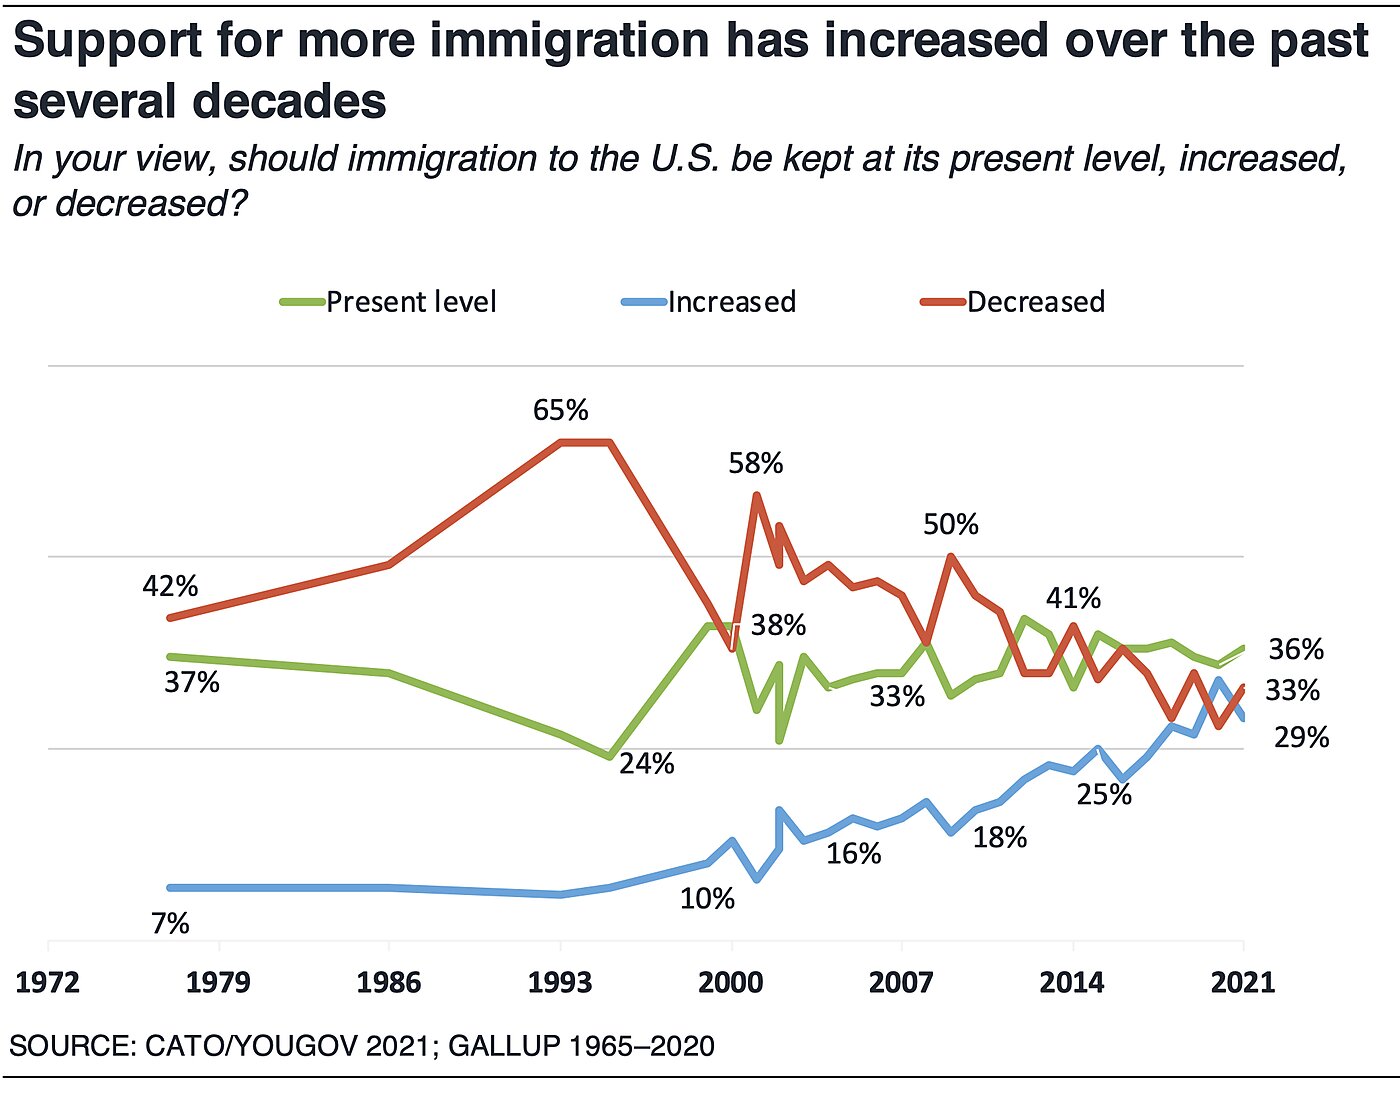
Over the past several decades, support for increased immigration has been on the rise. In 1975, only 7% of Americans wanted to increase immigration, 37% wanted to maintain present levels, and a plurality (42%) wanted to decrease it, according to Gallup. This was notable because only about 5% of the U.S. population was foreign-born at the time. Opposition to immigration reached an apex in the mid-1990s, with 65% wanting less and 7% wanting more (the foreign-born population was about 9%). Soon after, however, support for immigration began to rise precipitously. Today, with about 14% of the population being foreign born, about as many Americans want to increase immigration (29%) as decrease it (33%), according to the Cato Institute 2021 Immigration Survey, consistent with Gallup’s polling. Thirty-eight percent (38%) want to keep it the same.
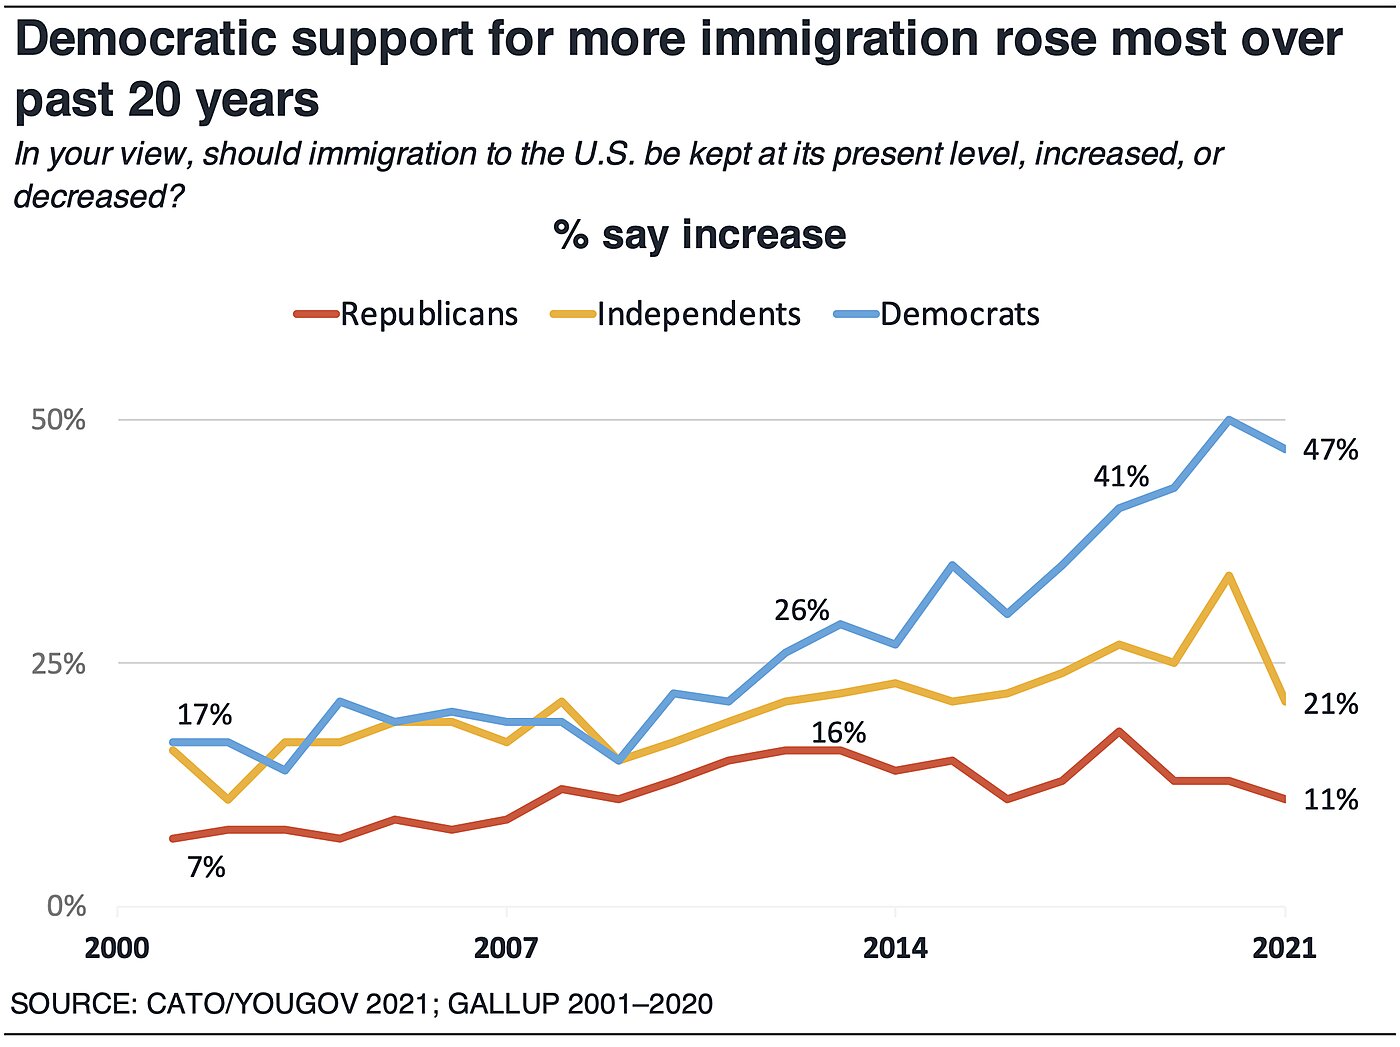
Changes in Democrats’ views largely account for this shift. Today, nearly half (47%) of Democrats support increasing immigration to the U.S., compared to 21% of independents and 11% of Republicans. In contrast, in 2001 Gallup found only 17% of Democrats, 16% of independents, and 7% of Republicans wanted to increase immigration. Thus, about 20 years ago partisans had more similar attitudes. Views diverged starting around 2010 when Democratic support began to accelerate.
Among all Americans, 57% believe that people’s desire to reduce immigration to the United States is motivated by a “sincere interest in controlling our borders.” Forty-three percent (43%) say “racist beliefs” are the true motivation.
70% of Democrats Say Racist Beliefs Drive Desire for Less Immigration
Democrats stand out, however, with 70% saying that racist beliefs motivate demand for less immigration. In contrast 60% of independents and 88% of Republicans believe intentions are sincere. There’s a racial divide as well. White Americans (61%) are more likely to believe motives are sincere, while a majority (56%) of African Americans think it’s driven by racism. Latino and Asian Americans are divided in half about whether motives are racist or sincere.
Who Wants to Increase, Decrease, or Keep Immigration the Same? A Profile of Immigration Expanders, Maintainers, and Restrictionists
Restrictionists: Immigration Restrictionists are more likely than immigration Expanders to be White American (77% vs. 61%) and somewhat less likely to be African American (9% vs. 12%), Latino (8% vs. 17%), or Asian American (3% vs. 7%). They tend to be older (with 55% vs. 35% over the age of 55) and are less likely to have college degrees (22% vs. 36%). They have moderate incomes and are about half as likely as Expanders to earn more than $100,000 annually (12% vs. 20%). They are more likely than Expanders to live in less populated areas (42% vs. 21% live in a small town or rural area). They are somewhat more likely to live in the Midwest (23% vs. 19%) and South (38% vs. 33%). Restrictionists also are more likely to identify as conservative (62% vs. 14%) as well as independent (33% vs. 21%) and Republican (44% vs. 12%).
Expanders: Immigration Expanders are mostly White American (61%) but are more likely to be African American (12% vs. 9%), Latino (17% vs. 8%), and Asian American (7% vs. 3%) than Restrictionists are. Expanders are more likely than Restrictionists to have a college degree (36% vs. 22%) including post-graduate degrees (17% vs. 8%) and higher incomes (20% vs. 12% earn more than $100,000 annually). Expanders also tend to be younger (56% vs. 45% are under 45). They generally live in more densely populated areas (50% vs. 25% live in a city) They are somewhat more likely to live in the Northeast (20% vs. 17%) and West (28% vs. 22%). Expanders are more likely to identify as liberal (49% vs. 7%) and as Democrats (60% vs. 13%).
Maintainers: Those who want to maintain immigration levels are similar in some ways to Expanders and in other ways to Restrictionists. Like Expanders, Maintainers are more racially diverse (61% White, 13% Black, 19% Latino, and 6% Asian American) than Restrictionists. But like Restrictionists, Maintainers are less likely than Expanders to have college degrees (24%). A plurality of Maintainers identifies as politically moderate (39%) and Democratic (39%). The remainder are split between identifying as conservative (32%) and liberal (22%).
These three groups differ in their level of social trust, with Restrictionists the least trustful of others. Restrictionists (73%) are the most likely to agree that you “can’t be too careful in dealing with people,” followed by 69% of Maintainers. Expanders are least likely to agree (57%) that most people can’t be trusted.
Expanders are more likely to know many immigrants personally. Nearly two-thirds (62%) say they know “a lot” or “some” immigrants. Restrictionists are about 20 points less likely to say they know many immigrants (44%). Maintainers fall in between, with 50% saying they know many immigrants. Furthermore, Expanders are much more likely to personally be first- or second-generation immigrants (35%) compared to Restrictionists (13%) and Maintainers (25%). Similarly, Expanders are more than twice as likely as Restrictionists to be fluent in another language besides English (44% vs. 20%).
In their own words, quotes from Expanders, Maintainers, and Restrictionists:
Expanders:
In a few words, can you explain why you’d prefer to increase immigration?
- Immigrants enrich our country by bringing new experiences, beliefs, and foods. Most of them have a strong work ethic and truly want to make America a better place. We need to create a better path for citizenship.
- My grandparents were immigrants and so were so many I grew up with. If immigration was not happening then, I wouldn’t live in this country now.
- This country is founded and almost entirely populated by immigrants and the descendants of immigrants. You can’t just come inside and lock the door behind you.
- Recent immigrants and noncitizens contribute more and commit fewer crimes than the average of all U.S. residents. They make our nation more economically competitive. Most refugees trying to immigrate are fleeing conditions the U.S. created. We owe them asylum and a path to citizenship.
- There are people trying to immigrate to America because they are seeking asylum, are in danger, or want a better life for their families. America is in a position to help, and immigrants help stimulate the economy.
- Immigration is good for the economy, it brings young dynamic entrepreneurs with a strong work ethic. Our population is getting older. We need more young people to add to the tax base and contribute to Social Security.
Maintainers
In a few words, can you explain why you’d prefer to keep immigration at its present level?
- The current level of immigration has proven to be sustainable while having a generally positive impact on the national economy. Changing this level has the potential to alter some of these variables and break the equilibrium.
- Keeping immigration at the current level will ensure that the country has the infrastructure in place to assimilate new migrants (process entry, availability of basic needs) and keep the borders secure.
- A controlled flow is healthy—our country should welcome immigrants who come through legal means.
- I think that immigration is great; our nation grows stronger when it consists of citizens of diverse beliefs and backgrounds. However, the U.S. doesn’t really take care of all of its citizens as it is, so I don’t really think immigration should increase right now.
- The USA cannot provide jobs for 100% of its citizens and residents as is. More legal immigration means more unemployed people collecting government assistance.
- Immigrants need to assimilate into American society, but huge influxes always seem to end up with people in enclaves where they don’t learn English. Also, too many coming in on visas take work from citizens because businesses are allowed to hire them for less. We can’t flood the hiring market with visa holders. Note, I am talking about LEGAL immigration. Illegal immigration must be stopped.
- I think in general, the government needs to take time to be more cautious about who they are letting into the country. I’m not talking about race, religion, sexual preference, etc. I’m advocating a more thorough vetting system.
Restrictionists
In a few words, can you explain why you’d prefer to decrease immigration?
- We are not here to solve society’s problems in other countries or rescue the world. Each country should take care of its own. When each small unit is healthy, the whole is healthy. Healthy families make healthy communities, which make healthy states, which make a healthy country. Teach other countries to get rid of corruption and enable citizens to manage their own lives while providing some basic structure. Let each country be unique.
- [Immigration should be decreased] because millions upon millions of people from south of the border have invaded our country and have not assimilated, instead turning us into the countries they left.
- [Immigration should be decreased] because our country cannot financially sustain an infinite amount of immigrants. Further, the Democratic Party is only in favor of packing our country with illegal immigrants for votes. Highly immoral.
- I don’t have a problem with immigration as long as it’s done legally.
- If you go through legal immigration and can contribute to society, you are more than welcome. If you are trying to illegally enter our country, you should be turned away. And we should not take refugees from countries that we know hate us.
- Most current immigrants are low-skill workers who will require welfare, Medicaid, and social assistance. This drives down the wages of low-skilled American citizens and reduces the amount of benefits available to help our own citizens.
- Several illegal immigrants have been convicted of dangerous crimes in my state. Many support the cartel. Also, they come to live free off hard-working American taxpayers’ dollars. Safety and security are the main reasons.
91% of Americans Welcome Immigration to U.S., 9% Want to Shut Down the Border
An overwhelming majority (91%) of Americans welcome immigration to the United States. Very few—only 9%—think “no immigration” would be good for the country. Instead, 68% prefer a “low level” of immigration and 23% want a “high level” of immigration. Majorities of immigrants (58%) and native-born Americans (69%) both say they prefer low levels of immigration over either high or no immigration. Notably, majorities of Democrats (58%), independents (68%), and Republicans (79%) share a preference for low levels of immigration.
53% Say Ability to Immigrate Is a Human Right, but Few Want Fully Open Borders
Of course, people mean different things by “low” or “high” levels of immigration. The survey told respondents that the U.S. currently admits about 1 million immigrants per year and then asked respondents about how many should be admitted annually. Among those who prefer a low level of immigration, 46% selected a number less than 100,000 per year. Another 42% selected 500,000–1 million per year, and 10% selected more than 1 million per year. Among those who prefer a high level of immigration, 27% selected less than 1 million a year, 22% selected 1 million per year, and the majority (51%) said more than 1 million per year (including 20% who said as many as want to come).
Among all Americans, when asked how many immigrants should be admitted to the U.S. each year, 60% said less than 1 million per year, about a fifth (19%) said about 1 million a year, and another fifth (20%) preferred more than 1 million a year—including 8% who said as many immigrants as want to come should be allowed into the U.S. The fact that 1 million sounds like a large number may have influenced answers. However, out of 300 million people, 1 million is 0.33%.
These numbers do not vary dramatically across racial groups. Support for increasing immigration beyond 1 million people a year reaches 20% among White Americans, 18% among Black Americans, 17% among Latino Americans, and 27% among Asian Americans.
Opinion does vary by education level. Americans with post-graduate degrees (38%) are about three times as likely as those with high school degrees or less (13%) to support admitting more than 1 million immigrants per year.
A majority (53%) of Americans agree that the “ability to immigrate to a new country is a human right for all people.” Democrats (72%) and libertarians (55%) are more likely than independents (45%) and Republicans (33%) to agree. African Americans (61%), Latino Americans (64%), and Asian Americans (60%) also are more likely than White Americans (48%) to agree. Young people also are much more likely to agree: 64% do so among 18–29-year-olds compared to 39% among those over age 65 (a 25-point gap).
Although most people believe immigration is a human right, only a third (33%) want to “eliminate all restrictions on immigration” and allow anyone to move here after the pandemic. Furthermore, only about a third (29%) want to increase immigration from its current levels.
Taking the results together suggests that people feel empathy for those who wish to immigrate to a new country to seek better opportunities, but they may not be comfortable with many people doing it all at once.
72% of Strong Liberals Support Open Borders
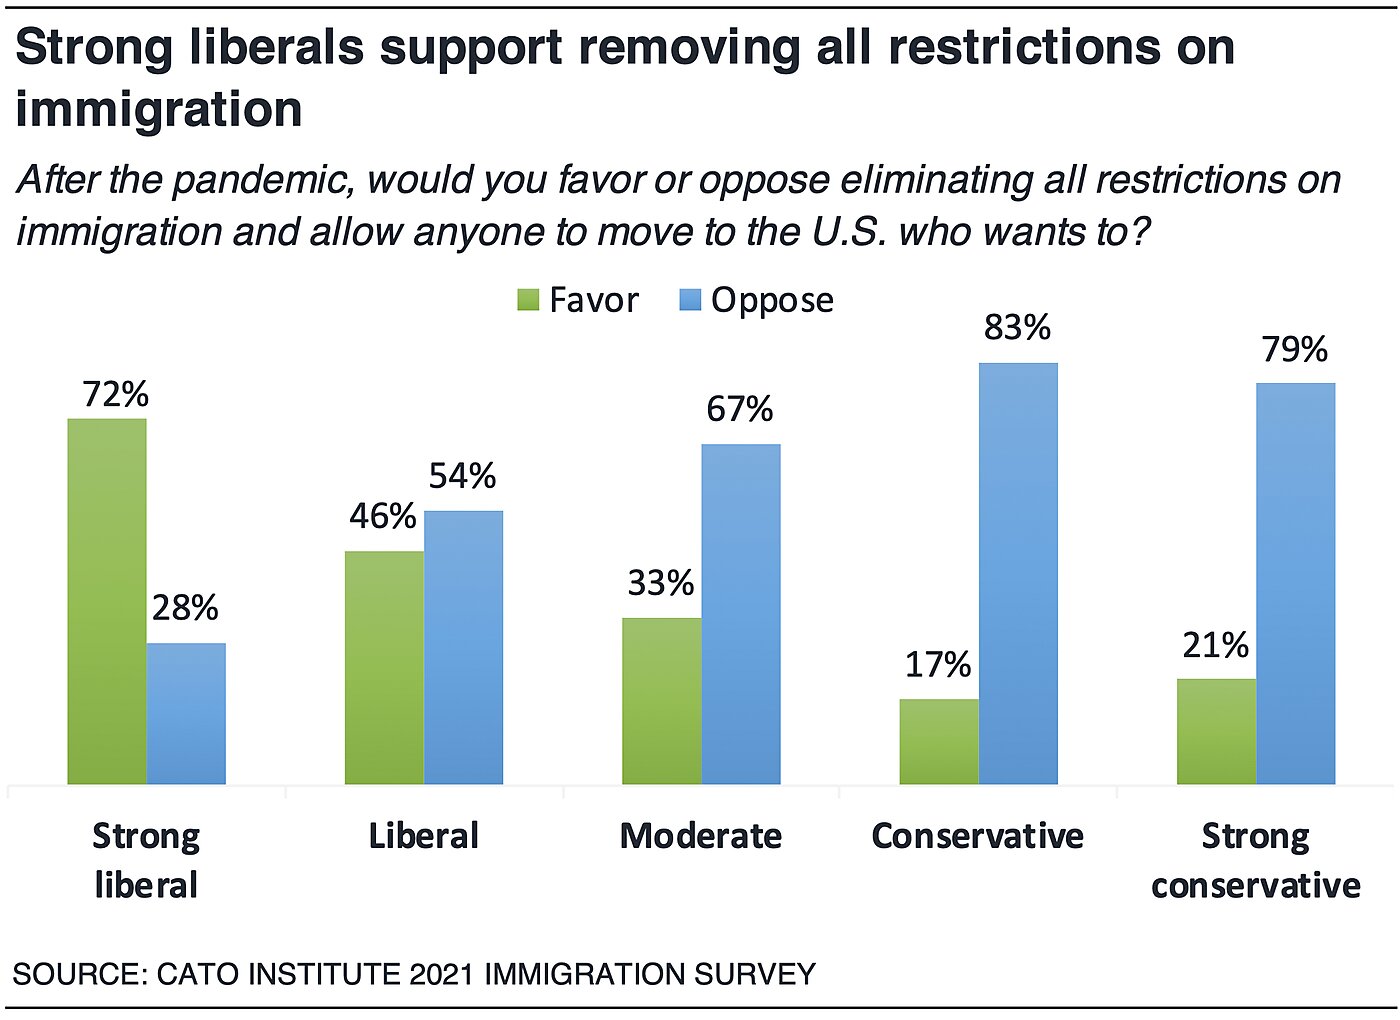
The ideal level of immigration divides the Democratic coalition. Strong liberals (71%) are nearly 20 points more likely to want to increase immigration compared to moderate liberals (52%). And while 65% of strong liberals want a high level of immigration, a majority (54%) of moderate liberals want a low level of immigration. Furthermore, strong liberals stand out as one of the only groups with a majority (72%) who favor removing all restrictions on immigration compared to less than half (46%) of moderate liberals.
In open-ended responses, many moderate Democrats revealed that they wanted more immigration than occurred during the Trump administration but aren’t fully comfortable with a high level either. As one middle-aged Democratic man said, “I think we need to increase [immigration] because Trump decreased [it] too much. I would like to see Obama levels of immigration.”
In contrast, one Democrat who wants to greatly increase immigration explained, “We should have open borders. By allowing high immigration we are showing that we accept other cultures and want to lead the world as it comes together in diplomacy.” Others pointed to economic benefits, diversity, and the belief that “America has always been a place for people to get away and start a new life.”
72% Prefer Less Immigration If More Immigration Reduces Government Services
Many academics believe there may be an inverse relationship between migration levels and welfare spending. The idea goes, if immigration goes up public support for welfare spending declines or its rate of increase slows.2 The survey asked Americans, if they had to choose, would they rather have more immigration and a government that provides fewer services and benefits or less immigration and a government that provides more services and benefits? By a 3 to 1 margin Americans prefer less immigration and more government services (72%) to more immigration and fewer government services (26%).

Among immigration Expanders, only 38% would continue to support more immigration, and 60% would want less, if more immigration came at the expense of welfare spending. Among immigration Restrictionists, 17% would opt for more immigration if that meant smaller government.
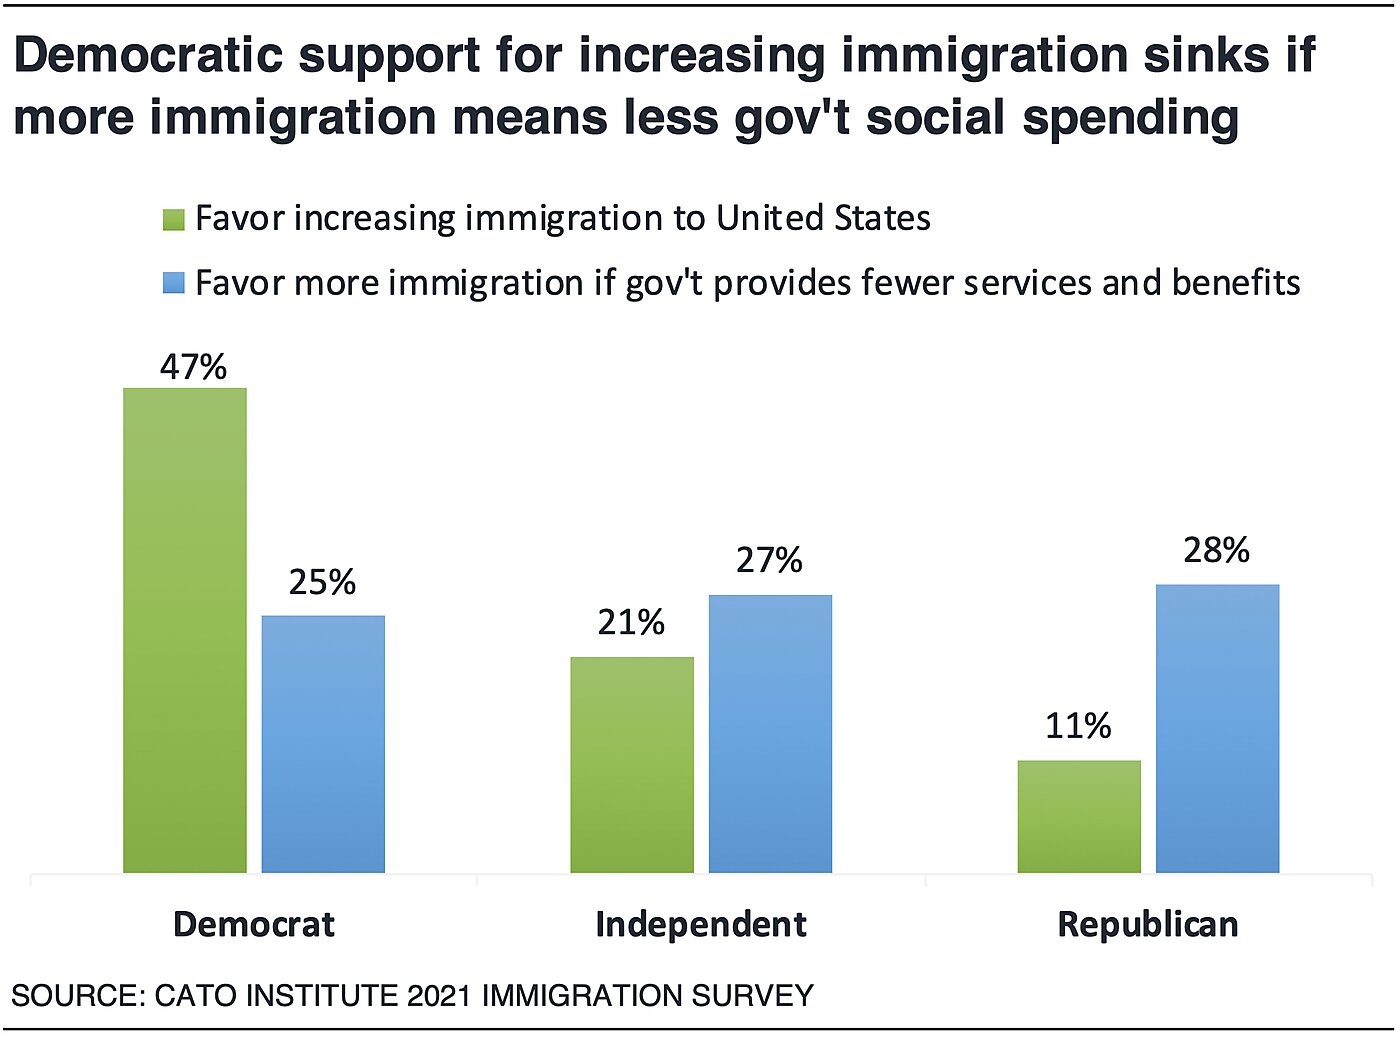
Among partisans, while at first 47% of Democrats support increasing immigration, only 25% would support it if more immigration meant fewer government services. Conversely, support for more immigration rises among Republicans (11% to 28%) and slightly among independents (21% to 27%) if more immigration means that the government would provide fewer services. Furthermore, strong conservatives (36%) are more likely than strong liberals (23%) to prefer more immigration and fewer services. These results indicate that progressives’ commitment to liberalized immigration is tenuous if social spending is at stake. Further, conservatives may be more open to immigration if social spending were restrained.
In addition, Latino Americans (37%) are more likely than White Americans (24%), Asian Americans (25%), and Black Americans (31%) to favor more immigration and less welfare spending to less immigration and more welfare spending.
Americans Estimate That 40% of the U.S. Is Foreign-Born
The survey found that Americans estimate that immigrants comprise about 40% of the U.S. population. This is notable because the actual share of foreign born is about 14%. If one were to include the foreign-born and their American-born children, that number rises to about 26% of the population. Either way, Americans considerably overestimate how many immigrants live here.
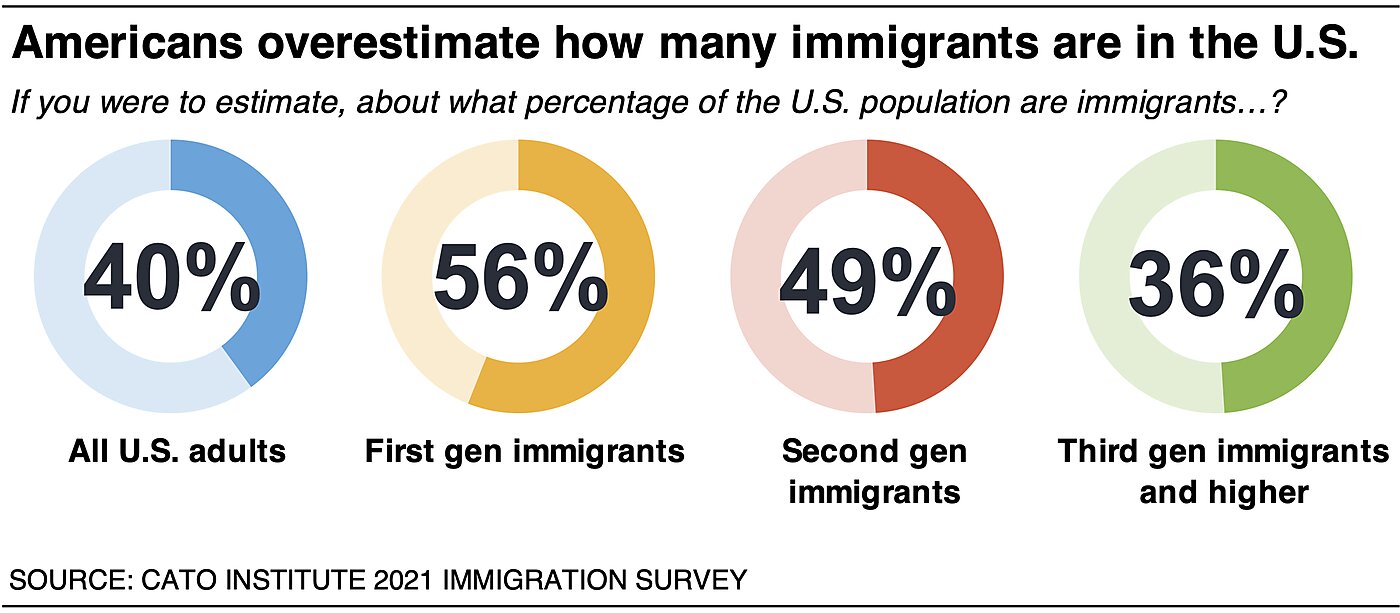
First-generation immigrants estimate that 56% of the U.S. are immigrants, second-generation immigrants estimate 49%, and the third-generation and higher estimate 36%. People living in cities estimate 49% of the U.S. are immigrants while those in suburbs and rural areas assume 37%. White Americans estimate 35%, Black Americans estimate 51%, Latino Americans estimate 50%, and Asian Americans estimate 47%. Strong liberals’ come the closest to being accurate with an estimate of 28%, while conservatives’ estimate (40%) is at the national average.
Americans Want to Maintain or Increase Immigration Levels across World Regions; Some Are More Cautious of Latin American Immigration
Most Americans want to maintain current immigration levels or increase them across world regions. However, some Americans prefer immigration from some regions more than others. About three-fourths of Americans say the number of immigrants is either “about right” or “too few” from Europe (74%), Asia (72%), and Africa (71%). Somewhat fewer feel similarly about immigration from the Middle East (61%) and Latin America (55%). The share of Americans who say there are “too many” immigrants from these regions are as follows: from Latin America, 45%; from the Middle East, 38%; from Africa, 28%; from Asia, 28%; from Western Europe, 24%; and from Eastern Europe, 24%.
Gallup first started asking this question in 1984. Examining the historical data reveals that more Americans today say “too few” immigrants come from each of these six regions, compared to 1984.
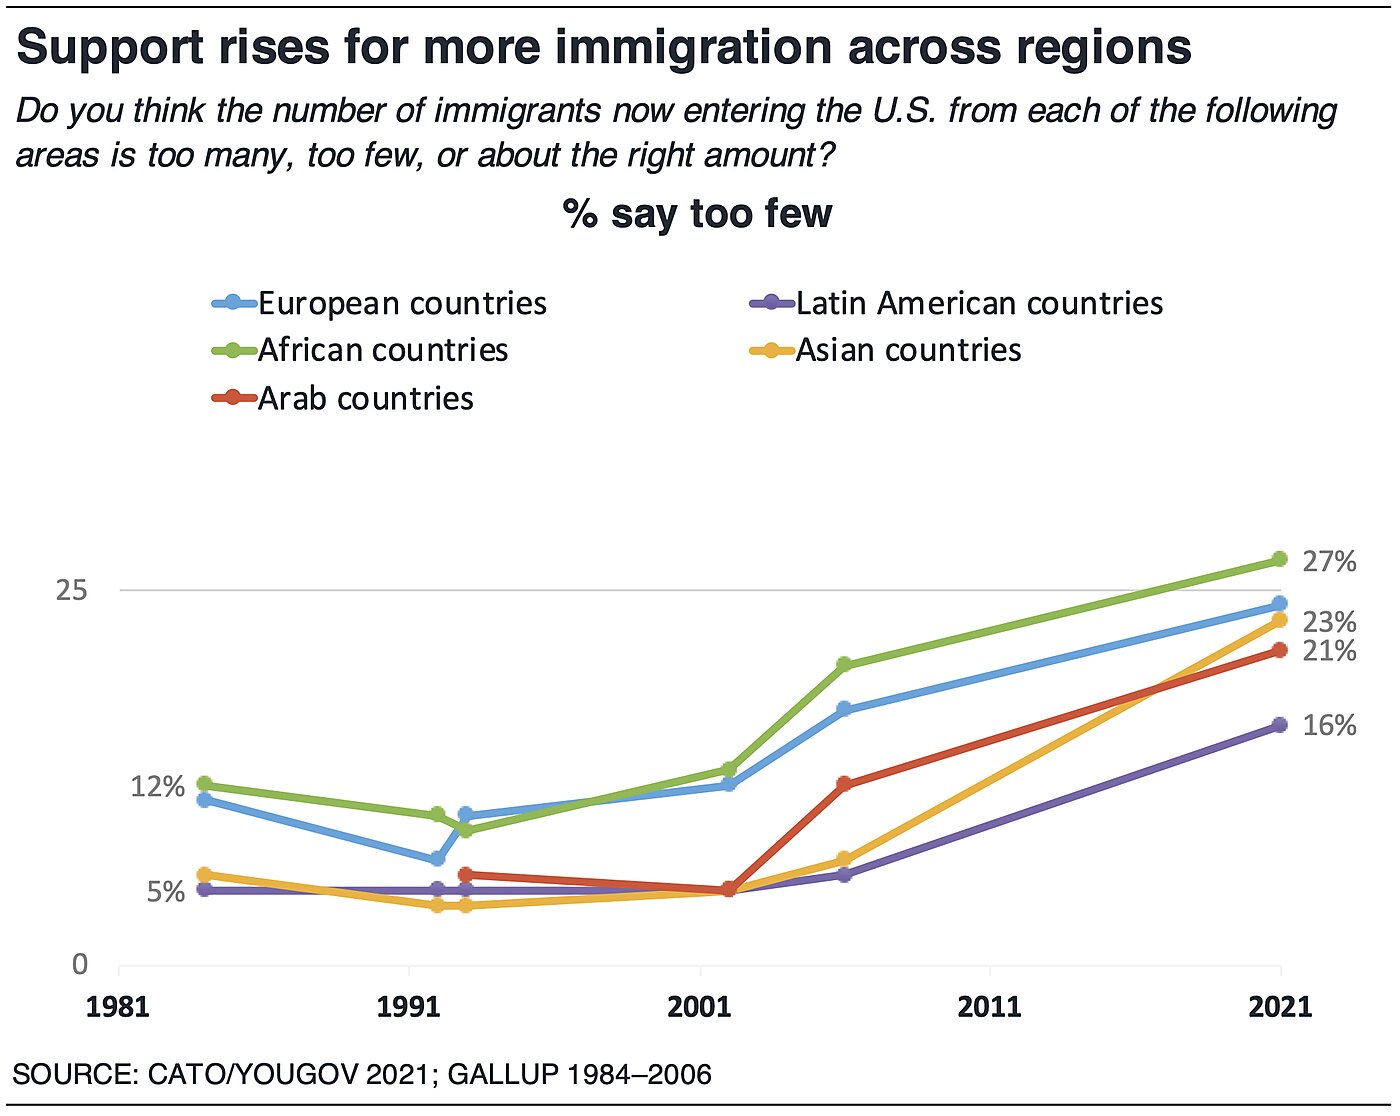
These results demonstrate that Americans do not support for decreasing immigration from any particular region of the world. However, more Americans want to decrease than increase immigration from Latin America (−29 points) and the Middle East (−17 points). Americans do not give a clear preference to European countries (where many of their family trees originated). Instead, about as many want more as want fewer immigrants from Western and Eastern Europe, Africa, and Asia. Furthermore, the data reveal that only about 2% of respondents say they want less immigration from Latin America, the Middle East, Africa, and Asia but want more or to maintain current immigration from Europe. More common is the 15% of Americans who say there are “too many” immigrants from all six of the regions asked about. Among Republicans, 26% say there are too many immigrants from all regions compared to 5% of Democrats and 19% of independents. Very few Republicans (3%) expressed a clear preference for European immigration, similar to Democrats (1%) and independents (2%).
What Americans Think about Illegal Immigration
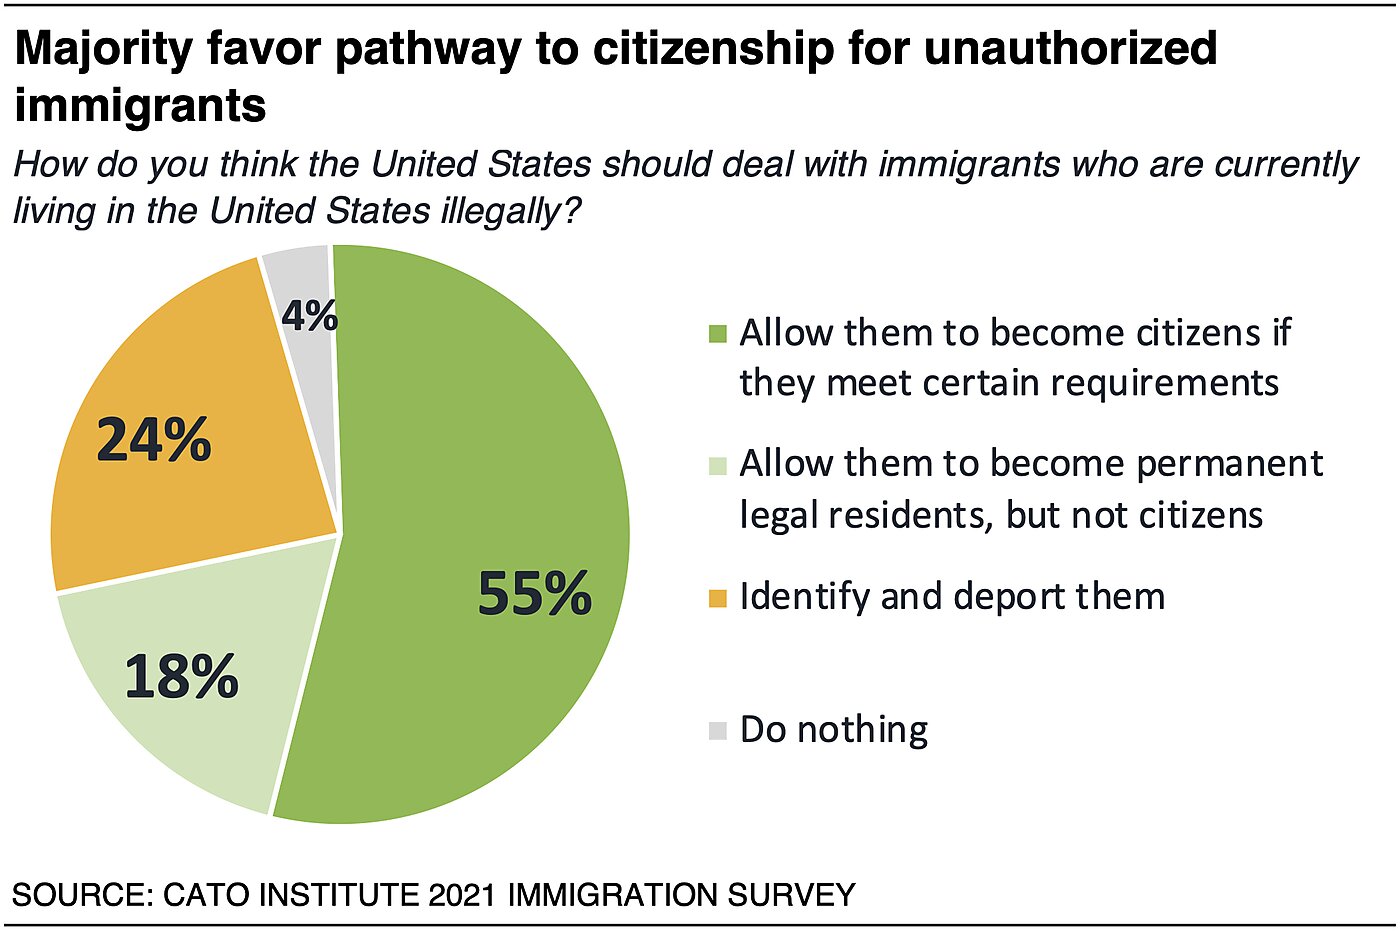
55% Support a Pathway to Citizenship for Unauthorized Immigrants
A majority (55%) of Americans support offering unauthorized immigrants a path to become citizens if they meet certain requirements. A quarter (24%) want to deport unauthorized immigrants. About a fifth (18%) support permanent legal residency without the offer of citizenship. Another 4% say the country should “do nothing” about those living in the country illegally.
56% Say Simplifying Legal Immigration Is the Better Way to Deal with Illegal Immigration
When asked to choose a better approach for dealing with illegal immigration, a majority (56%) think it’s better to make the legal immigration process easier. Forty-three percent (43%) would rather build a border wall and increase border security.
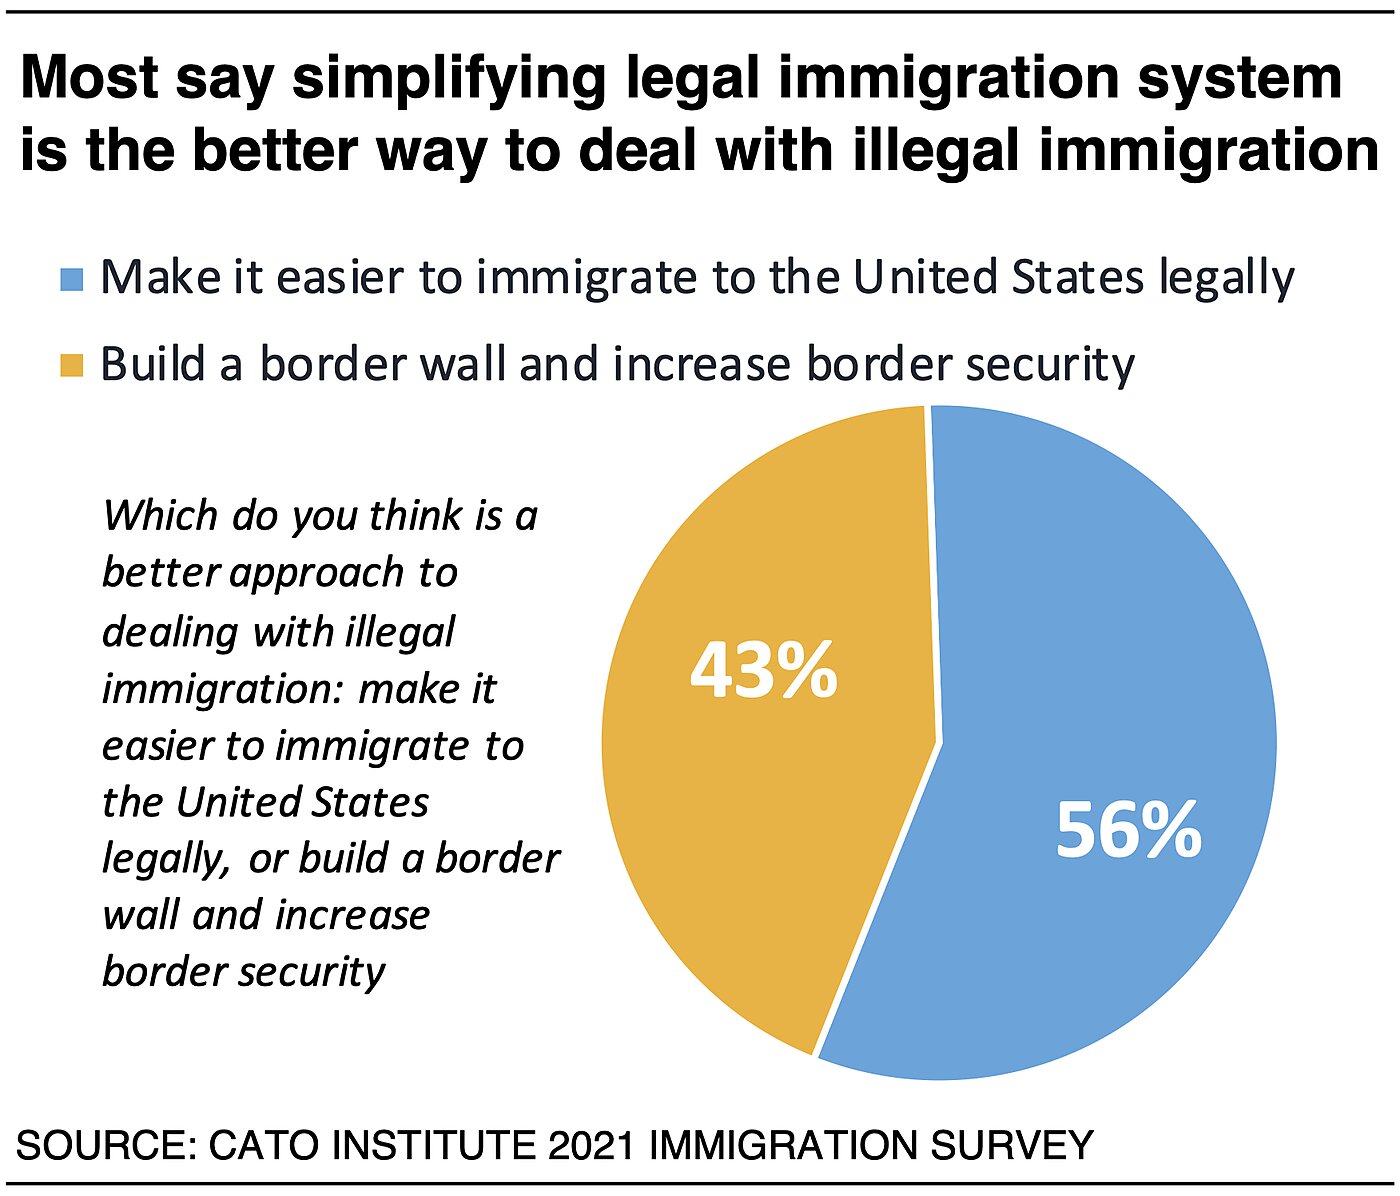
Confidence in the U.S. government’s ability to control who immigrates to the U.S. may contribute to these preferences. Seventy-two percent (72%) of those who believe the government has at least a moderate amount of control over immigration think simplifying the process is the best way to deal with illegal immigration. However, 67% of those who think the government has little to no control think building a border wall is the better option.
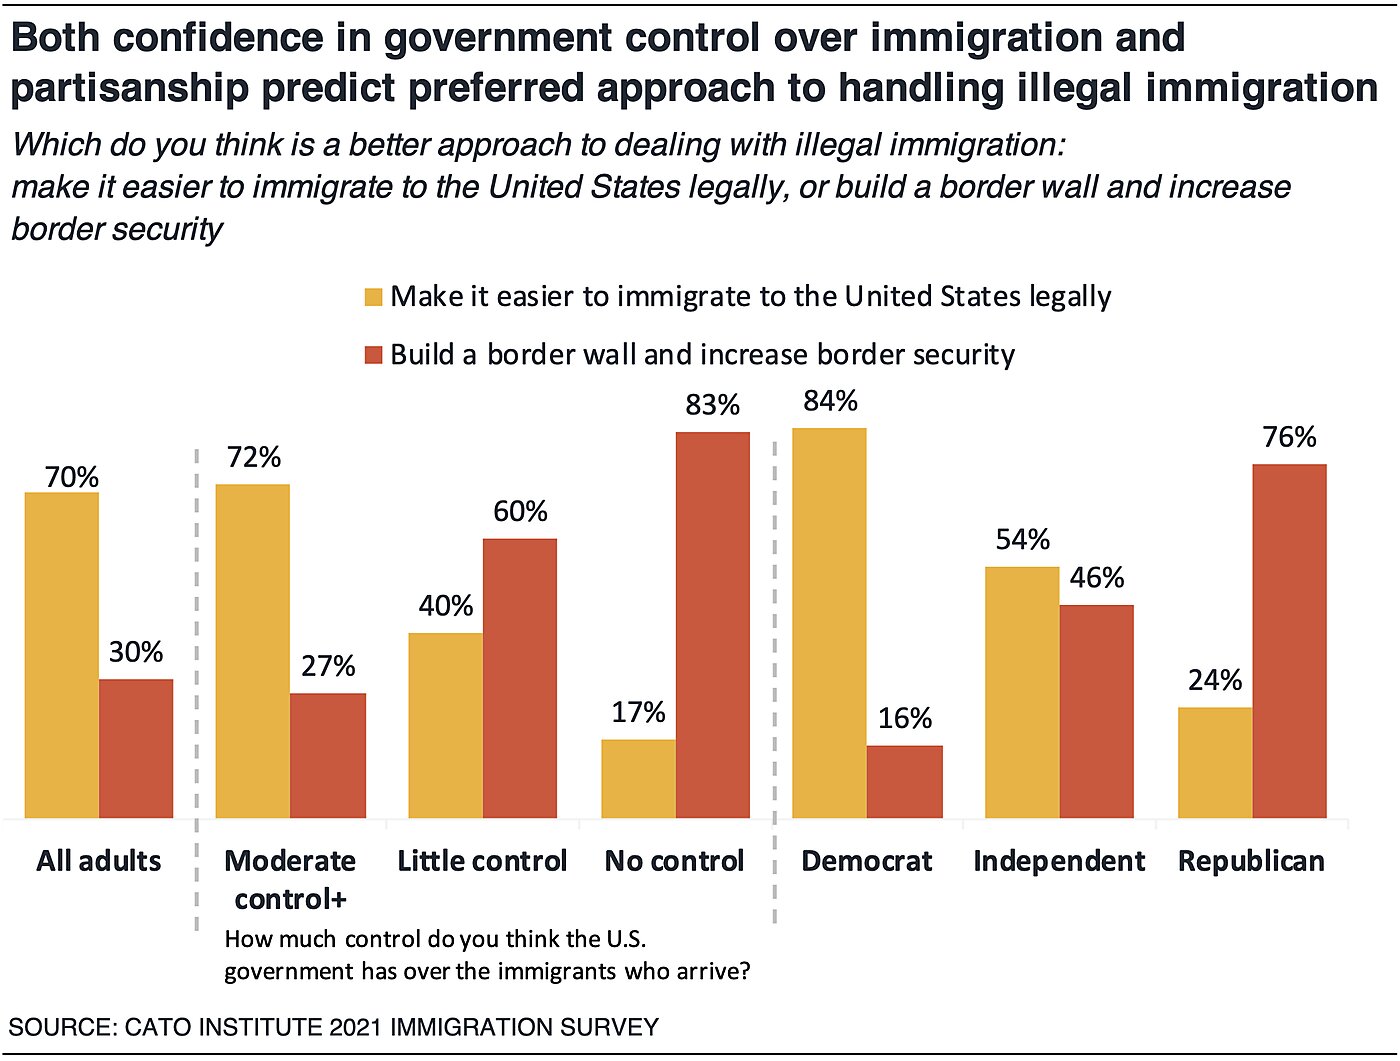
Democrats (84%) and independents (54%) are much more likely to want to simplify the legal immigration process than Republicans (24%). Instead, more than three-fourths (76%) of Republicans prefer increasing border security and erecting a wall.
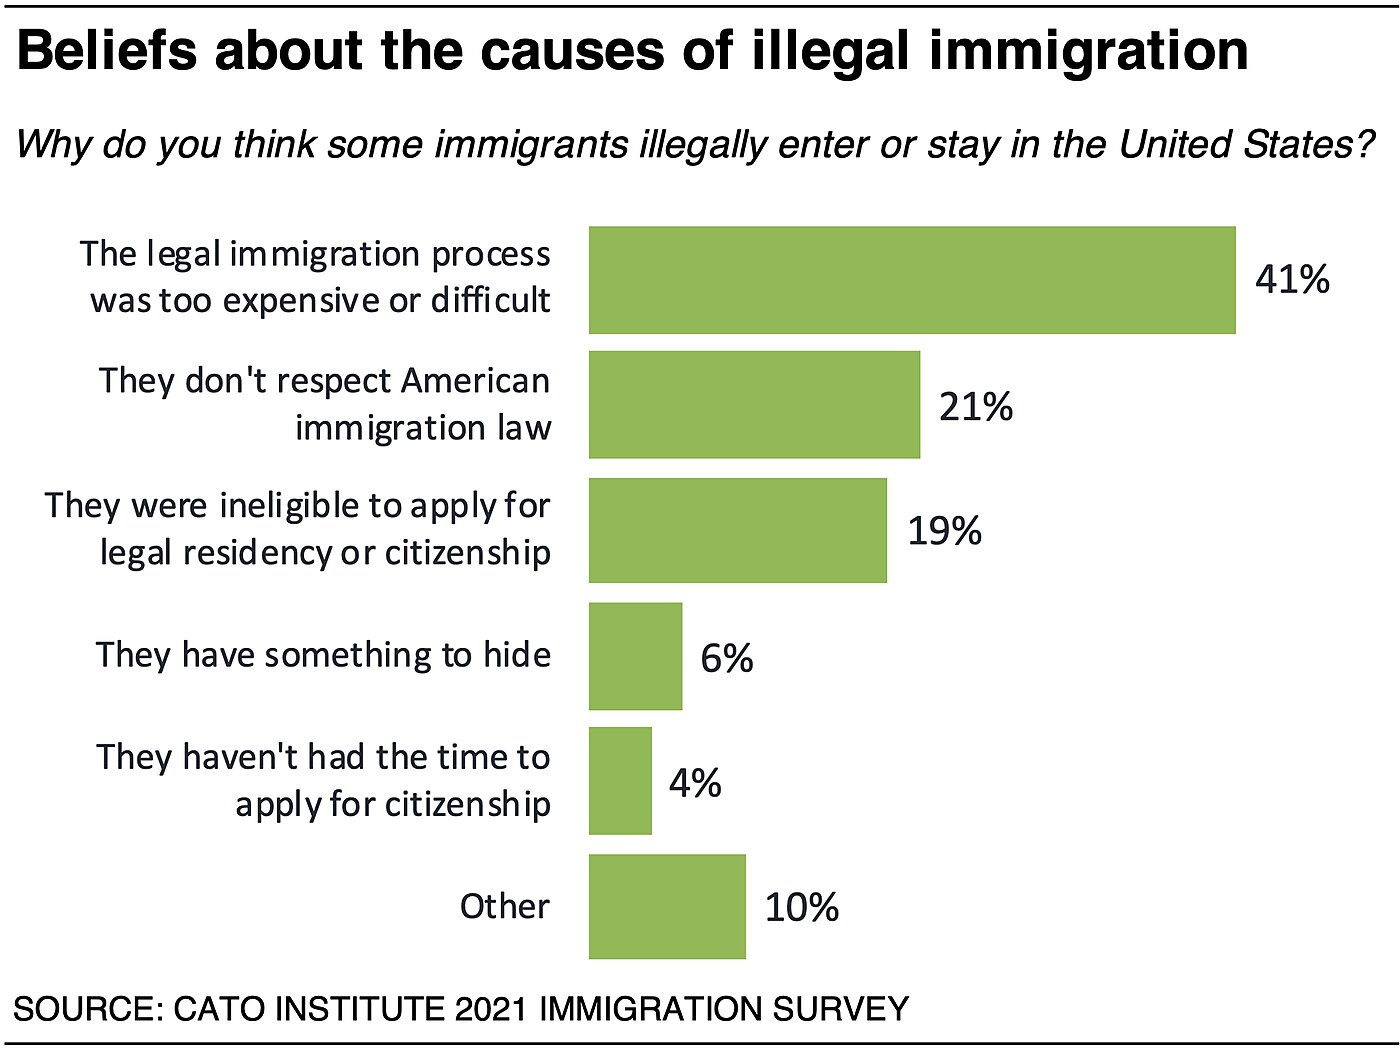
41% Believe Some Immigrants Illegally Enter or Stay in the U.S. Because of the Difficult Legal Immigration Process
A plurality (41%) of Americans believes that immigrants who illegally enter or stay in the U.S. do so because the “legal immigration process was too expensive or difficult.” A fifth (21%) say it’s because they “don’t respect American immigration law,” and another fifth (19%) think it’s because they were “ineligible to apply for legal residency or citizenship.” Few think it’s because unauthorized immigrants have “something to hide” (6%) or because they just “haven’t had the time to apply for citizenship” (4%).
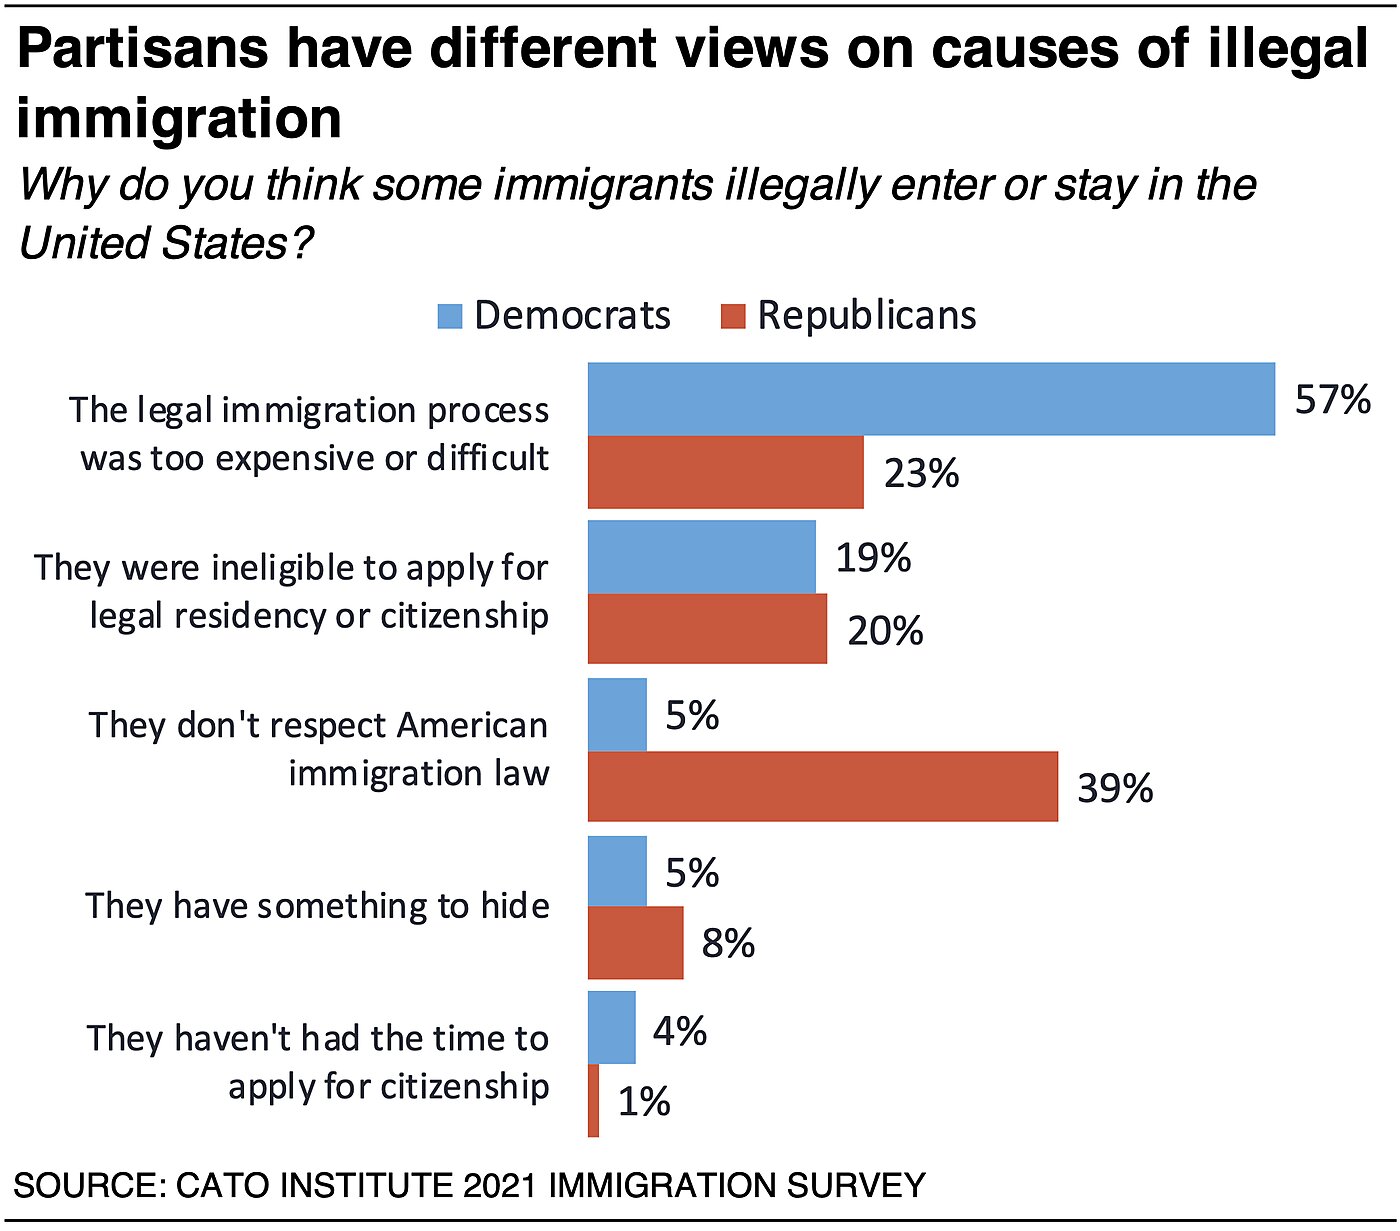
Partisans have different perceptions. Republicans are more likely than Democrats to attribute illegal immigration to nefarious motives. For instance, a plurality (39%) of Republicans thinks some immigrants illegally enter or stay in the U.S. because “they don’t respect American immigration law” compared to 5% of Democrats. Instead, 57% of Democrats think illegal immigration is due to an expensive and difficult legal process, compared to 23% of Republicans. Partisans are about equally likely to think it is due to ineligibility (20% Republicans, 19% Democrats).
Americans Estimate 50% of Latino Immigrants and 29% of Asian Immigrants Are Undocumented
The survey asked respondents to estimate what percentage of Latino immigrants and Asian immigrants, respectively, they believe are in the United States illegally. Americans estimate that 50% of Latino immigrants and 29% of Asian immigrants are in the U.S. illegally.
There aren’t major differences in perceptions among partisans or immigration Restrictionists or Expanders. Instead, opinions differ by immigration background. First-generation immigrants estimate that 60% of Latino immigrants and 41% of Asian immigrants are undocumented. Second-generation immigrants estimate that 52% of Latino immigrants and 35% of Asian immigrants are undocumented. And the third-generation and higher estimate that 49% of Latino immigrants and 26% of Asian immigrants are undocumented.
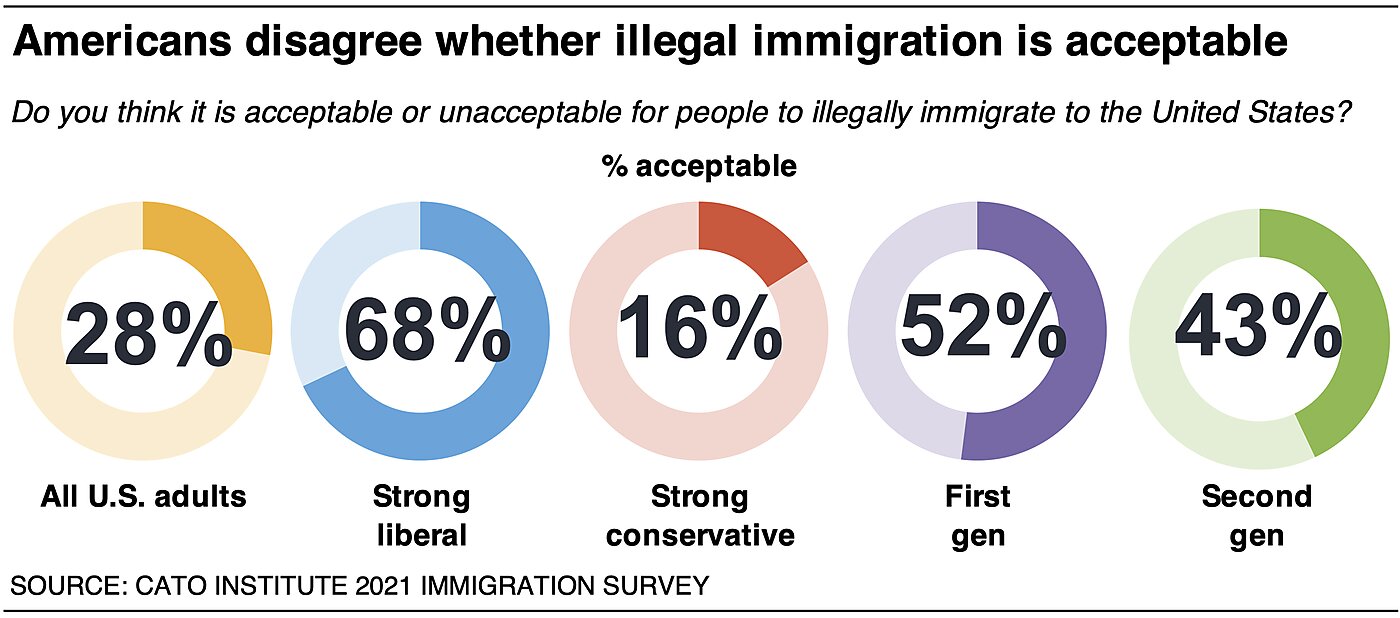
68% of Strong Liberals Say It Is “Acceptable” to Illegally Immigrate to the U.S.
Nearly three-fourths (71%) of Americans say it is “unacceptable” for people to illegally immigrate to the U.S., although most (56%) support making the legal immigration process easier and 55% support providing a pathway to citizenship for the undocumented who are already here.
Strong liberals stand out, however, with 68% who say that illegal immigration is “acceptable.” But this divides the Democratic coalition. A majority (55%) of moderate liberals disagree and say it is “unacceptable.”
First-generation immigrants also have different views. A slim majority (52%) of immigrants believe it is “acceptable” for people to illegally immigrate to the U.S. However, second-generation immigrants disagree (57%), as do 77% of other native-born Americans. The data suggest that first-generation Latino immigrants (68%) and White immigrants (51%) are more likely than Asian immigrants (29%) to believe illegal immigration is acceptable.3 However, caution is needed when interpreting these numbers because the survey was conducted in English and thus misses first-generation immigrants who are not fluent in English whose opinions may differ from those who took the survey.
58% of Republicans Say Children of Undocumented Should Not Attend U.S. Public Schools
Most Americans (64%) believe that the children of unauthorized immigrants should be allowed to attend U.S. public schools, while 36% think they should not. Republicans stand out with 58% saying children of undocumented parents should not be allowed to attend public schools. In contrast, 85% of Democrats and 55% of independents think they should.
61% of Republicans Oppose Birthright Citizenship for Children of Unauthorized Immigrants
A majority (61%) of Americans support granting automatic citizenship to children born in the United States to undocumented parents, as the Constitution grants. Thirty-nine percent (39%) oppose. Republicans stand out, with a majority (61%) who oppose granting birthright citizenship to children of parents who are in the country illegally. In contrast, majorities of Democrats (83%) and independents (53%) support it.
58% of Republicans Support Stripping Citizenship of U.S.-Born Children of Undocumented Parents
A majority (58%) of Republicans support stripping the U.S. citizenship of children of undocumented parents. This is perhaps unsurprising because Republicans view birthright citizenship for children born to parents who are in the country illegally as illegitimate in the first place. Solid majorities of Democrats (78%) and independents (61%) are opposed to doing this.
How Americans Feel toward Immigrants
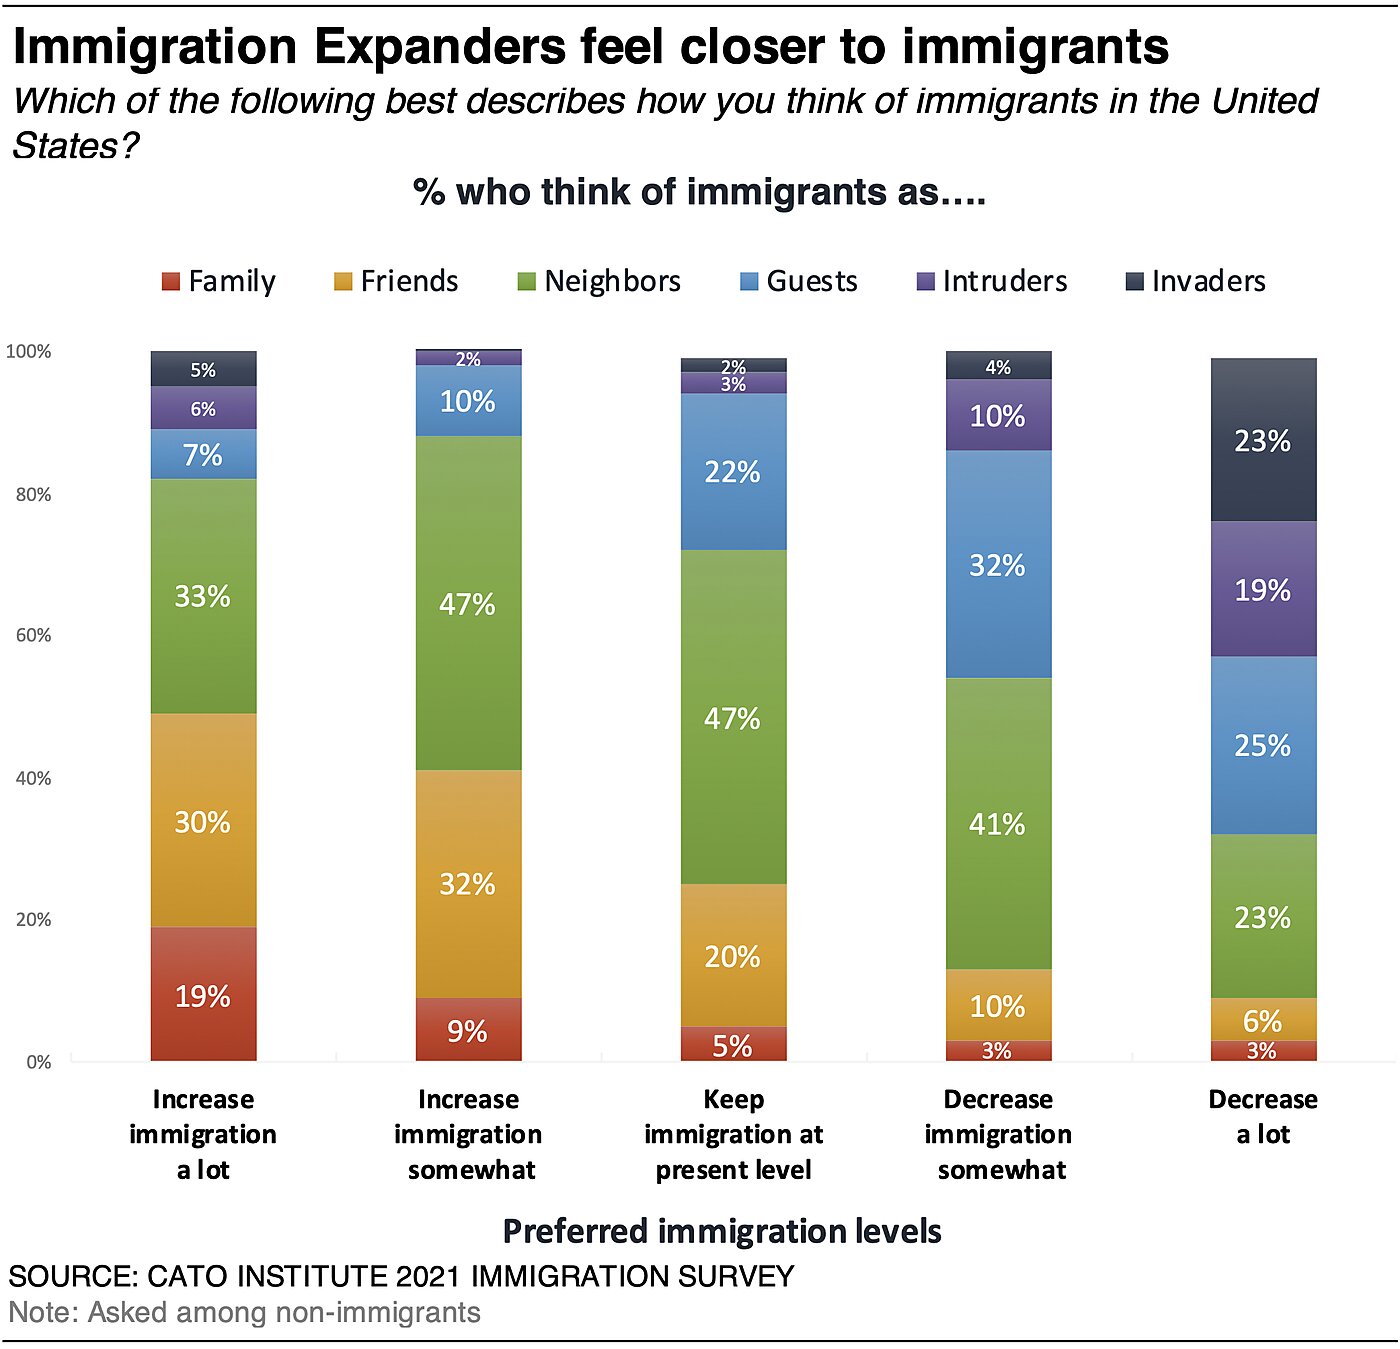
Americans differ in their perceptions of immigrants. When asked which best described how they feel about immigrants in the United States, 6% think of immigrants primarily as “family,” 19% as “friends,” 41% as “neighbors,” 21% as “guests,” 7% as “intruders,” and 6% as “invaders.”
Comparing partisans, Democrats feel closer to immigrants than Republicans do: Democrats are more likely than Republicans to think of immigrants as “family” (8% vs. 4%), “friends” (24% vs. 14%), and “neighbor” (45% vs. 36%). Democrats are less likely than Republicans to think of immigrants as “guests” (16% vs. 25%), “intruders” (3% vs. 10%), or “invaders” (3% vs. 10%).
A similar pattern holds when comparing immigration Restrictionists and Expanders. Expanders are more likely than Restrictionists to think of immigrants as “family” (11% vs. 3%), “friends” (31% vs. 8%), and “neighbors” (43% vs. 32%). Expanders are less likely than Restrictionists to think of immigrants as “guests” (9% vs. 29%), “intruders” (3% vs. 14%), or “invaders” (2% vs. 13%). While few (6%) Americans think of immigrants as “invaders,” one group stands out: among those who want to decrease immigration “a lot,” nearly a quarter (23%) think of immigrants primarily as “invaders.” This is nearly 6 times higher than other immigration Restrictionists, who want to decrease immigration “somewhat.”
69% of Republicans, 52% of Independents Support Deporting an Immigrant Who Dislikes America and Thinks Americans Are Racist
A majority (54%) of Americans say that an immigrant legally residing in the U.S. who “disliked America and said Americans are racist” should be deported, while 46% oppose.
Majorities of first-generation immigrants (53%), regardless of racial background, agree with deportation, as do the third-generation and higher (55%). However, a majority (53%) of second-generation immigrants oppose.
Major partisan differences emerge. Fully 69% of Republicans and 52% of independents favor deporting an immigrant who dislikes America and thinks the country is racist, while 31% and 47% would oppose, respectively. Conversely, 57% of Democrats would oppose, and 42% would support. These differences are starker by ideology. Fully 75% of strong liberals oppose, followed by 67% of liberals, 45% of moderates, and 30% of conservatives.
Section 2: What Americans Think about Immigration Reforms
What Should America Do about Immigration Policy?
66% Say Businesses Should Hire Whoever Is Most Qualified Regardless of Nationality
Two-thirds of Americans (66%) say that businesses should be “allowed to hire whoever they believe is best qualified for the job regardless of nationality.” A third (33%) instead believe that businesses should be required to “give preference to American-born workers.”
Democrats solidly agree (77%) businesses should be allowed to hire whoever they believe is most qualified regardless of nationality. Majorities of independents (60%) and Republicans (56%) also agree, but by smaller margins than among Democrats.
62% Say U.S. Businesses Should Be Allowed to Hire as Many Migrant Workers as Needed to Fill Needed Jobs
Nearly two-thirds (62%) of Americans say that when businesses cannot find enough workers to fill needed jobs, such as in agriculture, farming and construction, they should be allowed to “hire and bring as many migrant workers as needed from other countries.” Thirty-eight percent (38%) oppose.
An overwhelming majority of Democrats (78%) say that businesses should be allowed to hire as many migrant workers as needed. Independents and Republicans have mixed views. Independents favor such hiring by a margin of 52% to 47%. Republicans oppose it by a margin of 47% to 52%.
Support varies by immigration background. Strong majorities of first-generation immigrants (82%) and second-generation immigrants (77%) say businesses should be allowed to hire as many migrant workers as needed to fill open jobs. A majority (56%) of native-born respondents who are not second-generation immigrants also agree but are more than 20 points less likely to do so.
63% Favor Creating New Immigration Visa for Entrepreneurs
Sixty-three percent (63%) of Americans support creating a new type of immigration visa, like a green card, but specifically for entrepreneurs. Thirty-seven percent (37%) oppose.
Support is cross partisan with 70% of Democrats, 61% of Republicans, and 51% of independents who support it. Notably, a majority (53%) of President Trump’s most fervent supporters—those who rated him a 10 out of 10—also support this proposal.
One group stands out in opposition to this proposal: 60% of Americans who want to decrease immigration “a lot” oppose this kind of visa. However, among those who want to decrease immigration “somewhat,” a majority (58%) support it. This indicates that people who want to decrease immigration “a lot” versus “somewhat” may have different reasons for doing so. In this case, lukewarm Restrictionists may be more influenced than stringent Restrictionists by the skill level of new immigrants.
67% of Americans Believe the Legal Immigration Process Is “Fairly Difficult”
More than two-thirds (67%) of Americans believe legally immigrating to the United States is “fairly difficult” while a third (33%) think it’s fairly easy.
Notably, Republicans (49%) are more likely to think the immigration process is “fairly easy” than Democrats (21%) or independents (30%). Republicans also are more likely than Democrats to say there are “too many” immigrants coming from many parts of the world: Latin America: 68% vs. 25%; the Middle East: 58% vs. 22%; Africa: 42% vs. 15%; Asia: 41% vs. 15%; Western Europe 32% vs. 15%; and Eastern Europe: 34% vs. 15%. The Republican view that immigration is “fairly easy” may reflect this concern.
52% of Americans Think the Immigration Process Should Be Faster
Survey respondents were informed that the average immigrant waits about 5 years before being allowed to move to the U.S. Then they were asked how many years they think it should take. A majority (52%) say it should take less than 5 years. About a quarter (28%) want to maintain the status quo of 5 years, and a fifth (20%) think it should take more than 5 years.
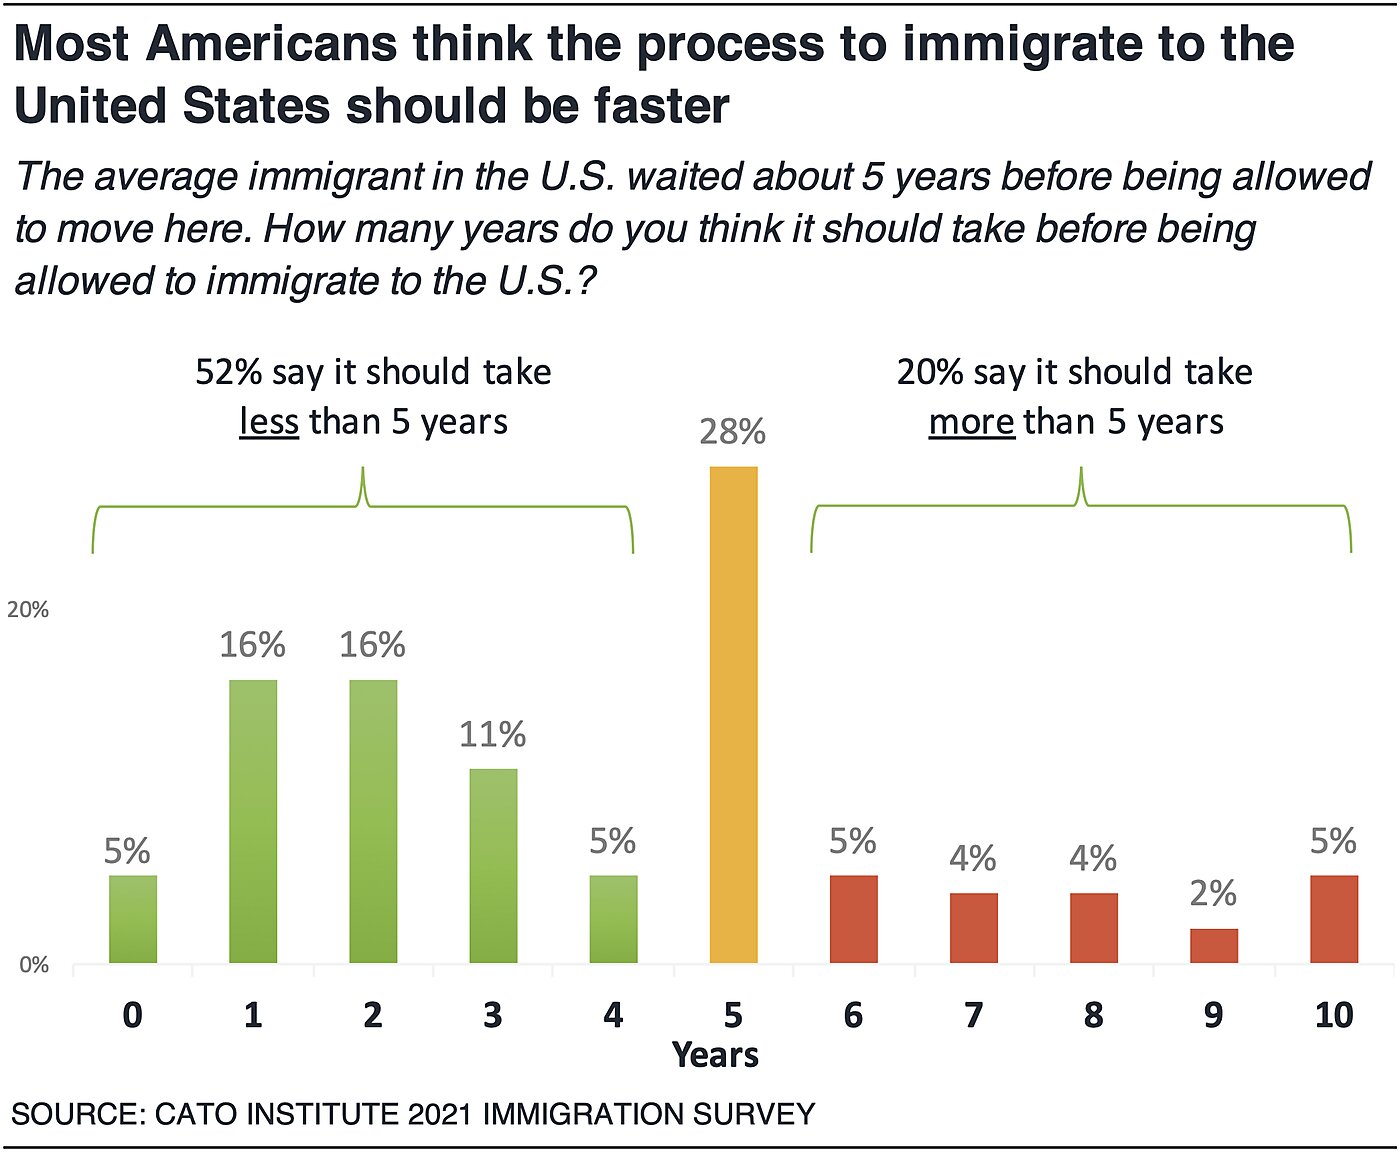
Nearly two-thirds of Democrats (63%) believe the process should take less than 5 years, as well as pluralities of independents (48%) and Republicans (40%). There is little partisan disagreement about the process’s taking more than five years. Twenty-three percent (23%) of Republicans and independents and 18% of Democrats think the process should take longer than it currently does. Most Democrats and Republicans may agree that eligible immigrants should not have to wait more than 5 years to move to the U.S., but they may disagree about how many or which immigrants should be eligible in the first place.
59% of Republicans Say Voting on Immigration Levels and Origins Should Be Up to Voters
Research conducted before the survey’s fielding revealed that many immigration Restrictionists felt voters had “no say” in the country’s immigration policies. To more closely examine this concern, the survey asked respondents if they thought voters should be able to vote directly on immigration policy, much like a state ballot initiative.
Americans lean against such direct voting. Nearly half (47%) think voters should be able to vote on “how many immigrants are allowed to move to the United States each year and from which countries.” However, a majority (53%) say this “shouldn’t be up to voters.”
Significant partisan differences exist. Fifty-nine percent (59%) of Republicans say citizens should be able to directly vote on immigration levels and origins. However, two-thirds (65%) of Democrats disagree. Independents are evenly divided.
The more one wants to restrict immigration, the more one favors direct voting on the issue. Fully 72% of those who want to decrease immigration “a lot” want voters to be allowed to vote on immigration levels and origins; this declines to 56% among those who want to decrease it “somewhat,” 42% among those who want to keep immigration the same, and 35% among those who want to increase immigration.
56% Say Simplifying Legal Immigration Process Is a Better Way to Deal with Illegal Immigration
When asked to choose a better approach for dealing with illegal immigration, a majority (56%) think it’s better to make the legal immigration process easier. Forty-three percent (43%) would prefer to build a border wall and increase border security.
Confidence in the U.S. government’s ability to control who immigrates to the U.S. may contribute to these preferences. Seventy-two (72%) of those who believe the government has at least a moderate amount of control over who arrives think simplifying the process is the best way to deal with illegal immigration. However, 67% of those who think the government has little to no control think building a border wall is the better option.
Democrats (84%) and independents (54%) are much more likely to want to simplify the legal immigration process than Republicans (24%). Instead, more than three-fourths (76%) of Republicans prefer increasing border security and erecting a wall.
Most Think the Immigration System Should Give Equal Preference to High-Skilled Workers and U.S. Relatives
According to the Public Policy Institute of California, most first-generation immigrants granted green cards are admitted because they have family members who are U.S. citizens or green-card holders. Few (about 1 in 10) are admitted based on employment criteria or skill.
However, few (14%) Americans think preferences should be given to family members over high-skilled workers. Instead, a majority (58%) of Americans say equal preference should be given to both immigrants with high-level skills and those who have family members already living in the U.S. And about a quarter (28%) think preference should be given to those with high skill levels.
Similarly, only 11% of Americans think the U.S. immigration system should prefer “culturally similar” immigrants over high-skilled immigrants. Instead, a majority (55%) think equal preference should be given to both, and a third (33%) think preference should be given to high-skilled workers.
Republicans are more inclined to favor high-skilled immigrants over family members of U.S. residents or “culturally similar” immigrants. Forty percent (40%) of Republicans would give preference to high-skilled workers over those with U.S. family members (9%). Similarly, 39% of Republicans would prefer high-skilled workers over “culturally similar” immigrants (12%). But most Republicans in both cases say equal preference should be given to both high-skilled workers and U.S. family members (51%) or high-skilled workers and “culturally similar” immigrants (48%).
Democrats are less likely to think the immigration system should give priority to high-skilled workers. Nineteen percent (19%) would give preference to highly skilled immigrants over immigrants with U.S. family members (17%). Most would give both groups equal preference (64%). Somewhat more Democrats give priority to high-skilled workers (30%) over “culturally similar” immigrants (11%), but most (59%) want both to be given equal preference.
3 in 10 Support Allowing Immigrants to Buy Entry to U.S. for $10,000
Americans oppose a proposal to allow immigrants to buy entry into the United States that would allow them to live and work but would not directly lead to citizenship. Seven in 10 oppose the proposal regardless of whether the fee charged were $10,000 or $50,000 per entry. The fact that the public does not distinguish between these prices shows that opposition may have more to do with the principle of buying entry or that for some, the prices may be too low.
First-generation (46%) and second-generation (45%) immigrants are more likely to support a $10,000 purchased entry than native-born Americans (25%) who are not second-generation immigrants.
Interestingly both Democrats (69%) and Republicans (72%) are opposed to buying entry into the country. Libertarians stand out as one of the few groups with a majority (53%) who support this proposal.
What Americans Think about Welfare and Immigration
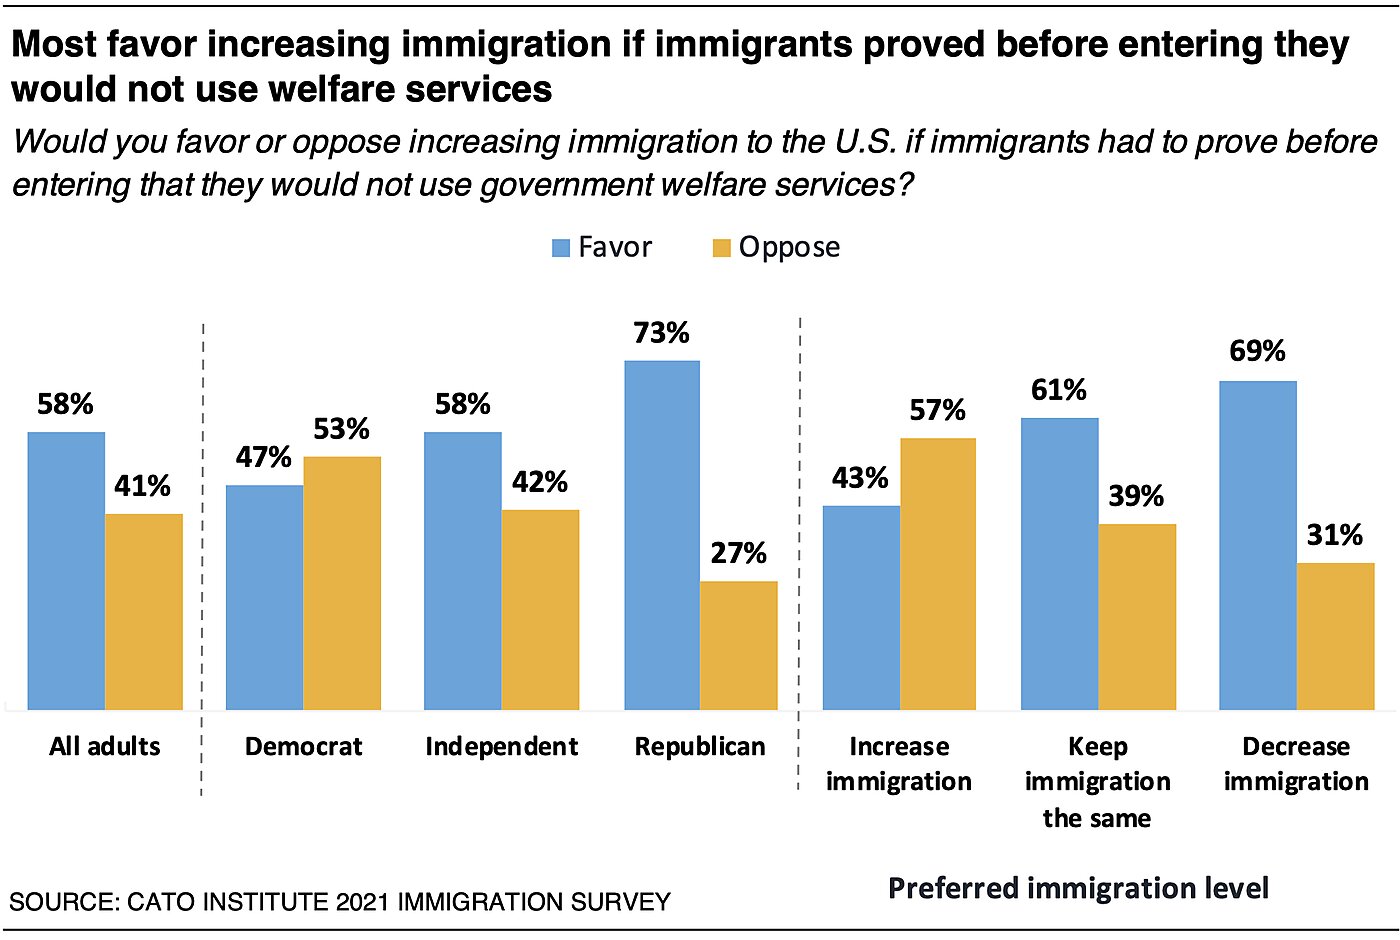
58% Favor Increasing Immigration If Immigrants Proved They Won’t Use Government Assistance
A majority (58%) of Americans would support increasing immigration to the U.S. if immigrants had to prove before entering that they would not use government welfare services; 41% oppose. Majorities of first-generation immigrants (67%), second-generation immigrants (53%), and native-born Americans (58%) who are not second-generation immigrants support the proposal.
However, a majority of Democrats (53%), especially strong liberals (75%), oppose the proposal. Conversely, nearly three-fourths (73%) of Republicans and 58% of independents support it. Notably, 69% of immigration Restrictionists and 61% of Maintainers would support increasing immigration if immigrants had to prove they would not use government assistance. Immigration Expanders, oppose this proposal 57% to 43%.
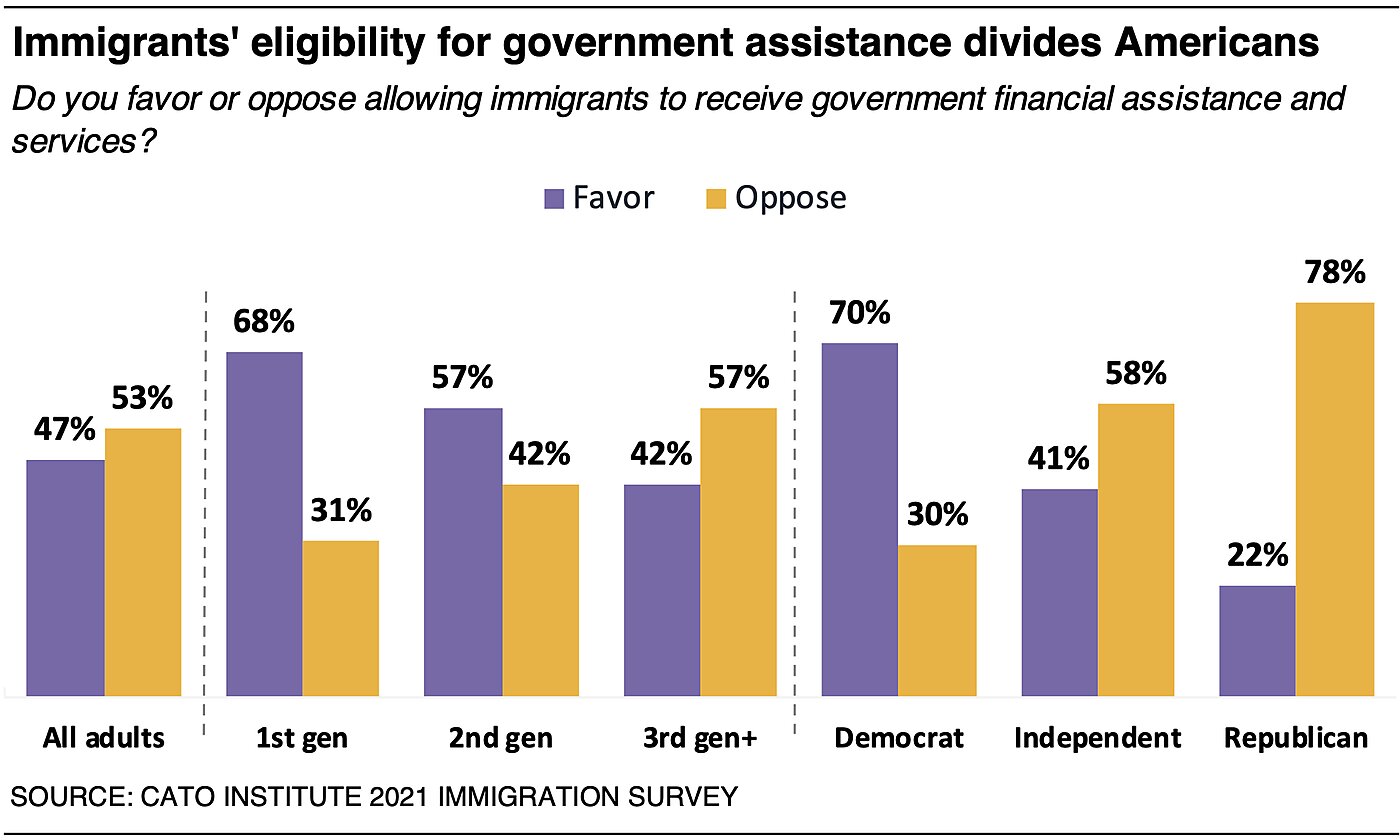
53% Oppose Allowing Immigrants to Receive Government Financial Assistance
A majority (53%) of Americans oppose allowing immigrants to receive government financial assistance and services. However, nearly as many (47%) agree that they should be eligible.
First-generation (68%) and second-generation (57%) immigrants are most supportive of allowing immigrants to receive welfare benefits. However, 42% of native-born Americans who are not second-generation immigrants agree; instead, a majority (57%) oppose.
A solid majority (70%) of Democrats favor allowing immigrants to receive financial assistance and services from the government, while 30% oppose. In contrast, majorities of independents (58%) and Republicans (78%) oppose (while 41% and 22% support, respectively). Opinions vary strikingly by ideology. Fully 90% of staunch liberals support allowing immigrants to be eligible for welfare benefits (including 55% who strongly favor). In contrast, 78% of staunch conservatives oppose (including 53% who strongly oppose).
There’s racial divide as well. A majority (60%) of White Americans oppose offering government assistance to immigrants. In contrast, majorities of Black Americans (64%), Latino Americans (61%), and Asian American (61%) support doing so. Some of this divide may be due to differences in immigration background. Among first-generation immigrants, majorities of White (63%), Latino (76%), and Asian (68%) immigrants support being allowed to receive welfare. This declines somewhat among the second generation such that a majority of White second-generation immigrants oppose (56%) and majorities of second-generation Latino (70%) and Asian (59%) immigrants support. However, majorities oppose among White (61%), Latino (57%), and Asian (52%) native-born Americans who are not second-generation immigrants. (The share of Black immigrants in the sample was too small to calculate and compare responses.)
Why Americans Oppose Welfare Services for Immigrants
Why do Americans oppose allowing immigrants to receive government financial assistance and services? We asked them. Fifty-seven percent (57%) said they oppose such assistance primarily because they believe it would raise the taxes of American-born citizens. Forty-three percent (43%) oppose primarily because they feel it would reduce the government assistance available to American-born citizens.
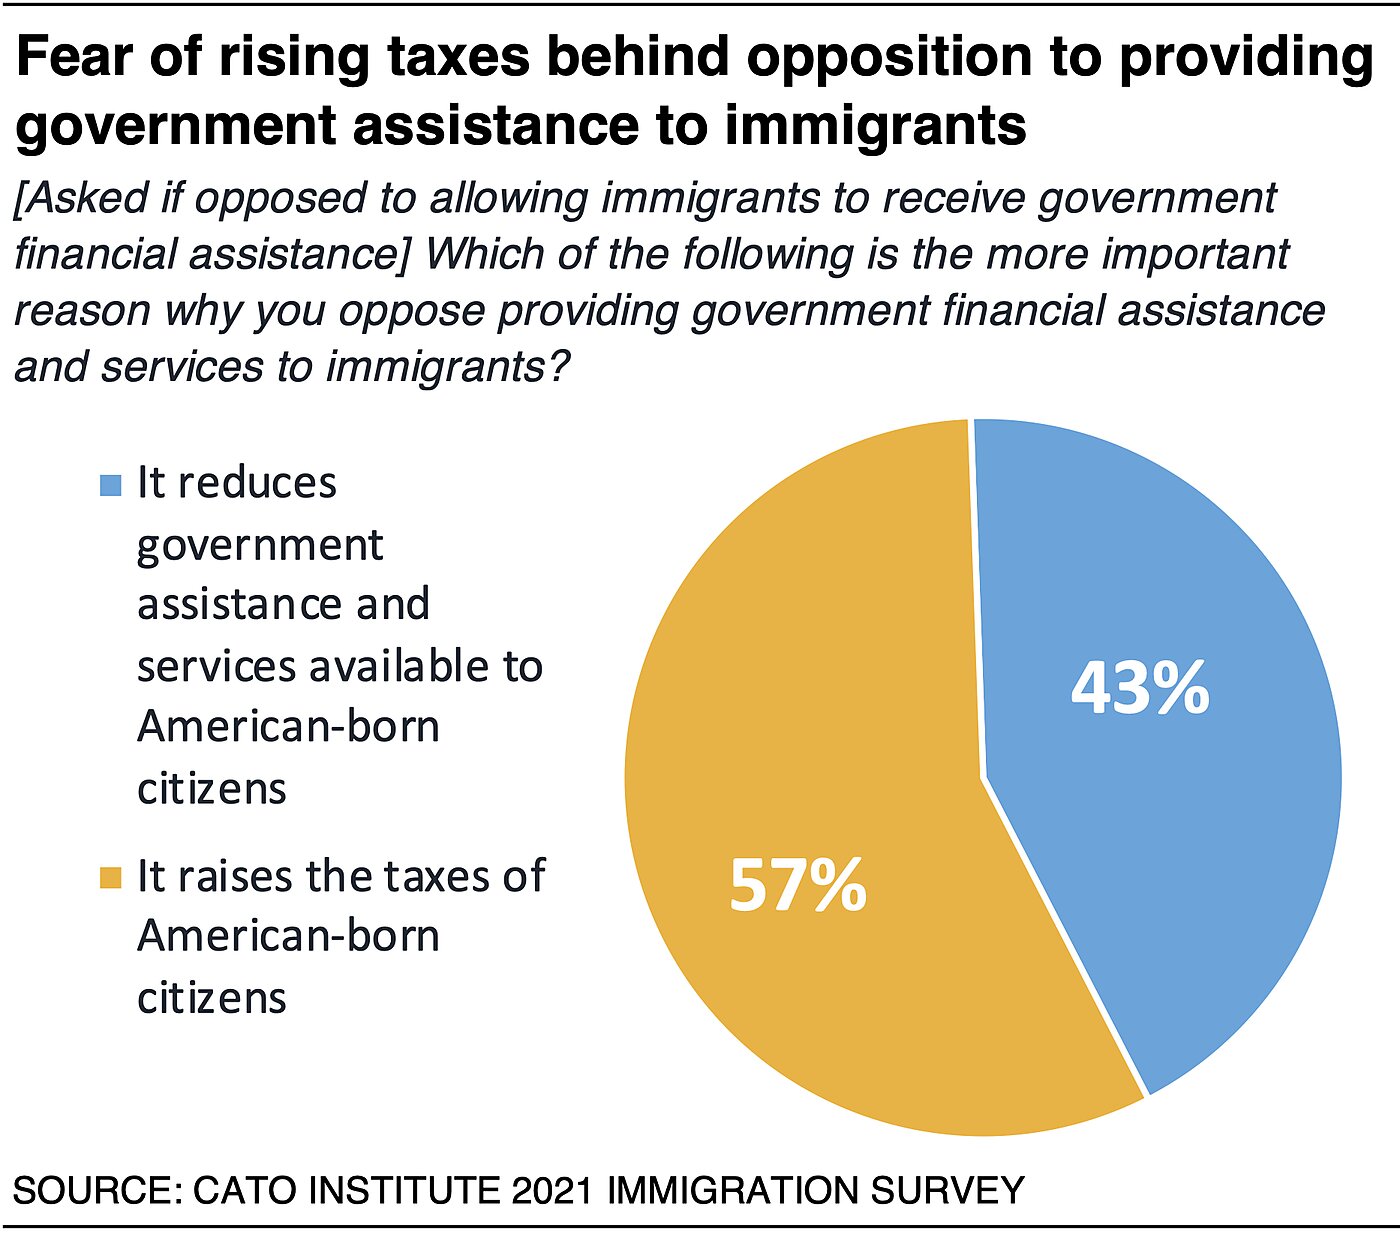
Democrats and Republicans who oppose offering government financial assistance to immigrants have different reasons for doing so. Among Democrats, a majority (52%) see such assistance as reducing the government services that are available to American-born citizens. In contrast, majorities of Republicans (62%) and independents (56%) oppose because they worry it will increase taxes.
57% Believe Most Immigrants Receive Some Form of Government Financial Assistance
A majority of Americans believe most immigrants receive some form of means-tested government welfare assistance. This finding stands regardless of whether the question asks about immigrants specifically (57%) or about immigrant households (54%).
The survey randomly divided respondents into two groups. The first group was asked to estimate about how many immigrants receive some form of means-tested welfare assistance. Among this group 57% estimated that half or more of immigrants receive assistance. The second group was asked how many immigrant households they estimate receive some form of assistance: 54% said half or more. Given the margin of error of the two samples, these responses are statistically equivalent.
This demonstrates that most Americans do not distinguish between immigrants who may receive government assistance and immigrants’ U.S.-born dependent children who may receive assistance. While U.S.-born children are not immigrants, because the assistance is going to an immigrant household, others may perceive this as immigrants’ receiving welfare benefits. This matters because immigration researchers differ in how they measure actual welfare use. For instance, Cato Institute researchers have found that first-generation immigrants use less welfare than native-born Americans. However, researchers at the Center for Immigration Studies found that noncitizen households (which include U.S.-born dependent children) receive government assistance at higher rates than other households. Public opinion may reflect welfare use by households, rather than individuals.
Regardless of immigration background, Americans are about equally likely to perceive that half or more of immigrant households receive some form of government assistance: 56% of the first-generation, 57% of the second-generation, and 54% of the third-generation and higher.
Republicans (78%) and independents (59%) are much more likely than Democrats (40%) to believe half or more of immigrants receive some form of means-tested assistance.
72% Say Immigrants Come to America to Find Jobs and Improve Their Lives
Nearly three-fourths (72%) of Americans believe immigrants come to the U.S. primarily to “find jobs and improve their lives” and 27% say to “obtain government services and welfare benefits.”
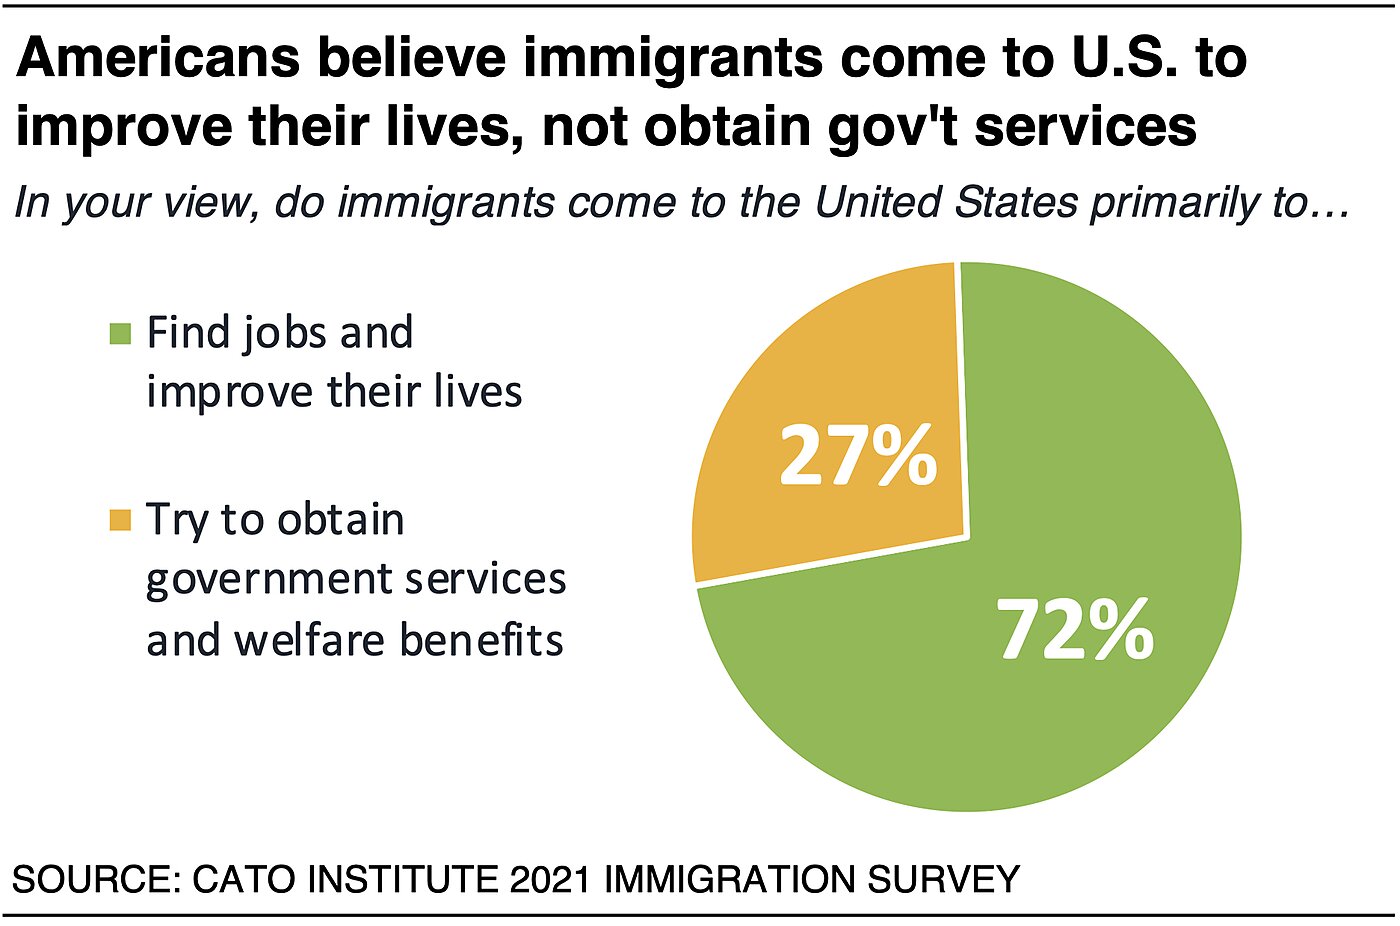
Immigrants (71%) and non-immigrants (73%) alike agree that hope for a better life is the reason people move to the U.S. Majorities of partisans also agree including 86% of Democrats, 71% of independents, and 57% of Republicans. Although a majority of Republicans agree, they are much more likely than Democrats to believe immigrants come primarily to obtain government services and assistance (42% vs. 14%). Hard-core Restrictionists (who want to decrease immigration “a lot”) stand out, with a majority (57%) who perceive that immigrants come to obtain government services rather than jobs. However, a majority (61%) of lukewarm Restrictionists (who want to decrease immigration “somewhat”) think the real reason immigrants come is hope for a better life.
60% of Immigrants Say Immigrants Should Make Their Own Way
Majorities of both first-generation immigrants (60%), second-generation immigrants (55%), and the third-generation and higher (65%) believe that immigrants should “make their own way without government assistance.” About a third (36%) believe that government should provide immigrants “with the things that they need.”
Attitudes have more to do with political ideology than immigration background. A majority of Democrats (54%) believe that the government should provide immigrants with the things that they need. In contrast, majorities of independents (62%) and Republicans (86%) think immigrants should make their own way without government assistance. Majorities of White (69%), Latino (56%), and Asian (53%) Americans believe immigrants should make their own way, while a majority (59%) of Black Americans believe government should provide for needs.
Section 3: Why Americans Think What They Do about Immigration
Why Don’t More People Support More Immigration?
Many economists across the political spectrum argue that immigration greatly benefits a country’s economy and therefore it should be expanded. Nevertheless, survey research shows that most Americans want to keep immigration levels the same or lowered. For this reason, the survey report pays careful attention to understanding why many Americans are reluctant to expand immigration. Pre-fielding interviews and research identified a variety of potential explanations that were included on the survey and analyzed in this section. Here we seek to understand the complex attitudes Americans have toward immigration by examining proposed theories for why people welcome or oppose more immigration.
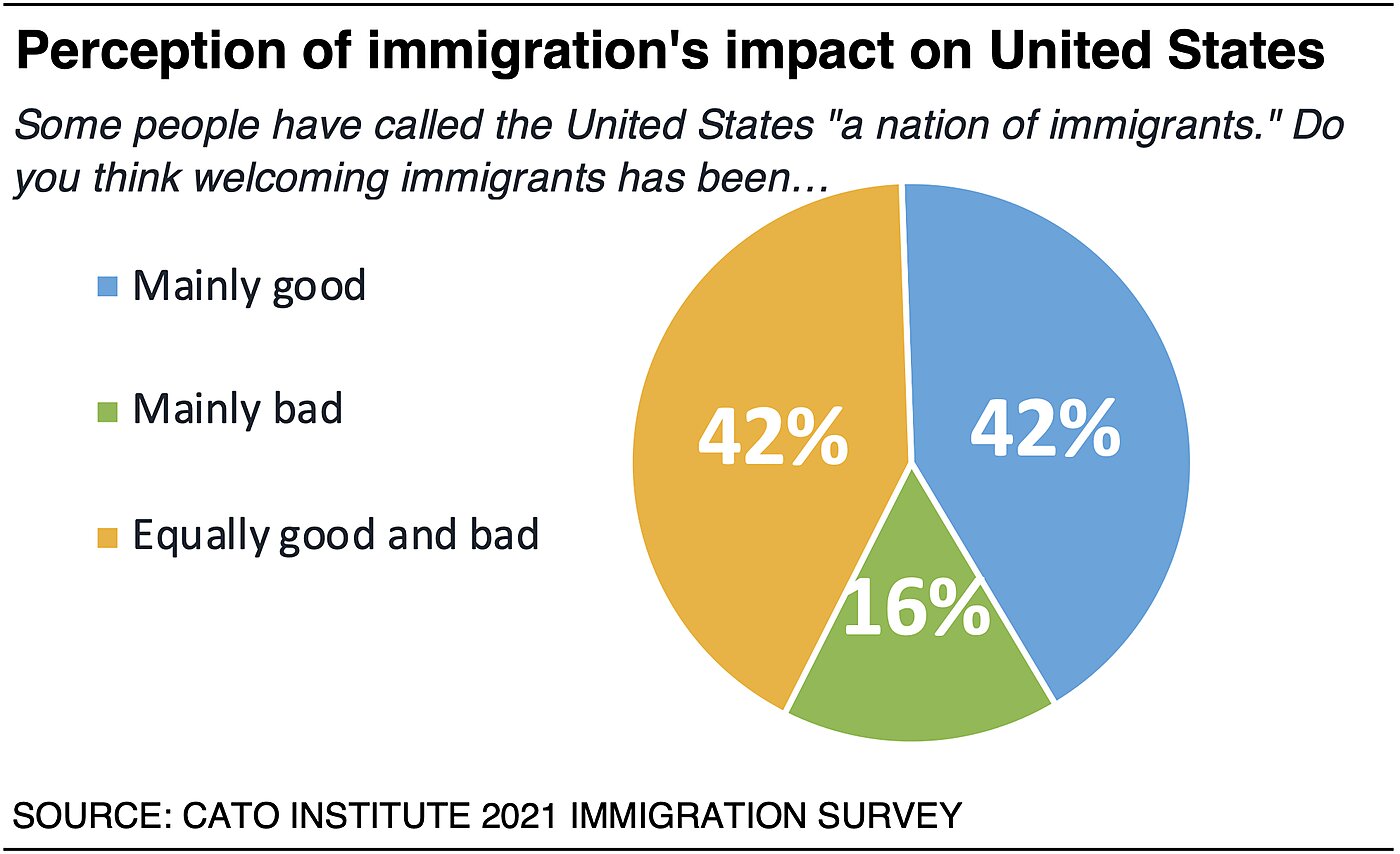
42% Say Immigration Has Been “Mainly Good” for the U.S.; 42% Say It’s Both Good and Bad
Few Americans want to shut down the border outright. But there isn’t widespread support for increasing immigration either. Americans appear to have mixed feelings about immigration because many perceive both benefits and costs associated with it. Part of the reason may be that while 42% of Americans say immigration has been “mainly good” for America, another 42% say it has been “equally good and bad.” Notably, only 16% say it has been “mainly bad.” So what do Americans believe are the benefits and costs?
Americans Believe Immigration Brings Many Benefits
- 72% say immigrants come to improve their lives, not obtain government services
- 69% say immigration over time contributes to more economic growth
- 67% have positive views of immigrants
- 61% say immigration enriches American culture and values
- 58% say immigrants strengthen our country because of their hard work and talents
- 49% say immigration increases diversity of thought
- 48% agree the U.S. needs immigration to remain competitive in the global economy
- 48% say immigration enriches U.S. culture with new customs and food
- 46% say immigrants tend to be more entrepreneurial and start businesses
- 41% say immigration grows the economy
Americans Believe Immigration Brings Many Benefits to the U.S.
The public believes most immigrants come to the U.S. to improve their lives (72%). Only 27% believe immigrants come to obtain government services and welfare. And majorities of Democrats (86%) and Republicans (57%) agree that improving their lives motivates immigrants.
Most believe immigrants enrich American culture and values (61%), as do a majority of Democrats (79%) and pluralities of independents (49%) and Republicans (43%). Most (58%) also perceive immigrants as strengthening the country with hard work and talent, including an overwhelming majority of Democrats (81%), as well as 45% of independents and 35% of Republicans.
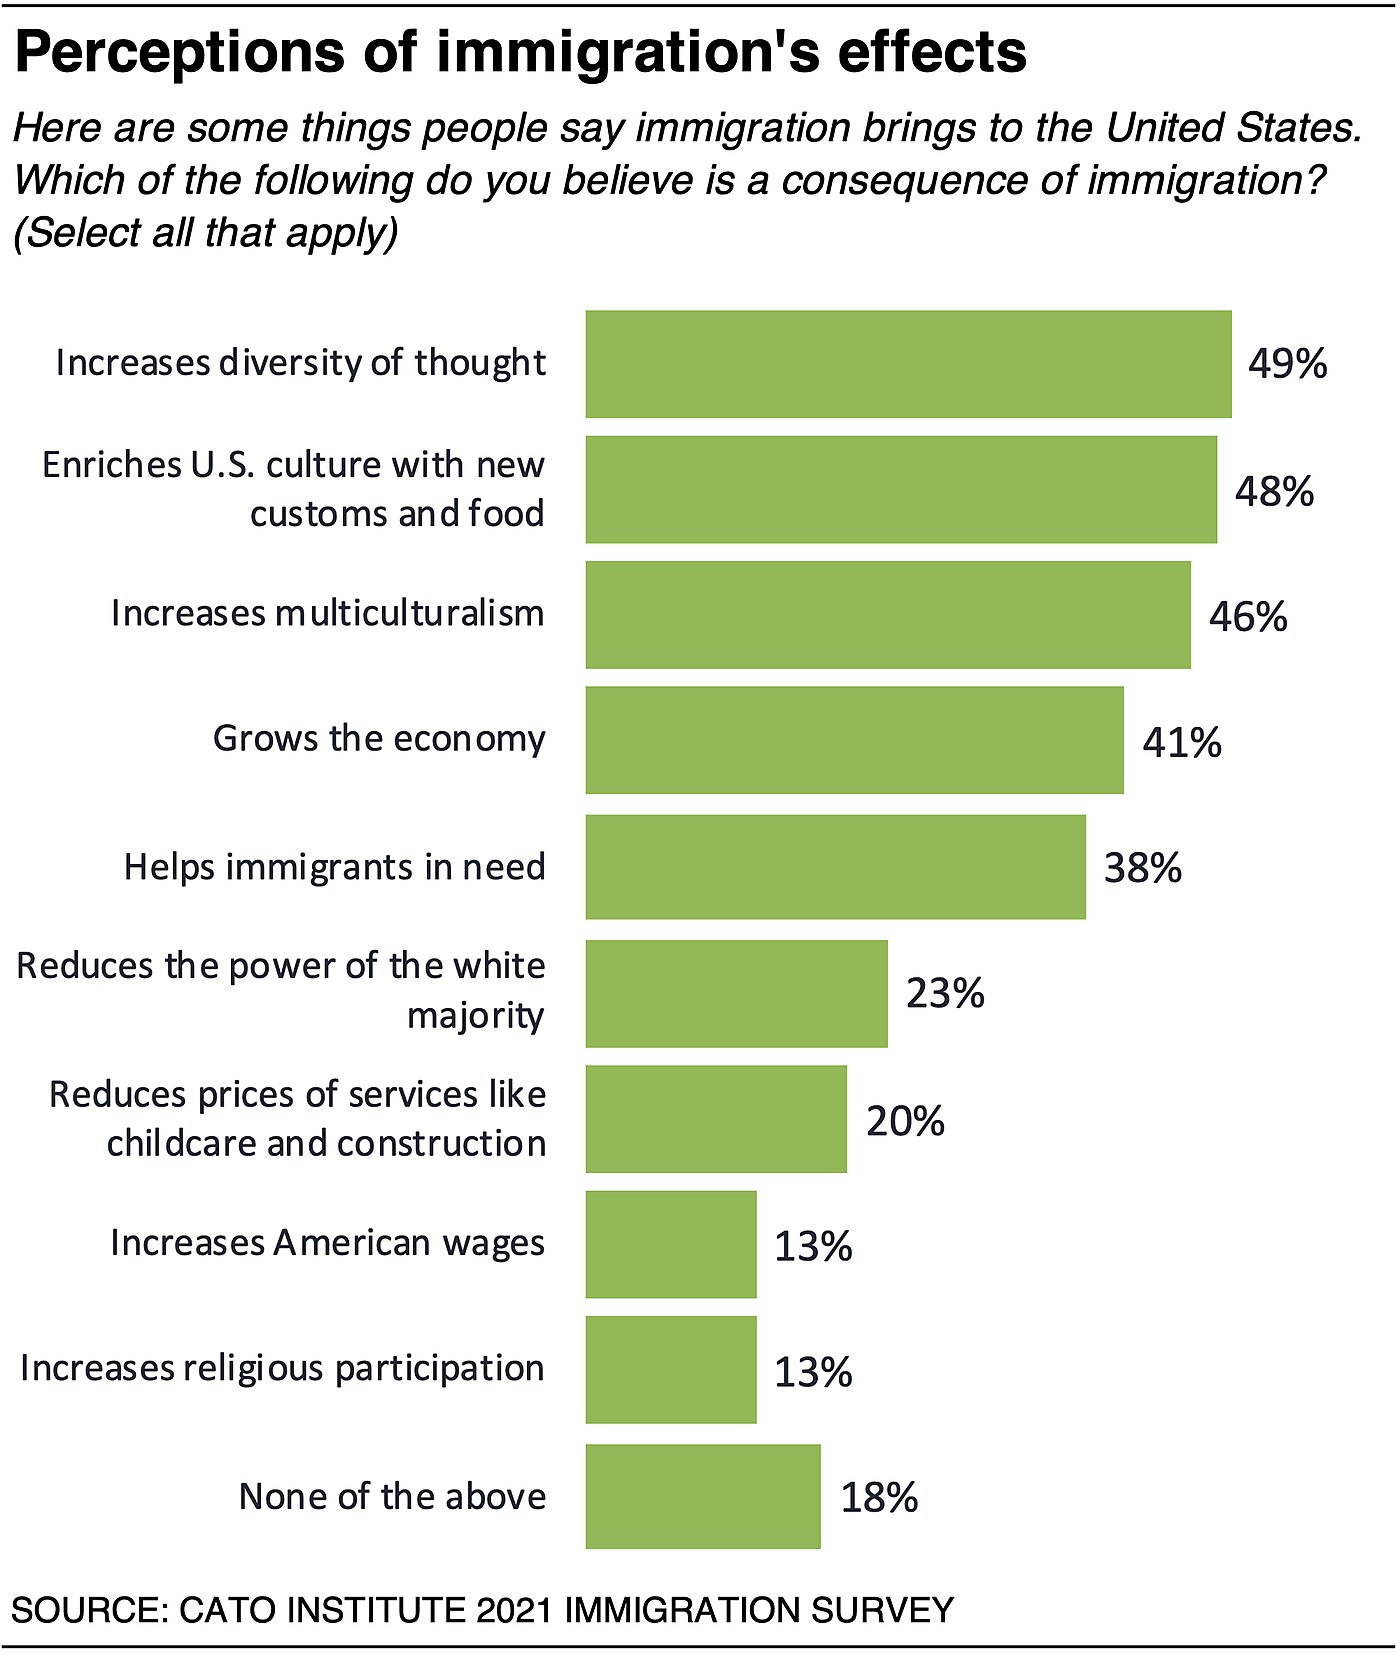
Nearly half of Americans also believe immigration increases the diversity of thought (49%), brings delicious new foods (48%), and grows the economy (41%). Democrats are even more likely to think immigration improves viewpoint diversity (64%), food (64%), and the economy (61%). More than a third of Republicans and independents agree immigration improves diversity of thought (35%, 39%) and cuisine (34%, 40%). Only 21% of Republicans think immigration helps the economy; 34% of independents agree.
Smaller shares of Americans perceive other benefits of immigration such as helping immigrants in need (38%) or reducing the prices of services like childcare and construction (20%). Few think immigration increases American wages (13%).
Some Americans Have Fears about Immigration
Given the many advantages Americans associate with immigration why do only 29% want to increase it and a third (33%) want to decrease it? This next section will investigate the fears some Americans associate with immigration. We asked about a wide range of potential fears that were raised during pre-survey interviews and research to allow researchers to dig deeper to examine what fears might matter most and for which individuals.
Some Americans’ Potential Fears of Immigration
- 59% worry immigration could lead to too many demands on government services
- 55% say discrimination against White Americans could happen over time (asked among non-immigrant White Americans)
- 55% worry immigration could lead to less social cohesion and national unity
- 51% worry immigration over time could reduce jobs available
- 51% believe that unauthorized immigrants vote in elections
- 47% worry immigration increases the risk of terrorism a lot or somewhat
- 41% of White Americans worry immigration will cause them to become a minority in the U.S.
- 39% say immigrants today come from cultures different from previous immigrants and have more trouble assimilating
- 33% worry they will “no longer feel at home” in the country if immigration increases
- 34% worry immigration reduces wages
- A third worry immigration burdens public schools (33%) and increases crime (33%)
- 32% say they feel uncomfortable when they hear people speaking a language other than English in public places
- 29% say they are “worried” immigrants are “replacing America’s ethnic background”
- 28% worry immigration will “change American culture”
- 27% worry immigration raises costs of housing and health care
There are five primary types of concerns Americans expressed about immigration: (1) economic, (2) cultural, (3) racial or ethno-cultural, (4) crime- and violence-related, and (5) political.
Economic
Nearly 6 in 10 Americans (59%) are concerned that immigration over time could lead to “too many demands on government services.” A majority (51%) also fear that immigration over time could reduce the jobs available for everyone. About half (42%) believe that immigration currently “burdens government welfare programs.” Concerns about welfare use come in two forms. Among those opposed to providing government assistance to immigrants, 57% oppose it because they worry it will raise their taxes. But a sizeable share (43%) oppose it because they worry fewer government services will be available to American-born citizens.
Aside from concern about welfare services, about a third of Americans worry that immigration could reduce wages and jobs for Americans (34%) and burden public schools (33%), and 27% worry it increases the cost of housing and health care.
Immigration Restrictionists are far more concerned about these issues. Eighty-five percent (85%) worry that immigration over time will lead to too many demands on government services, and 71% worry that it eventually it could reduce jobs available for everyone. Seventy-one percent (71%) also worry that immigration today burdens government welfare programs, 63% think it reduces wages, and 59% think it burdens public schools.
Conversely, far fewer immigration Expanders have these economic concerns. About a third say immigration could lead to too many demands on government services (34%) or reduce jobs (31%). Few think immigration burdens government welfare programs (15%), or reduces wages (10%), or burdens public schools (13%).
Cultural
Half of Americans (50%) perceive that immigrants have “retained their own cultures and values,” and 50% perceive they “adopted essential American culture when they got here.” However, a majority (59%) say they prefer a country in which most people share an “essential American culture.” These numbers are akin to the 55% who worry that immigration over time could cause there to be “less social cohesion and national unity.” Forty-five percent (45%) are not concerned about cohesion.
Immigration Restrictionists are more likely (71%) to perceive that immigrants over the past 20 years have largely retained their own cultures and values, while 83% of Restrictionists prefer a country with a shared culture and values. Also consistent with these numbers, 78% of Restrictionists worry about societal unity and cohesion. Immigration Expanders view things differently: 70% perceive immigrants have adopted “essential American culture.” But Expanders don’t worry too much about that to begin with, because most (60%) prefer a “country made up of many different cultures and values that change as new people arrive” as opposed to wanting a shared essential culture (40%).
A little more than a third (39%) of Americans also perceive that immigrants “come from cultures very different than previous immigrants’” and “have more trouble assimilating to the American way of life.” About a quarter (29%) disagree and another third (32%) don’t have an opinion either way. A majority (51%) of immigration Restrictionists perceive, in contrast to 31% of Expanders, that recent immigration differs from immigration in the past.
About a third (32%) of respondents share that they feel “uncomfortable” when they “hear people speaking a language other than English in public places” and they don’t understand what’s being said. A plurality (47%), however, does not have this concern while 22% have no opinion. Less than half of immigration Restrictionists (43%) express this discomfort, although they are about twice as likely to agree as Expanders (24%).
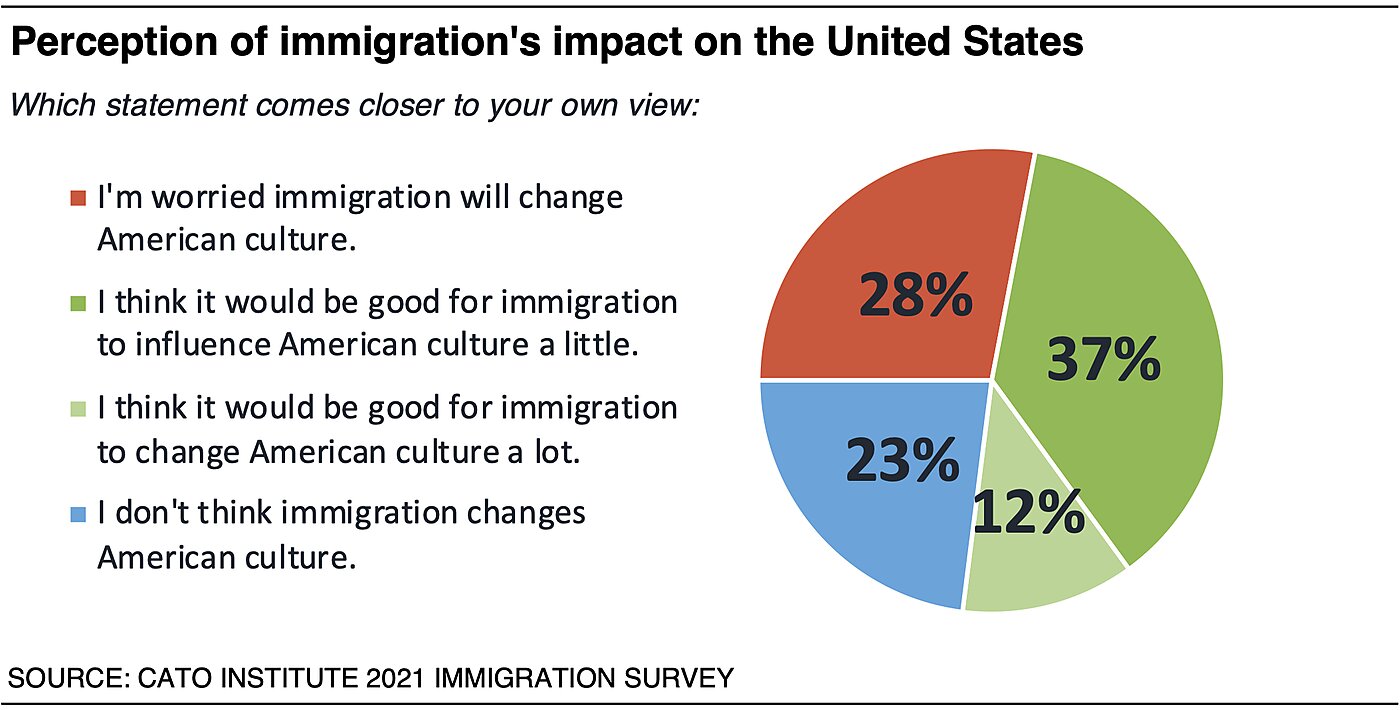
About a quarter (28%) of Americans say they are “worried” that immigration “will change American culture.” On the other hand, nearly half (49%) say they think it would be good for immigration to influence American culture at least a little (37%) or a lot (12%). About another quarter (23%) think immigration does not influence American culture. Thus, most people are not actively worried that immigration will change the culture, and a plurality thinks some change is good.
This is a concern that resonates deeply with people who want to limit immigration. A majority (58%) of immigration Restrictionists are actively worried that immigration is changing the American culture to which they are attached. Only about quarter (24%) think it would be good for immigration to change the culture and about a fifth (19%) don’t think immigration is causing cultural change. In contrast, only 11% of immigration Expanders are “worried” about cultural change. Instead, 68% think it would be good for immigration to change the culture at least a little (46%) or even a lot (22%). About a fifth (21%) don’t think immigration impacts culture.
A third (33%) of Americans worry that “immigrants will become so numerous [the respondent] will no longer feel at home in [his or her] own country.” However, a plurality (46%) does not have this concern and 21% aren’t sure either way. A majority of immigration Restrictionists (57%), but only 15% of immigration Expanders, also worry about no longer feeling at home in the U.S.
Racial and Ethno-Cultural
Among White Americans who are not immigrants, a little less than half (41%) say they worry “immigrants will become so numerous that [the respondent] will become a minority in [his or her] own country.” Perhaps they are afraid of facing the same obstacles minorities in this country currently face. For instance, 55% think immigration over time could cause “discrimination against white people” to increase.
Concerns about becoming a minority are a salient issue for immigration Restrictionists: 69% worry about becoming a minority in the country, and 82% fear that over time discrimination against White Americans could increase. Among immigration Expanders, 13% worry about becoming a racial minority, and 33% think discrimination against White Americans could increase with immigration over time.
About a quarter (29%) of Americans express “worry” that immigrants are “replacing America’s ethnic background.” A plurality (47%) disagrees, and a quarter (24%) have no opinion. Fifty-one percent (51%) of immigration Restrictionists agree they are worried about this, compared to 17% of immigration Expanders and 19% of Maintainers.
The survey also used a common political science research technique that asked respondents to use a “feelings thermometer” to express how they feel toward Black, White, Latino, and Asian Americans.4 While large majorities of Americans express favorable attitudes toward all groups, there is a subset who express negative attitudes. Unfavorable attitudes expressed among Restrictionists are as follows: 8% for White Americans, 17% for Black Americans, 20% for Latino Americans, and 19% for Asian Americans. The pattern was somewhat reversed among immigration Expanders. Unfavorable attitudes expressed among Expanders are as follows: 21% for White Americans, 13% for Black Americans, 11% for Latino Americans, and 14% for Asian Americans.
Crime and Violence
A third (33%) of Americans believe that immigration increases crime, and 47% believe it elevates the risk of terrorism at least somewhat. When asked how much it increases terrorism risk, 18% say a lot, 29% say somewhat, 20% say slightly, and 33% say it does not significantly increase the risk.
Nearly two-thirds (62%) of immigration Restrictionists believe that immigration increases crime, and 74% think it increases terrorism risk at least somewhat, compared to 9% and 25% of Expanders, respectively. Among Republicans, 55% think immigration increases crime, and 71% think it at least somewhat increases the risk of terrorism. In contrast, 14% of Democrats think immigration increases crime, and 27% think it increases terrorism risk.
Political
Many Americans believe that immigration offers electoral advantages. Among all Americans, 50% say immigration helps Democrats, 42% believe immigration doesn’t advantage either party, and only 7% think it benefits Republicans.
A solid majority (63%) of immigration Restrictionists are Republicans. Restrictionists are even more likely to believe that immigration benefits Democrats (69%) rather than Republicans (5%), while a quarter (26%) say immigration doesn’t advantage either party. In contrast, fully 73% of immigration Expanders are Democrats. More than half of immigration Expanders do not believe immigration provides Democrats with advantages: 50% say immigration doesn’t advantage either party, 11% say it helps Republicans, and 39% think it helps Democrats.
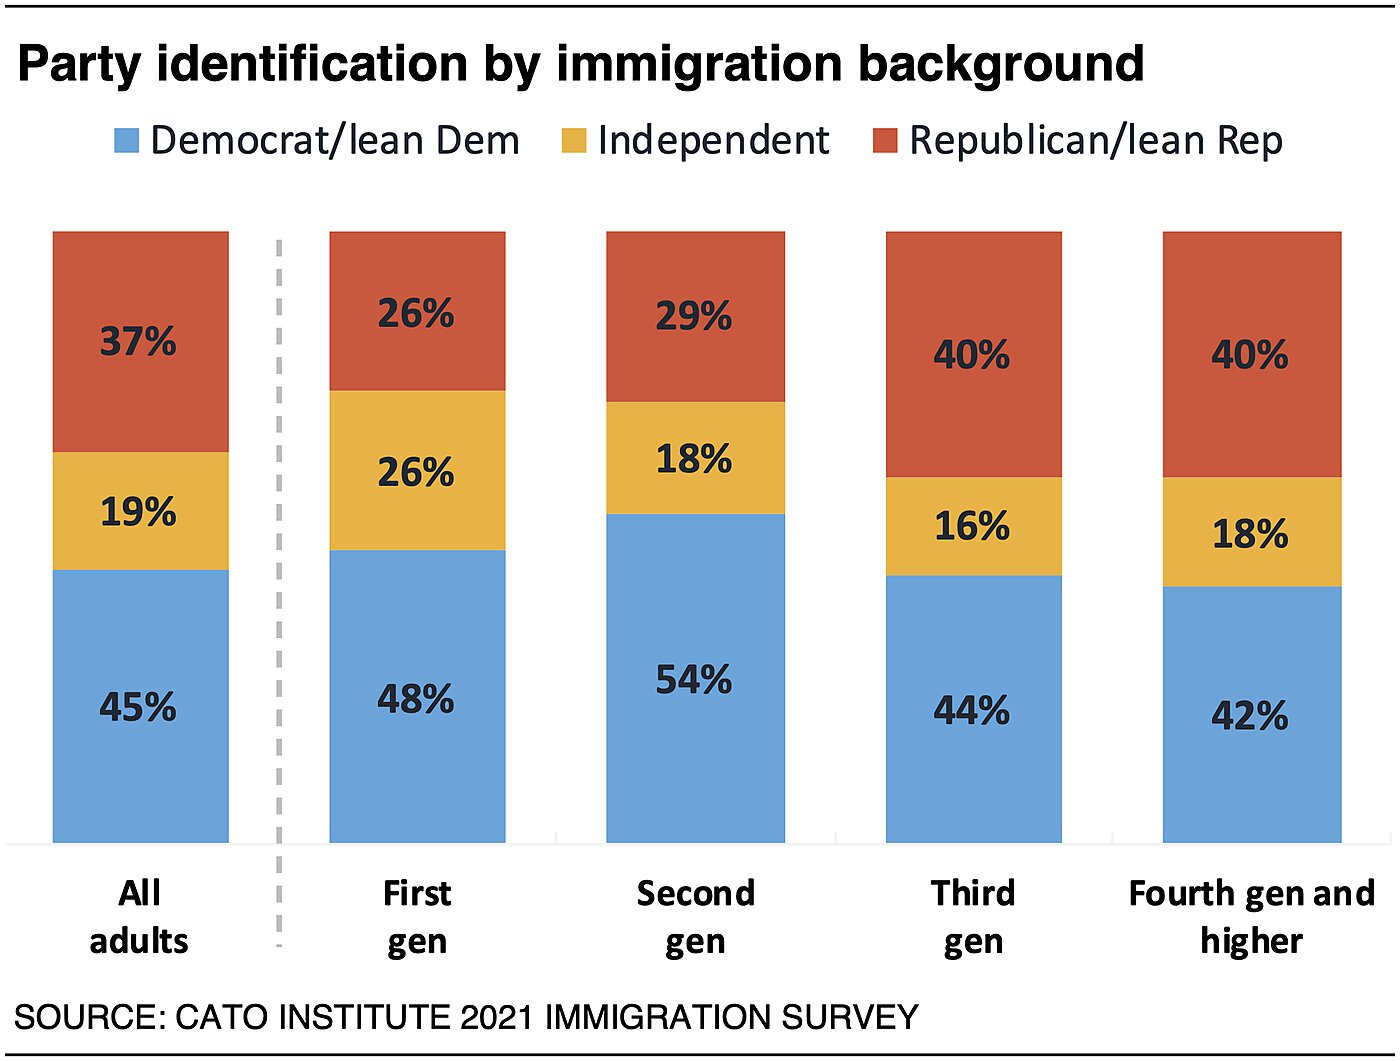
Examining partisanship of Americans by immigration background indicates that immigrants are somewhat more likely than native-born Americans who are not second-generation immigrants to identify or lean with the Democratic party. Among first-generation immigrants in our sample, 48% identified or leaned Democratic, 26% were independent, and 26% were Republican. Among second-generation immigrants: 54% were Democratic, 18% independent, and 29% Republican. Among third-generation immigrants, 44% were Democratic, 16% independent, and 40% Republican. Among other native-born Americans who are not second- or third-generation immigrants, 42% identified as Democrats, 18% as independents, and 40% as Republicans.
A quarter (24%) of Americans also believe that “a lot” of undocumented immigrants vote in national elections, 27% say “some,” and 21% say “a few.” About another quarter (28%) say that unauthorized immigrants don’t vote in national elections.
Restrictionists are more likely to believe that unauthorized immigrants are casting ballots in elections: 48% say “a lot” do, 31% say “some,” and 12% say “a few.” Only 10% say unauthorized immigrants don’t vote in U.S. elections. Expanders are far more skeptical of these claims: 47% say no undocumented immigrants vote in national elections, 22% think “a few,” 20% say “some,” and 10% say “a lot.”
Given these perceptions that immigration advantages the Democratic Party, it’s not particularly remarkable that Republicans would be more skeptical of immigration.
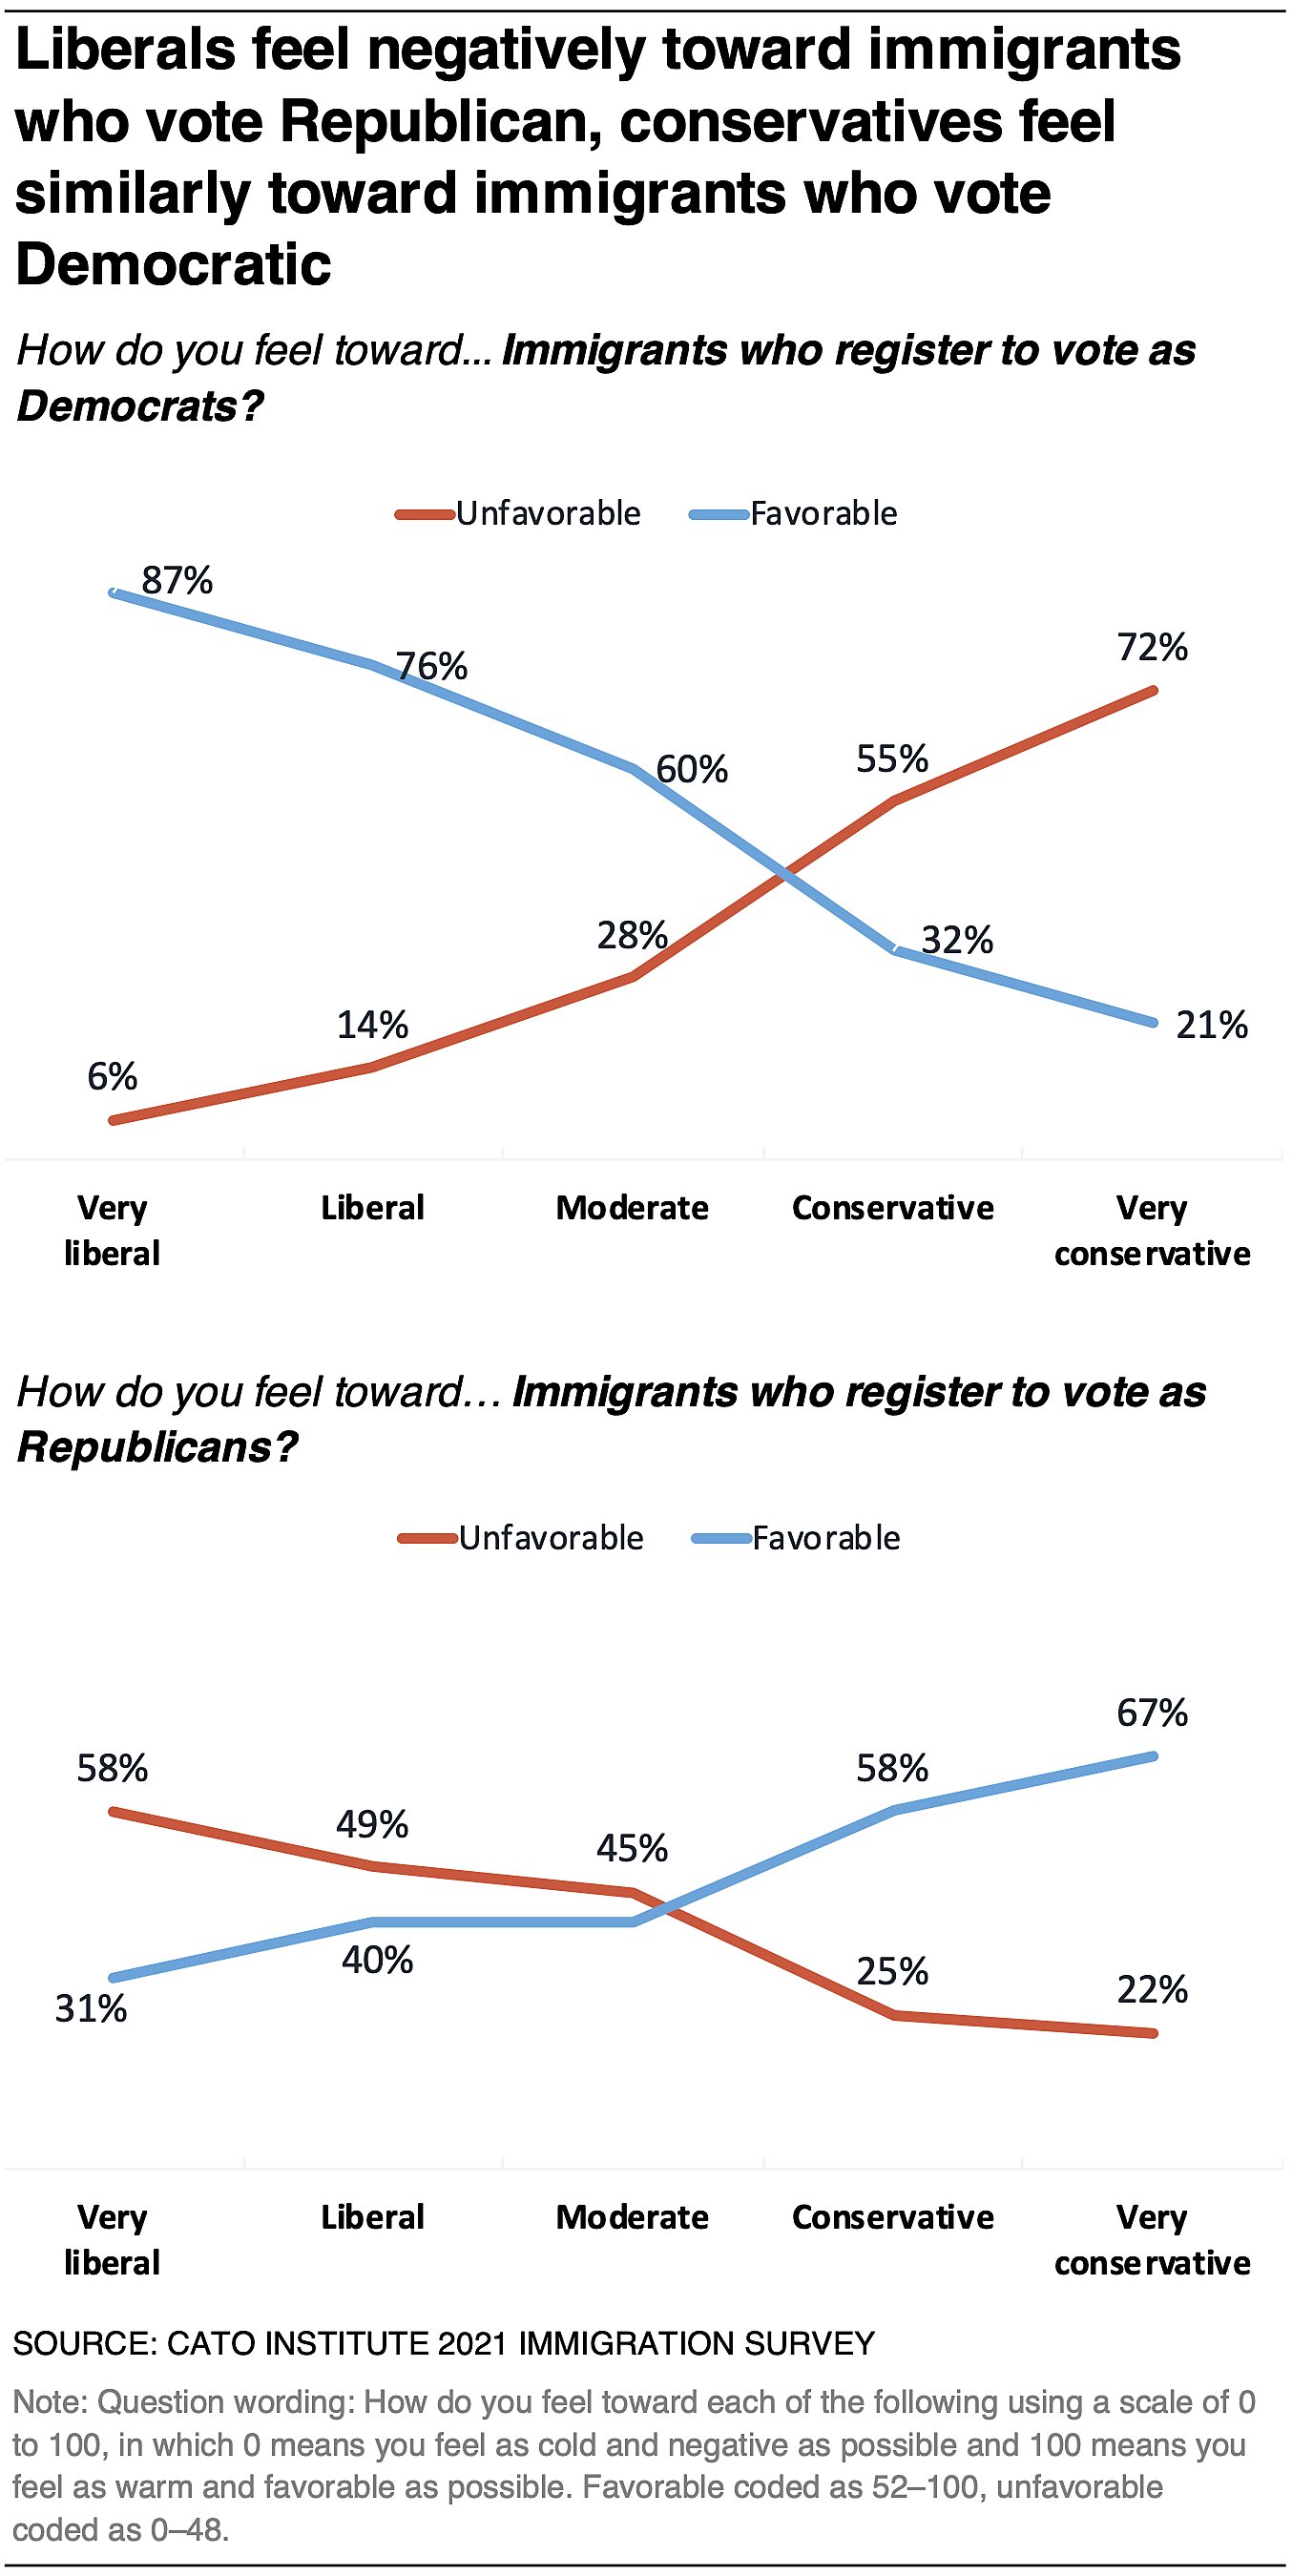
Liberals and conservatives perceive immigrants differently depending on what political party immigrants decide to join. Fully 87% of strong liberals and 75% of liberals have favorable opinions of immigrants who join the Democratic Party. However, liberals turn against immigrants if they join the Republican party: 58% of strong liberals and 49% of liberals have unfavorable views of such immigrants. In a similar fashion, conservatives feel favorably toward immigrants who join the Republican party: 67% of strong conservatives and 58% of conservatives have favorable views of immigrants who register as Republicans. However, conservatives turn even more strongly against immigrants if they register as Democrats: 72% of strong conservatives and 55% of conservatives have unfavorable views of Democratic immigrants.
These data show that while political views significantly color partisans’ attitudes of immigrants, liberals tend to have more favorable feelings toward immigrants than conservatives, regardless of immigrants’ voter behavior.
Why Do Americans Feel the Way They Do about Regional Immigration?
Americans’ Perceptions of Immigrants Differ Somewhat by Immigrants’ Region of Origin
The survey compared Americans’ perceptions of immigrants from different regions of the world to their perceptions of native-born Americans. Respondents were asked if they believed immigrants from Latin America, Europe, Asia, and Africa are more likely, equally likely, or less likely than Americans to work hard at their jobs, have stable family situations, be loyal to America, share American values, be intelligent, receive welfare, and commit crime. Across nearly every dimension, a majority of Americans perceive immigrants from each of the regions to be similar to native-born Americans.
However, looking at the net percentage of respondents who say they think immigrants are “more likely” to have a certain characteristic minus the percentage who say “less likely” did reveal some differences. Although most respondents believe that immigrants are like them regardless of their region of origin, there are some differences, on net, in how immigrants are perceived.
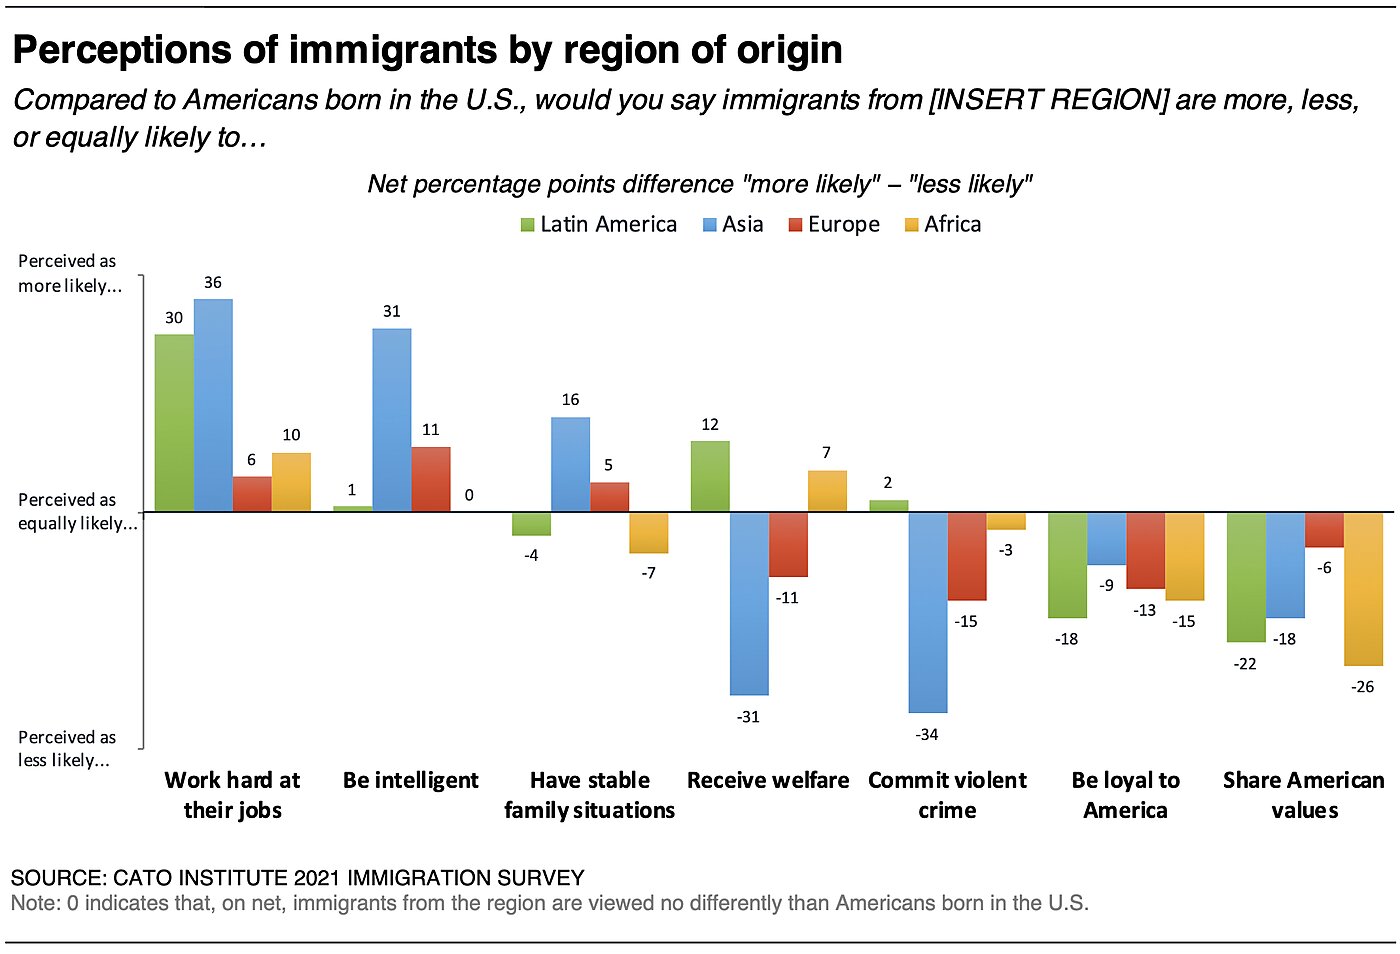
Hard Work On net, Americans perceive immigrants from each of these regions as more likely than native-born Americans to “work hard at their jobs,” particularly immigrants from Asia (+36) and Latin America (+30), as well as Africa (+10), and Europe (+6).
Receipt of Welfare Americans perceive, on net, that welfare use is lower among immigrants from Asia (−31) and somewhat less from Europe (−11) compared to native-born Americans. Americans believe that immigrants from Latin America (+12) and Africa (+7) are somewhat more likely to receive government assistance than native-born Americans.
Intelligence Americans perceive immigrants from each of these regions to be equally or somewhat more intelligent than native-born Americans. On net, Americans perceive immigrants from Asia (+31) and somewhat from Europe (+11) to be more intelligent, and immigrants from Latin America (+1) and Africa (equal) to be similar to native-born Americans.
Stable Family Situations Immigrants from Asia (+16) are perceived to be more likely than native-born Americans to have “stable family situations,” on net. European (+5) and Latin American (−4) immigrants are believed to be about equally likely. Immigrants from Africa are thought, on net, to be somewhat less likely (−7) than native-born Americans.
Violent Crimes Americans perceive that immigrants from Asia (−34) and somewhat from Europe (−15) are less likely than native-born Americans to commit violent crimes, on net. Immigrants from Africa (−3) and Latin America (+2) are viewed as about equally likely as native-born Americans.
Loyalty and Shared American Values Immigrants from all four regions, on net, are viewed as less likely than Americans to be loyal to America, including immigrants from Latin America (−18), Africa (−15), Europe (−13), and Asia (−9). Similarly, immigrants from each of these regions are thought to be less likely to “share American values,” including immigrants from Africa (−26), Latin America (−22), Asia (−18), and Europe (−6).
Perceptions among Immigration Expanders and Restrictionists
On net, immigration Expanders perceive immigrants from Asia, Latin America, Europe, and Africa to be more likely than native-born Americans to work hard at their jobs, be intelligent, have stable family situations, be loyal to America, and share American values, and less likely to receive welfare and commit violent crimes.
Conversely, immigration Restrictionists perceive immigrants from all four regions to be less likely, on net, than native-born Americans to be loyal to America and share American values. However, Restrictionists have more nuanced views on other dimensions. Restrictionists perceive, on net, that immigrants from Asia (+25) and Latin America (+10) are more likely than native-born Americans to work hard at their jobs and immigrants from Africa (−16) somewhat less likely. They believe, on net, immigrants from Asia (+28) and Europe (+7) are more intelligent than native-born Americans and immigrants from Latin America (−13) and Africa (−17) less so. They perceive immigrants from Asia (-36) and Europe (−11) as less likely to receive welfare and immigrants from Latin America (+45) and Africa (+36) as more likely, on net. A similar pattern emerges regarding perceptions of crime. Restrictionists believe, on net, immigrants from Asia (−29) and Europe (−20) are less likely to commit violent crimes and immigrants from Latin America (+31) and Africa (+20) are more likely. Regarding stable family situations, Restrictionists view immigrants from Asia (+6) as somewhat more likely than native-born Americans to have stable family situations and immigrants from Latin America (−22) and Africa (−28) as less likely, on net.
Americans’ perceptions of cultural similarities between the United States and other countries
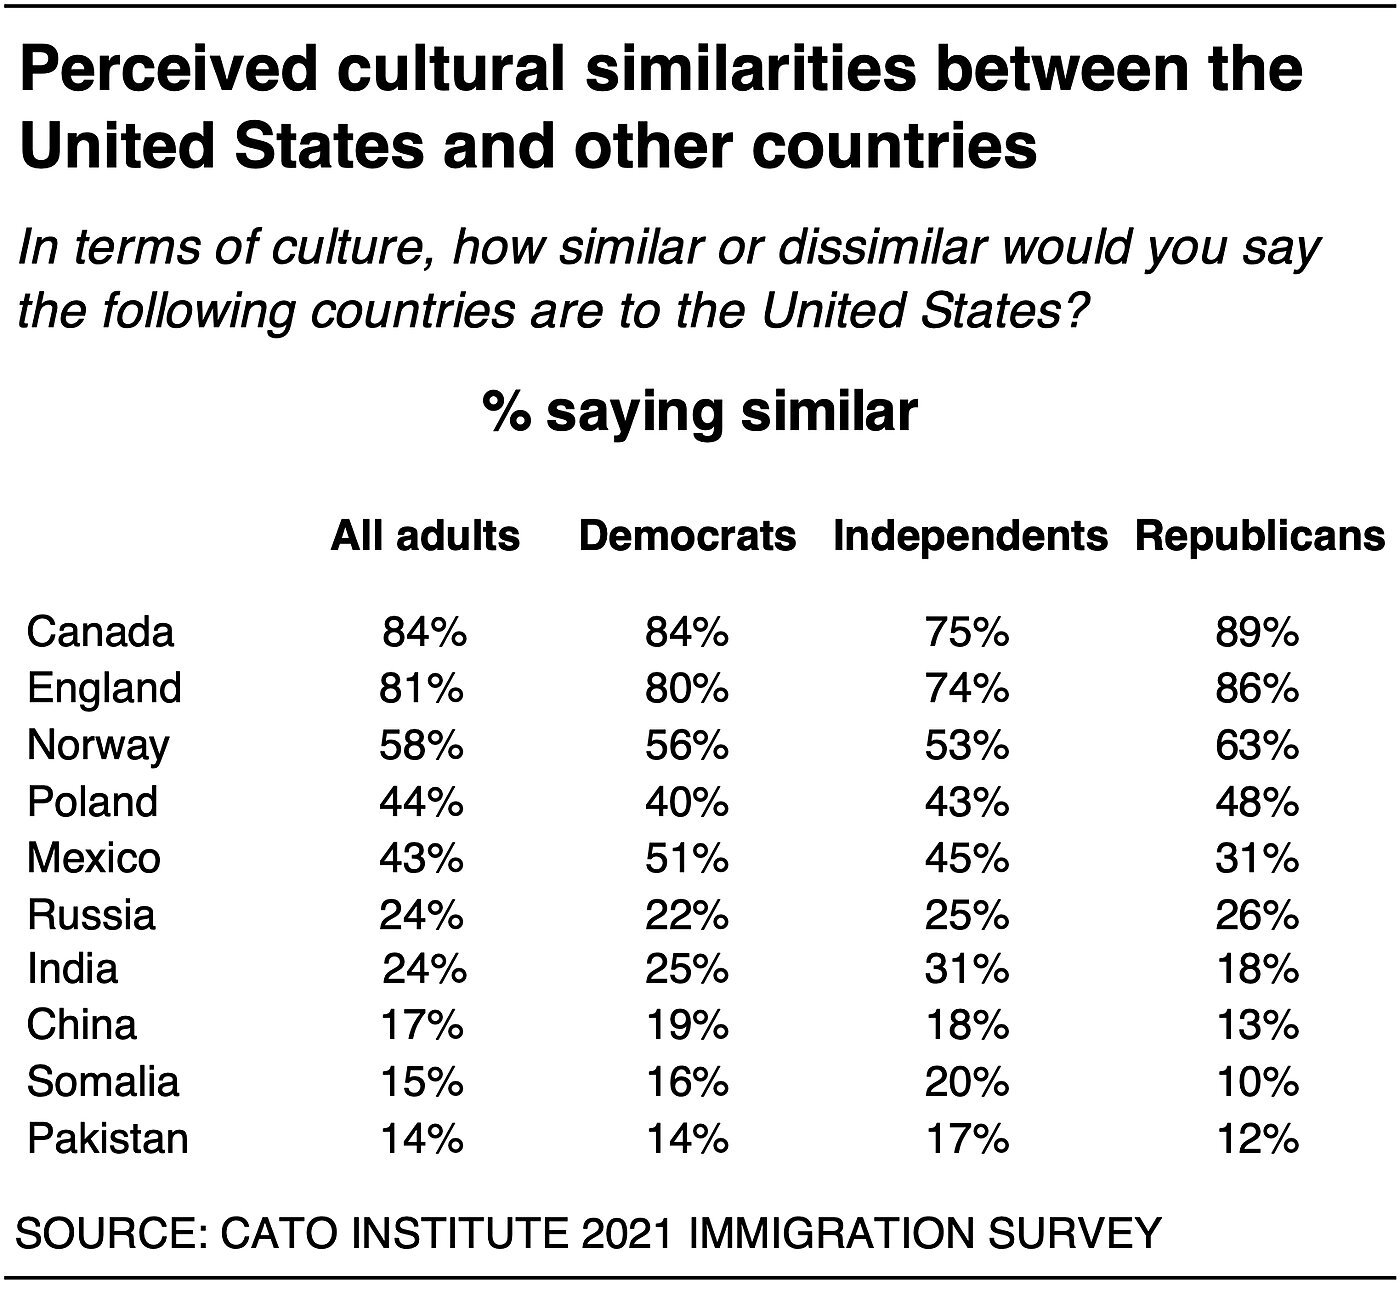
Opinions about regional immigration may also be affected by perceptions of cultural similarity or distance, in addition to other reasons. Thus, the survey asked respondents how similar or dissimilar a variety of countries are to the United States.
Americans generally view Canada and Western European countries as more similar than Eastern European, African, Middle Eastern, Asian, and Latin American countries. Majorities view Canada (84%), England (81%), and Norway (58%) as culturally “similar.” Less than half view the following countries as culturally similar: Poland (44%), Mexico (43%), Russia (24%), India (24%), China (17%), Somalia (15%), and Pakistan (14%).
On the other hand, majorities view Pakistan (86%), Somalia (85%), China (83%), Russia (76%), India (76%), Mexico (57%), and Poland (56%) as culturally dissimilar. Less than half say Norway (42%), England (19%), and Canada (16%) are culturally distant.
Partisans have similar but not identical views. Majorities of both Democrats and Republicans view cultural similarities between the U.S. and Canada (84% vs. 89%), England (80% vs. 86%), and Norway (56% vs. 64%). Among Democrats, about half or fewer view cultural similarities with Mexico (51%), Poland (40%), India (25%), Russia (22%), China (19%), Somalia (16%), and Pakistan (14%). Among Republicans, less than half perceive cultural closeness with Poland (48%), Mexico (31%), Russia (26%), India (18%), China (13%), Pakistan (12%), and Somalia (10%). Partisans differ the most in perceptions of Mexico. By a 20-point margin, more Democrats than Republicans (51% vs. 31%) feel the U.S. is culturally similar to Mexico.
How Do Attachments and Identity Affect Immigration Attitudes?
Opinions about assimilation and cultural cohesion may contribute to immigration attitudes. Most Americans embrace the idea of America as a “melting pot.” But many disagree about what that means in practice. Differences in opinion about what is required to join the “melting pot” will predictably create conflicts about immigration more generally.
59% Prefer a Country with an Essential American Culture That Immigrants Take On
A majority (59%) of Americans prefer a “country with an essential American culture and values that immigrants take on when they arrive.” Another 41% prefer a country made up of “many cultures and values that change as new people arrive.”
Majorities of first-generation immigrants (60%), second-generation immigrants (51%), and other native-born Americans (60%) who are not second-generation immigrants agree. While, American-born children of immigrants (second-generation immigrants) generally concur, they are more evenly divided, with 51% who prefer a country with an essential culture and 49% who prefer one comprising many cultures.
This question divides partisans. Majorities of Republicans (83%) and independents (56%) prefer a country with an essential American culture and values that everyone takes on. Democrats disagree, and a majority (60%) prefer a country comprising many different cultures.
This question divides immigration Restrictionists and Expanders as well. Restrictionists highly prefer (83%) a country with an essential culture that immigrants adopt when they arrive, while a majority (60%) of Expanders prefer a country made up of many cultures and values that change with immigration.
70% Favor a “Melting Pot of Cultures”
A strong majority of Americans (70%) believe it’s more important for immigrants “to change so that they blend into the larger society, as in the idea of a melting pot of cultures.” About a quarter (29%) say it’s more important for immigrants to maintain their distinct cultures. It’s also important to also note that many Americans feel the “melting pot” process should go both ways; for instance, 63% think it would be “good” for immigration also to influence American culture (among those who think it has any impact).
Solid majorities of first-generation (72%) and second-generation (63%) immigrants and the third generation and later (71%) think it is important for immigrants to change to join the “melting pot of cultures.” Notably partisans, as well as immigration Expanders and Restrictionists, also reach consensus: 80% of Republicans, 65% of Democrats, 64% of independents, 77% of Restrictionists, and 63% of Expanders prefer the idea of a “melting pot of cultures” rather than maintaining distinct cultures.
Americans Are Skeptical Whether Most Immigrants Have Assimilated
Americans are divided about whether immigrants over the past 20 years have “adopted essential American culture and values.” Half say they have, while the other half say that immigrants primarily “retained their own cultures and values.” Sixty percent (60%) also perceive that immigrants prefer to “retain the cultural values and practices” of where they were born; 40% believe immigrants prefer to adopt American cultural values and practices.
Nearly three-fourths (71%) also say they perceive that immigrants have lived near and primarily interacted with people from their home country rather than primarily interacted with native-born Americans (29%).
Perceptions vary considerably by immigration background and political ideology. Nearly three-fourths (74%) of first-generation immigrants say most people who have immigrated to the U.S. over the past 20 years have mostly adopted essential American culture rather than retained their own cultures. Second-generation immigrants are about 20 points less likely to agree (54%). And in contrast, a majority (53%) of other native-born Americans who are not second-generation immigrants disagree and believe immigrants have mostly retained their own cultures and values rather than adopting essential American culture. All three are about equally likely (7 in 10) to perceive that immigrants primarily have lived near and interacted with people from their home country rather than with native-born Americans.
A majority (56%) of first-generation immigrants also say that most immigrants “want to adopt American cultural values and practices.” The American-born children of immigrants and other native-born Americans have a different perception. A majority (56%) of second-generation immigrants and other native-born Americans (63%) believe that immigrants prefer to retain the cultural values and practices of where they were born.
Partisans are starkly divided. Nearly two-thirds (63%) of Democrats compared to 37% of Republicans and 44% of independents believe immigrants over the past 20 years have mostly adopted essential American culture and values. In contrast, nearly two-thirds (63%) of Republicans and 56% of independents believe immigrants have mostly retained their own cultures and values. Majorities of all three groups (64% of Democrats, 67% of independents, and 81% of Republicans) perceive immigrants have primarily interacted with those from their home country.
A majority (71%) of immigration Restrictionists perceive immigrants have retained their own cultures whereas immigration Expanders (70%) and Maintainers (53%) perceive immigrants have adopted essential American culture. Majorities of both Restrictionists (81%) and Expanders (63%) perceive immigrants to have primarily lived near and interacted with people from their home country.
There’s a slight racial divide as well. Slim majorities of White (52%) and Black (51%) Americans believe most immigrants have not adopted essential American culture, whereas majorities of Latino (58%) and Asian (64%) Americans believe immigrants have done this.
What Do People Think It Means to Be an American?
Why do respondents have different views about immigrants adopting American culture? Defining a culture is hard to do and leaves room for different interpretations and meanings. Thus the public may disagree about the definition of “essential American culture” and what it means to adopt it.
In order to understand what Americans mean when they say they want immigrants to assimilate into the larger society, the survey asked respondents how important it is to them for immigrants to do the following things:
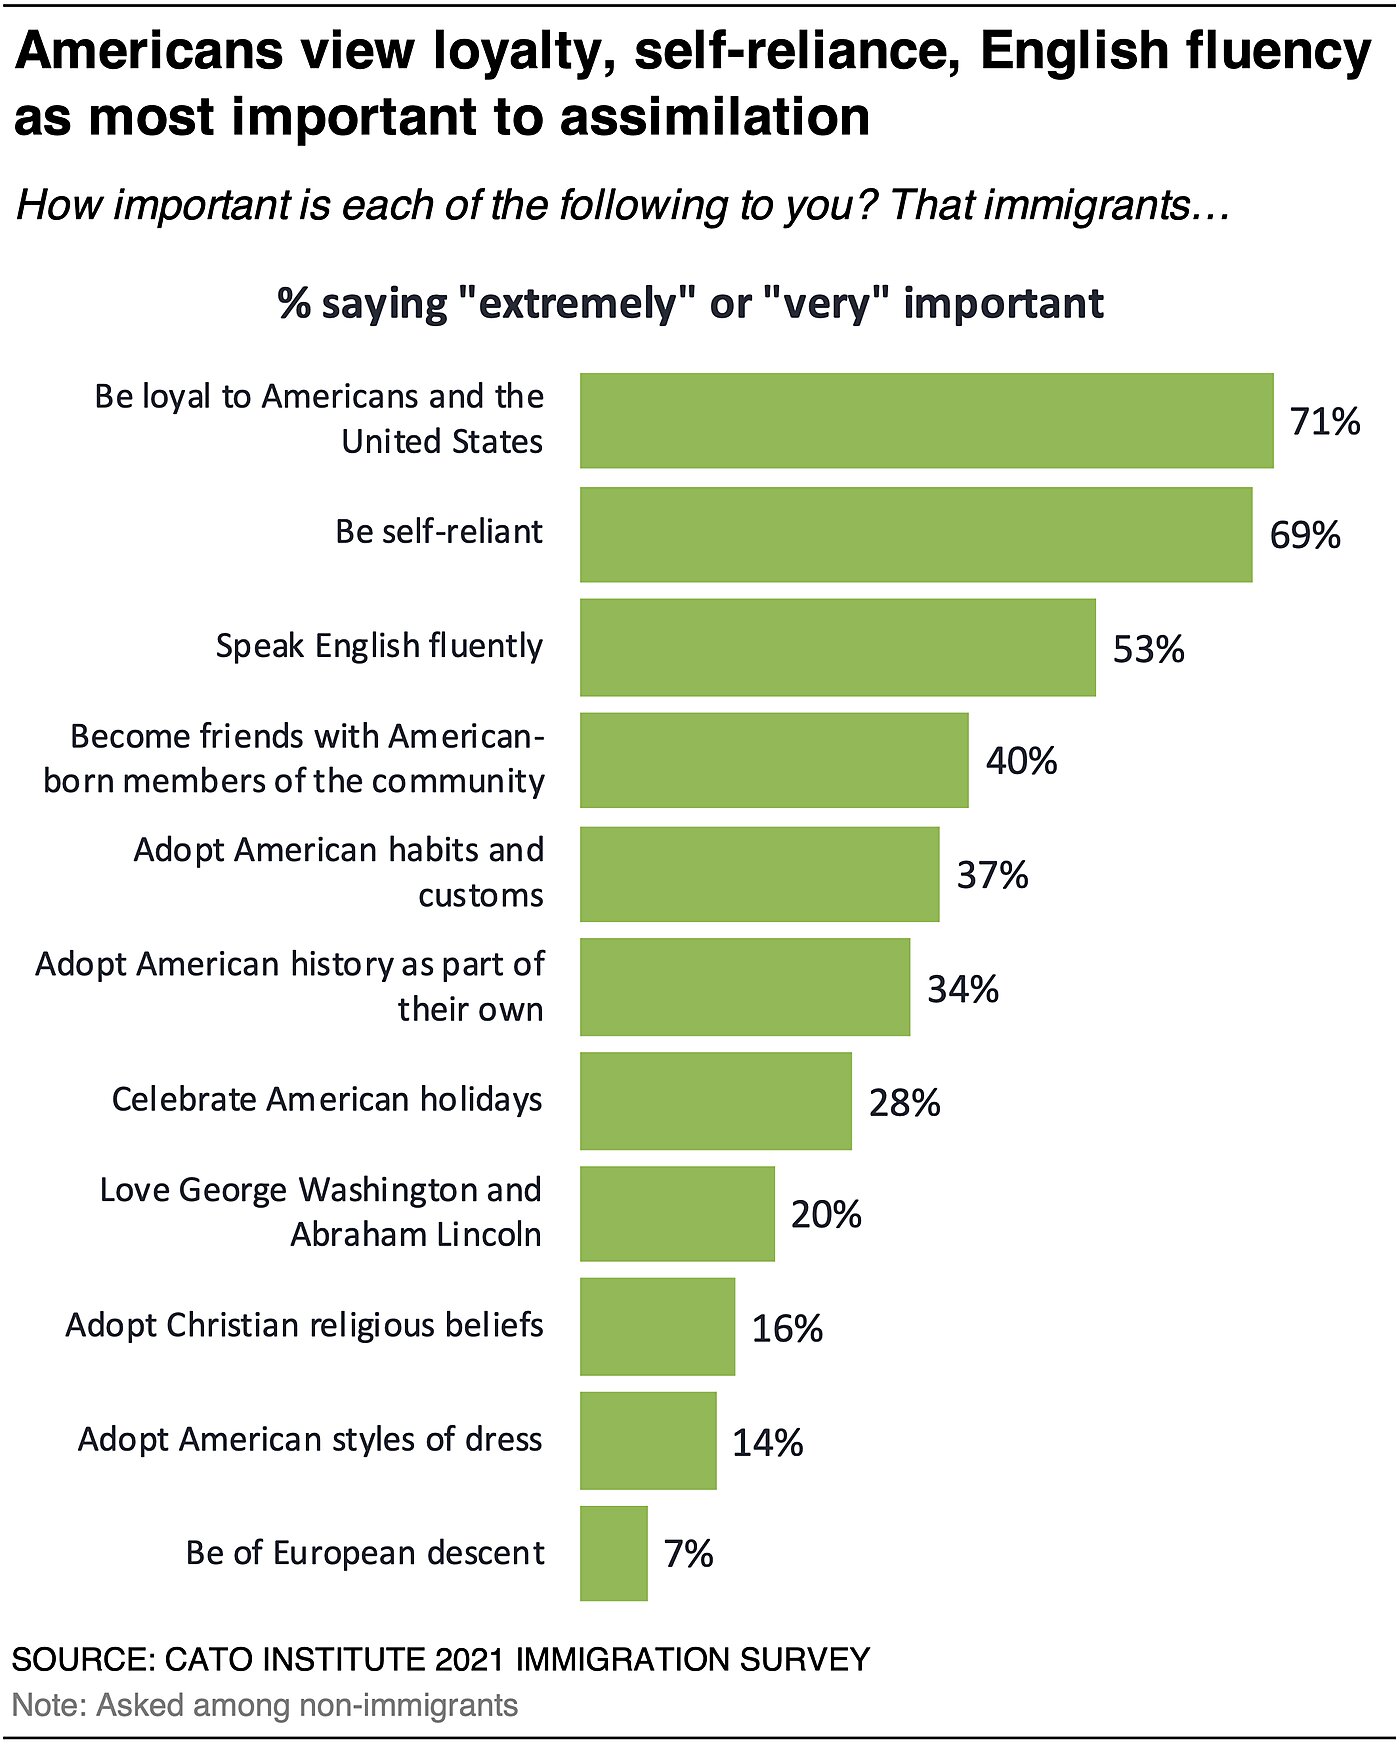
Most Americans say it is either “extremely” or “very” important to them that immigrants (1) be loyal to Americans and the United States (71%), (2) be self-reliant (69%), and (3) speak English fluently (53%). A considerable minority feel the following things are important: becoming friends with American-born members of the community (40%), adopting American habits and customs (37%), adopting American history as part of their own (34%), celebrating American holidays (28%), and feeling admiration for George Washington and Abraham Lincoln (20%). Fewer place importance on immigrants’ adopting Christian religious beliefs (16%), American styles of dress (14%), or being of European descent (7%).
Democrats and Republicans Disagree about What Assimilation Means
Democrats and Republicans disagree about assimilation preferences. Across the board, more Republicans think each of these factors is more important compared to Democrats.
Republicans are about 30 points more likely than Democrats to say it is “extremely” or “very” important to them that immigrants be loyal to Americans and the United States (87% vs. 60%), be self-reliant (87% vs. 56%), speak English fluently (71% vs. 38%), and adopt American habits and customs (55% vs. 24%). Republicans also are about 20 points more likely than Democrats to say that it’s important to them that immigrants adopt American history as part of their own (48% vs. 23%), celebrate American holidays (41% vs. 18%), and love George Washington and Abraham Lincoln (30% vs. 12%). Although fewer care about these things, Republicans also are somewhat more likely than Democrats to prioritize immigrants’ adopting Christian religious beliefs (24% vs. 12%) and American styles of dress (19% vs. 11%). Republicans and Democrats are about equally likely to select “be of European descent,” although few agreed overall (8% vs. 7%).
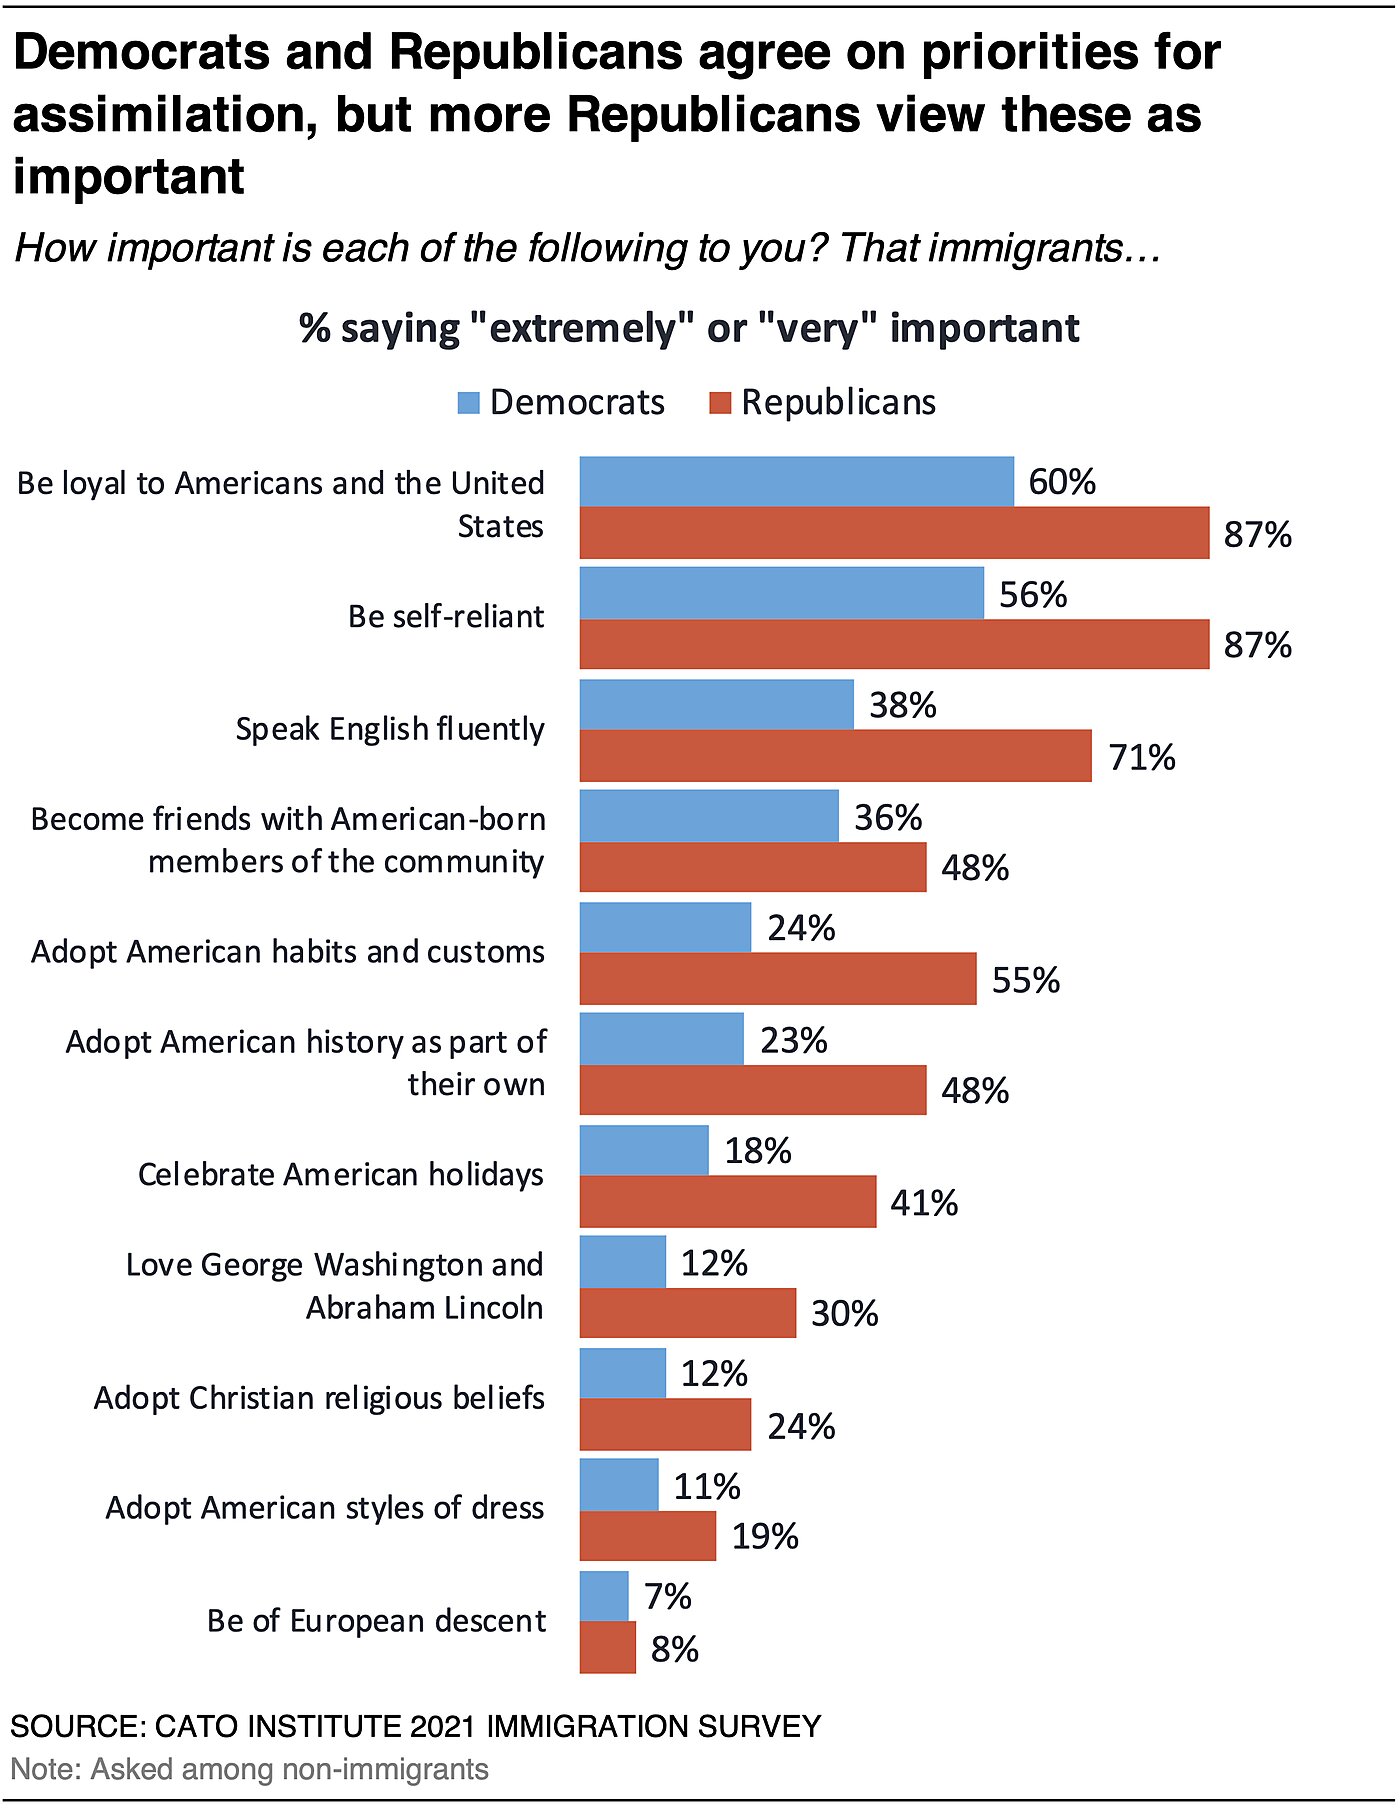
Preferences Vary by Immigration Background
Assimilation priorities also vary by immigration background. While the order of priorities remains the same, second-generation immigrants are less likely than other native-born Americans who are not second-generation immigrants to believe the items on the list are important. For instance, second-generation immigrants are about 15–20 points less likely than the third-generation and higher to say it is extremely or very important for immigrants to “be loyal to Americans and the United States” (53% vs. 74%) or be self-reliant (57% vs. 71%). They are also about 10 points less likely to say English fluency is extremely or very important (45% vs. 54%).
Expanders and Restrictionists Have Different Expectations
The one characteristic that most (59%) immigration Expanders desire is for immigrants to “be loyal to Americans and the United States,” and half said to be self-reliant. However, immigration Restrictionists have a far longer list of expectations. Majorities of this group say it’s important to them that immigrants be loyal to Americans and the United States (86%), be self-reliant (85%), speak English fluently (73%), and adopt American habits and customs (55%). And half say it’s important to adopt American history as their own (50%) and become friends with American-born members of the community (47%).
Americans Say Democracy and Ideals of Liberty Are Defining Features of American Culture
Different views about what are the most important features of American culture can also lead to disagreements about the definition of assimilation.
Pluralities say democracy (49%) and ideals of liberty (42%) are the most defining features of American culture; a third say the English language (32%), free markets and capitalism (31%), and ideals of equality (30%). About a quarter say ideals of religious freedom (29%), representative government (26%), individualism (26%), self-reliance (23%), work ethic (22%), and private property (20%). Fewer say Christianity (16%), multiculturalism (15%), limited government (14%), ideals of social tolerance (12%), racism (12%), greed (10%), the arts (9%), inequality (9%), immigration (8%), corruption (7%), and sexism (4%) are most important.
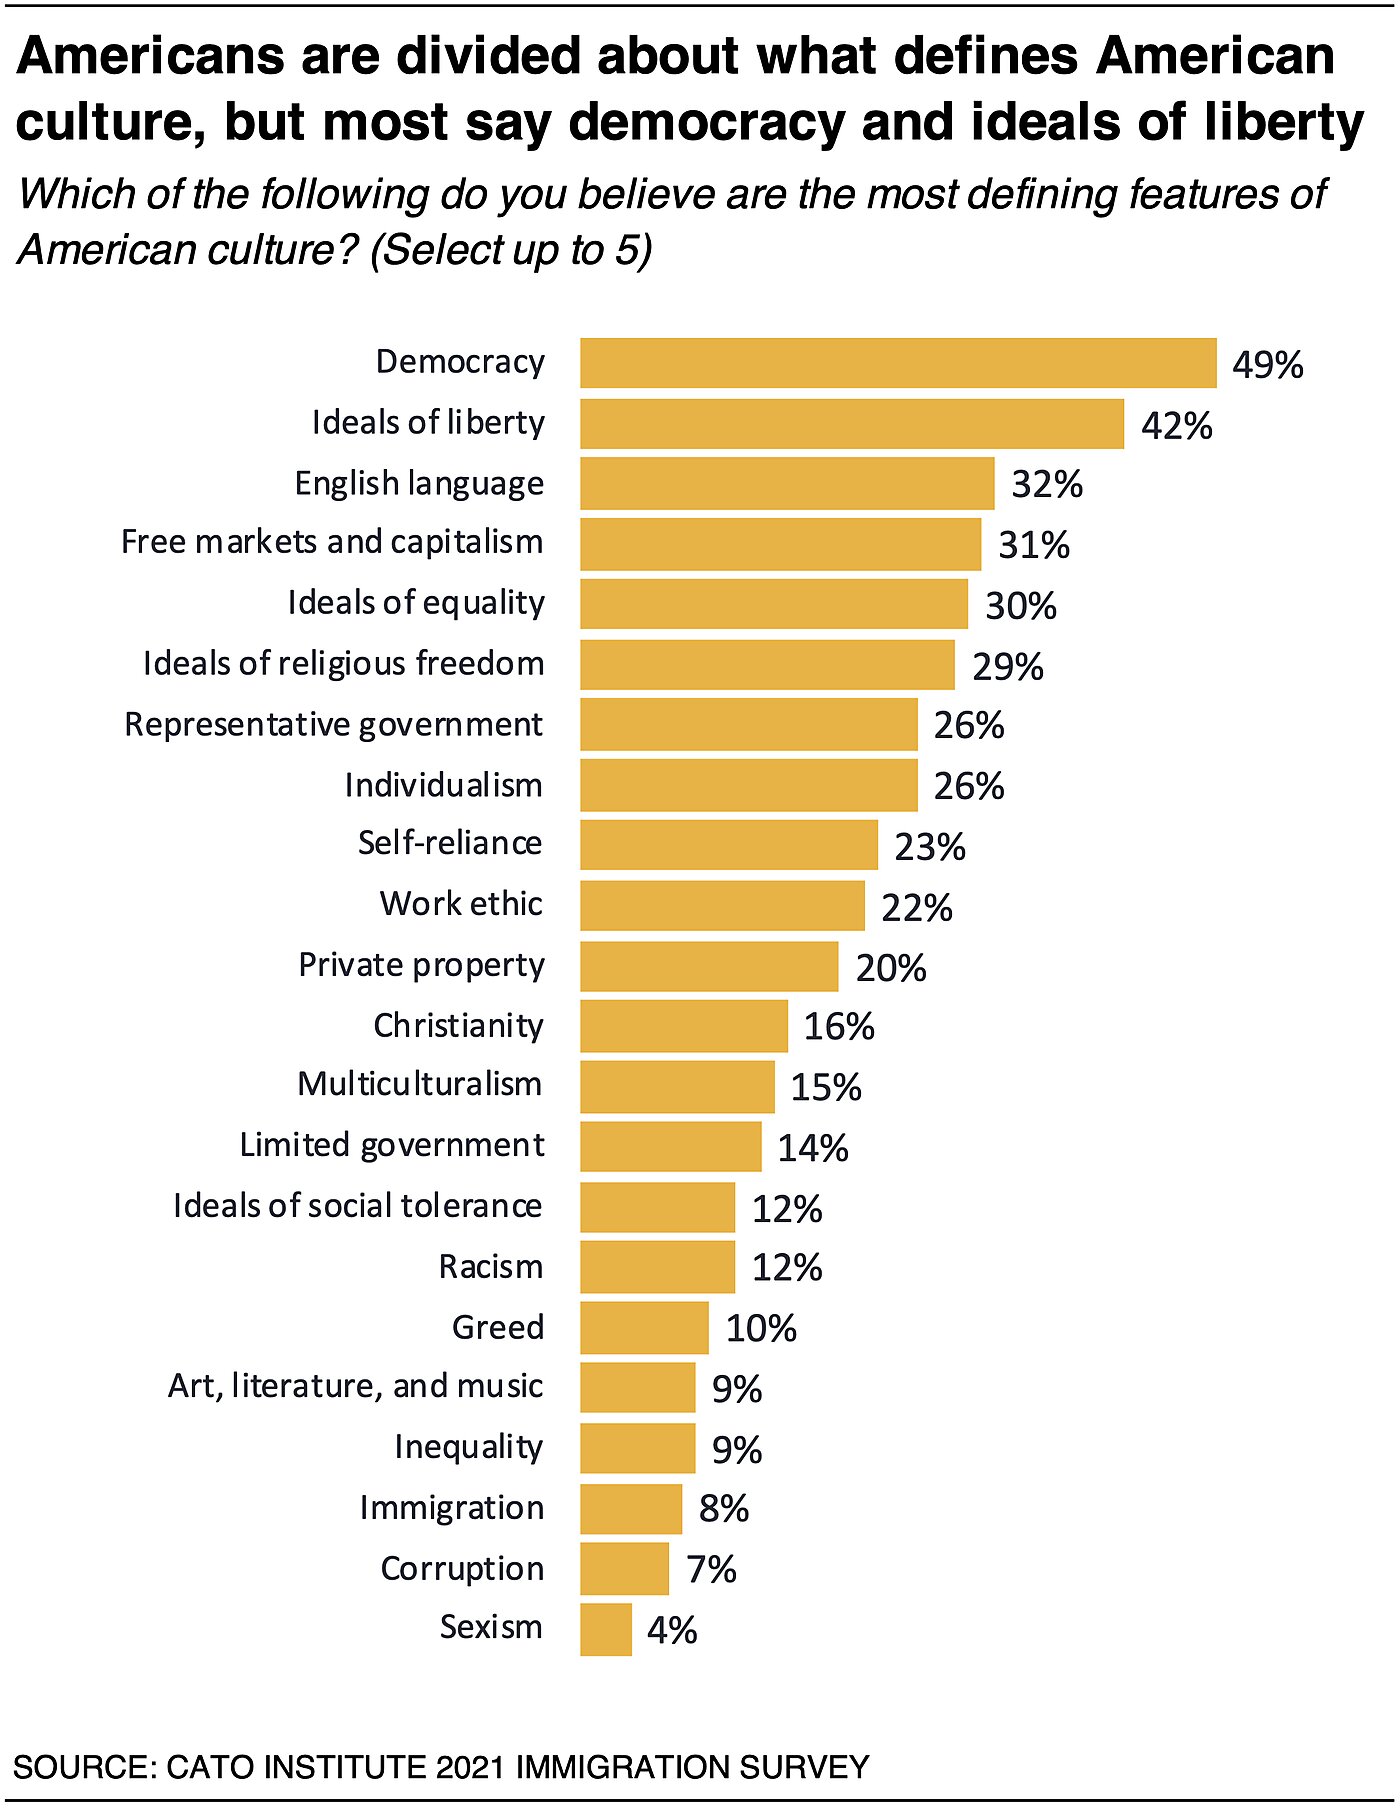
Republicans and Democrats prioritize these features differently. Furthermore, Republicans think more of these features define American culture than do Democrats. For Republicans, the top five features are ideals of liberty (52%), democracy (44%), free markets and capitalism (42%), the English language (40%), and ideals of religious freedom (34%). Democrats’ top features are democracy (57%), ideals of equality (35%), ideals of liberty (35%), ideals of religious freedom (26%), and representative government (26%). Republicans are about 20 points more likely than Democrats to say that capitalism (42% vs. 21%) and limited government (27% vs. 3%) are defining features of America and are about twice as likely to say that self-reliance (31% vs. 16%), private property (26% vs. 14%), and Christianity (23% vs. 10%) define the nation. Democrats are more likely than Republicans to identify multiculturalism (22% vs. 9%), ideals of social tolerance (17% vs. 6%), and immigration (11% vs. 3%) as most important.
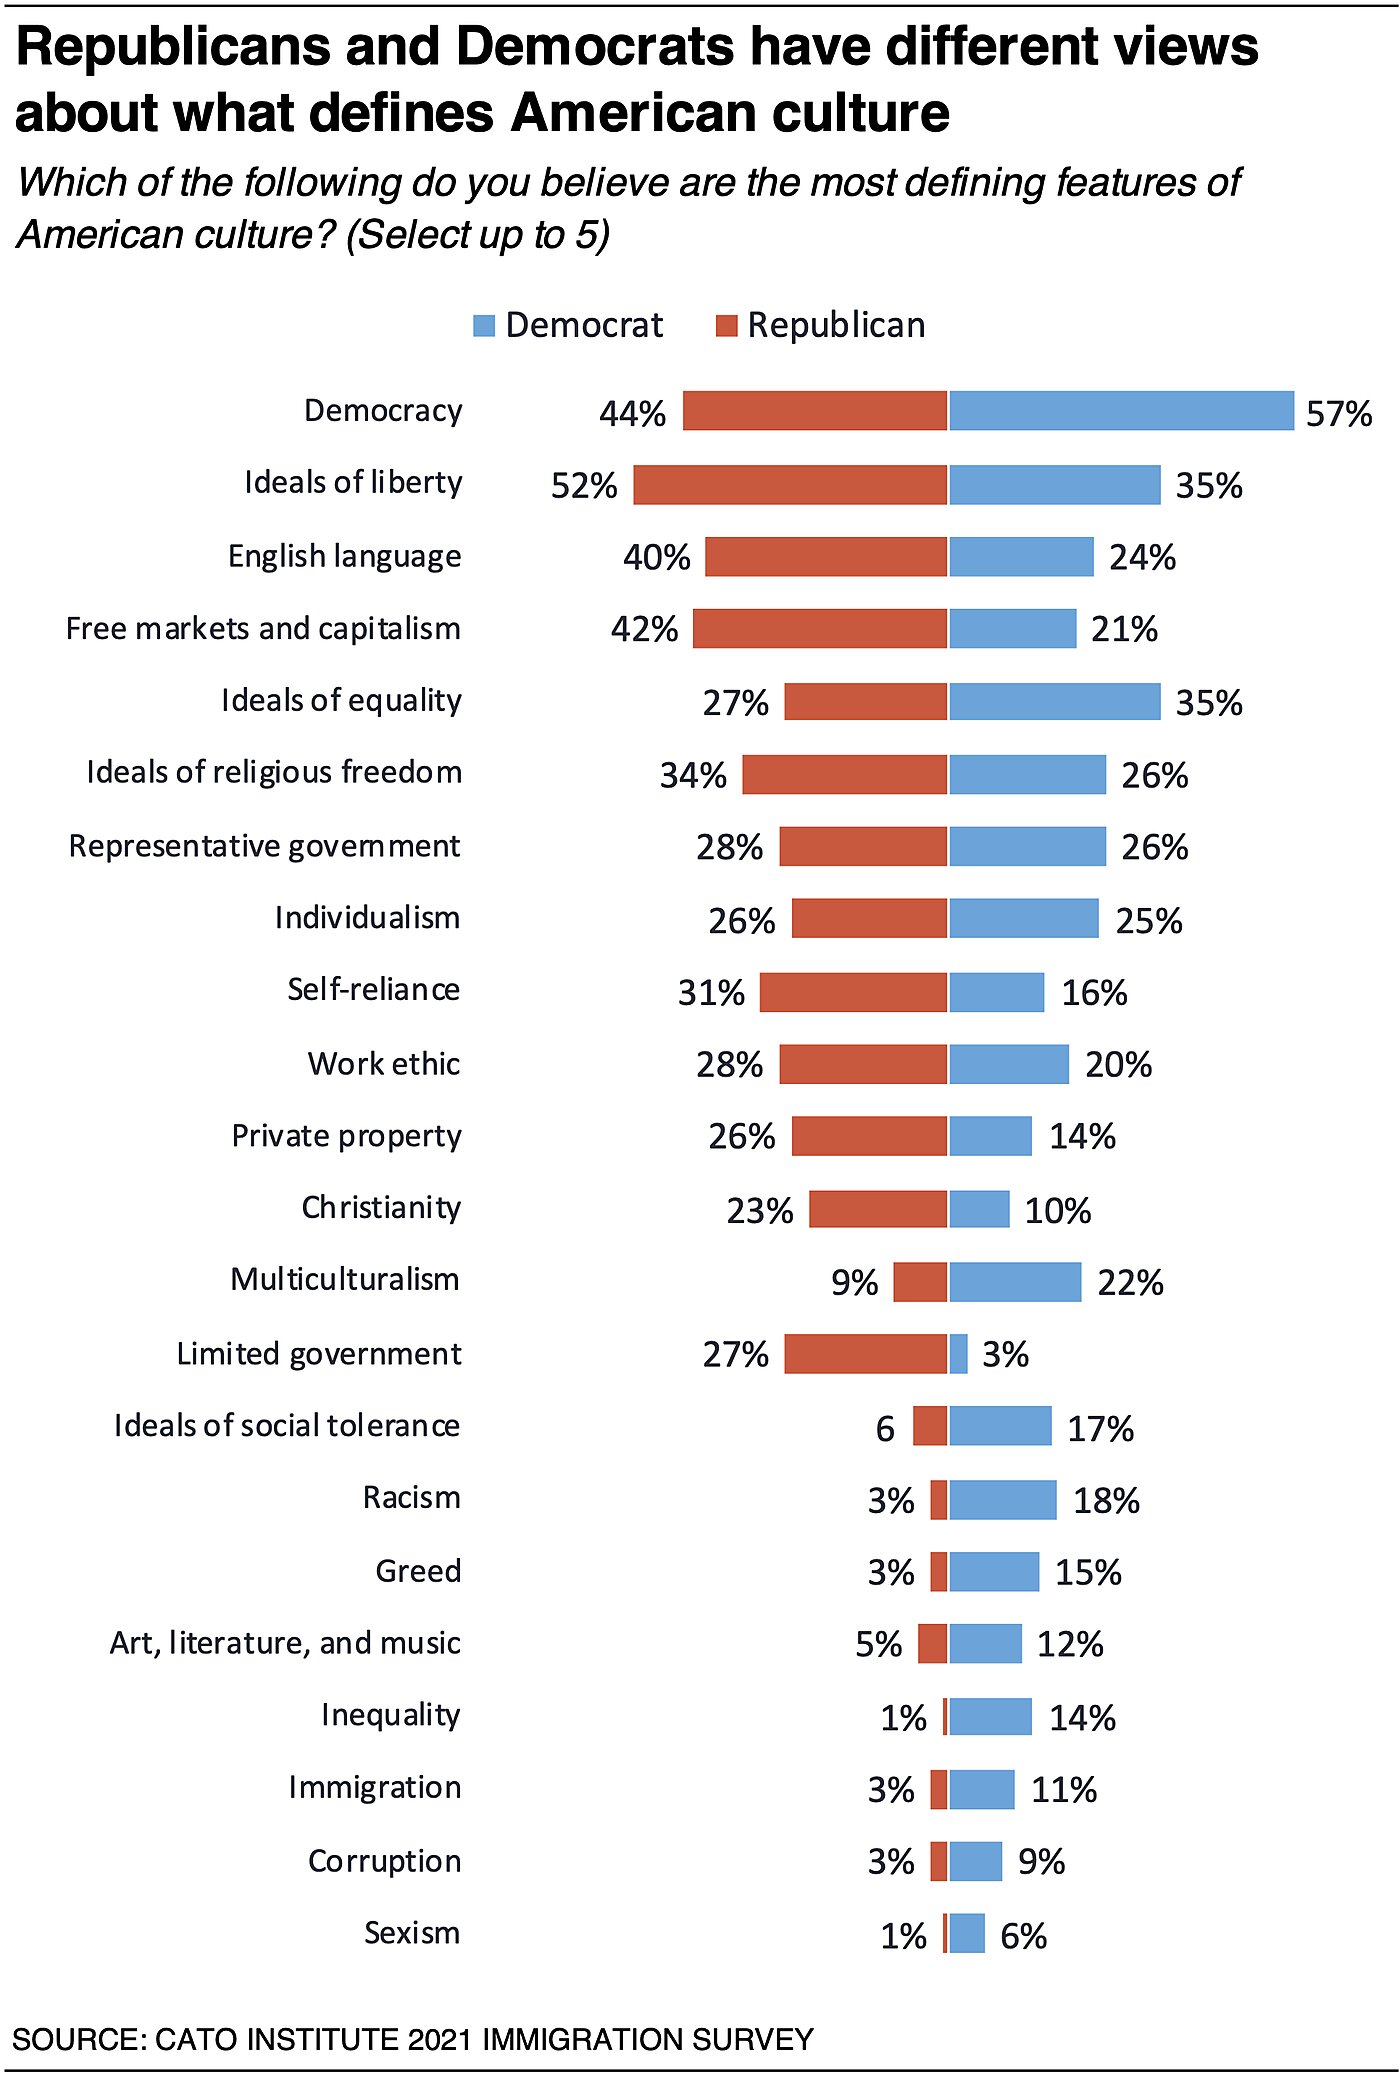
These perceptions vary less by immigration background; overall, immigrants and non-immigrants have similar views about what features define America. There are some differences: first-generation immigrants are about 10–15 points less likely than native-born Americans who are not second-generation immigrants to believe America is defined by ideals of liberty (44% vs. 30%), self-reliance (25% vs. 12%), ideals of religious freedom (32% vs. 17%), and representative government (28% vs. 18%). First-generation immigrants are more likely to say immigration is a defining feature (18% vs. 6%). Perceptions among second-generation immigrants and other native-born Americans are very similar. Two exceptions were noted: the second generation is about 10 points less likely to say that the English language (25% vs. 34%) and ideals of religious freedom (22% vs. 32%) are defining features compared to other native-born Americans who are not second-generation immigrants.
Why Do Some Americans Care about Assimilation?
Why do many Americans prefer a country with an essential American culture and values that immigrants adopt when they arrive? Some may prefer more homogeneity or relatability in their community. The survey asked respondents how much they would prefer to live in a neighborhood where most people had the following in common with them:
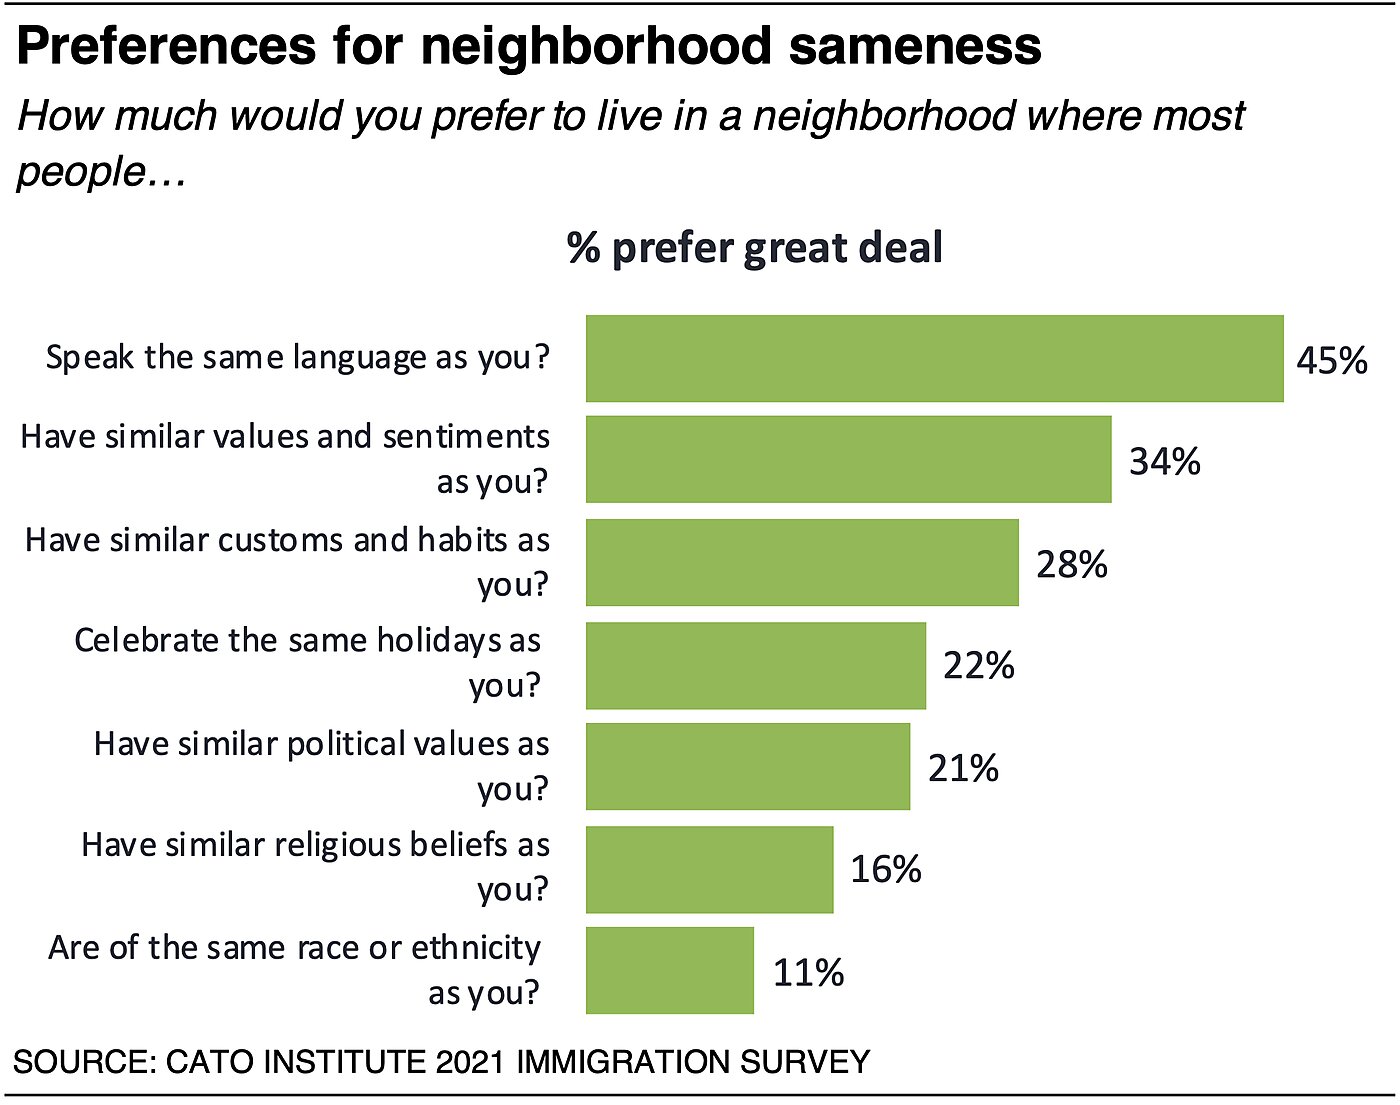
A plurality of respondents say they prefer a “great deal” to live in a neighborhood where people around them speak the same language (45%), have similar values and sentiments (34%), have similar customs and habits (28%), celebrate the same holidays (22%), and have similar political values (21%) as they. Fewer say they prefer a “great deal” to live in a neighborhood with neighbors who have similar religious beliefs (16%) or are the same race or ethnicity (11%) as they. Thus, less than half of respondents say that any of these is of “great” importance to them. However, when also including the share of respondents who say these commonalities matter at least “somewhat” or even “a little,” majorities of Americans agree.
Americans differ in the extent to which they prefer these commonalities. Republicans are far more likely than Democrats to strongly prefer many of these potential commonalities. For instance, Republicans are about twice as likely as Democrats to greatly desire neighbors who speak the same language (62% vs. 32%), to have similar “values and sentiments” (44% vs. 28%), have similar “customs and habits” (38% vs. 22%), and celebrate the same holidays (32% vs. 16%) as they. Although fewer overall, Republicans also are somewhat more likely than Democrats to greatly prefer neighborhoods where others share their political values (25% vs. 20%), religious beliefs (22% vs. 13%), or are the same race or ethnicity (14% vs. 8%) as they.

However, when including the share of respondents who say these things matter at least “a little,” “somewhat,” or “a great deal,” partisan differences are less pronounced. For instance, about 9 in 10 Democrats and Republicans prefer at least a little to be in neighborhoods where people speak the same language, have similar values and sentiments, and similar customs and habits as they. About 8 in 10 also prefer at least a little to have neighbors who share their political values. Republicans are more likely than Democrats to care about their neighbors’ celebrating the same holidays (84% vs. 69%) and sharing religious beliefs (76% vs. 59%). Both are about equally likely (58% vs. 54%) to at least slightly prefer neighbors being of the same race or ethnicity as they.
Preferences for neighborhood sameness also vary somewhat with immigration background. Native-born Americans (49%) who are not second-generation immigrants are nearly 20 points more likely than first-generation (31%) or second-generation (33%) immigrants to greatly prefer that their neighbors speak the same language as they. First-generation immigrants are somewhat more likely than the third-generation and higher to prefer neighbors who celebrate the same holidays (31% vs. 21%) as they and share political values (28% vs. 19%) and religious beliefs (28% vs. 15%). First-generation immigrants also are about three times as likely to greatly prefer neighbors of the same race or ethnicity as they (23% vs. 8%).
Immigration Attitudes Highly Correlate with Preferences for Neighborhood Sameness
Immigration Restrictionists are more likely than Expanders to greatly prefer having neighbors similar to themselves. However, the dimensions of preferred commonality vary. Hardcore Restrictionists (those who want to decrease immigration “a lot”) are 58 points more likely than hardcore Expanders (those who want to increase immigration “a lot”) to greatly prefer neighbors who speak the same language as they (80% vs 22%). Hardcore Restrictionists are also more likely than hardcore Expanders to greatly prefer neighbors who share similar “values and sentiments” (54% vs. 30%), “customs and habits” (49% vs. 24%), and who celebrate the same holidays as they (38% vs. 21%). However, Restrictionists differ little from Expanders on having neighbors with similar political values (31% vs. 28%), or similar religious beliefs (29% vs. 21%), or who are of the same race or ethnicity as them (17% vs. 15%).
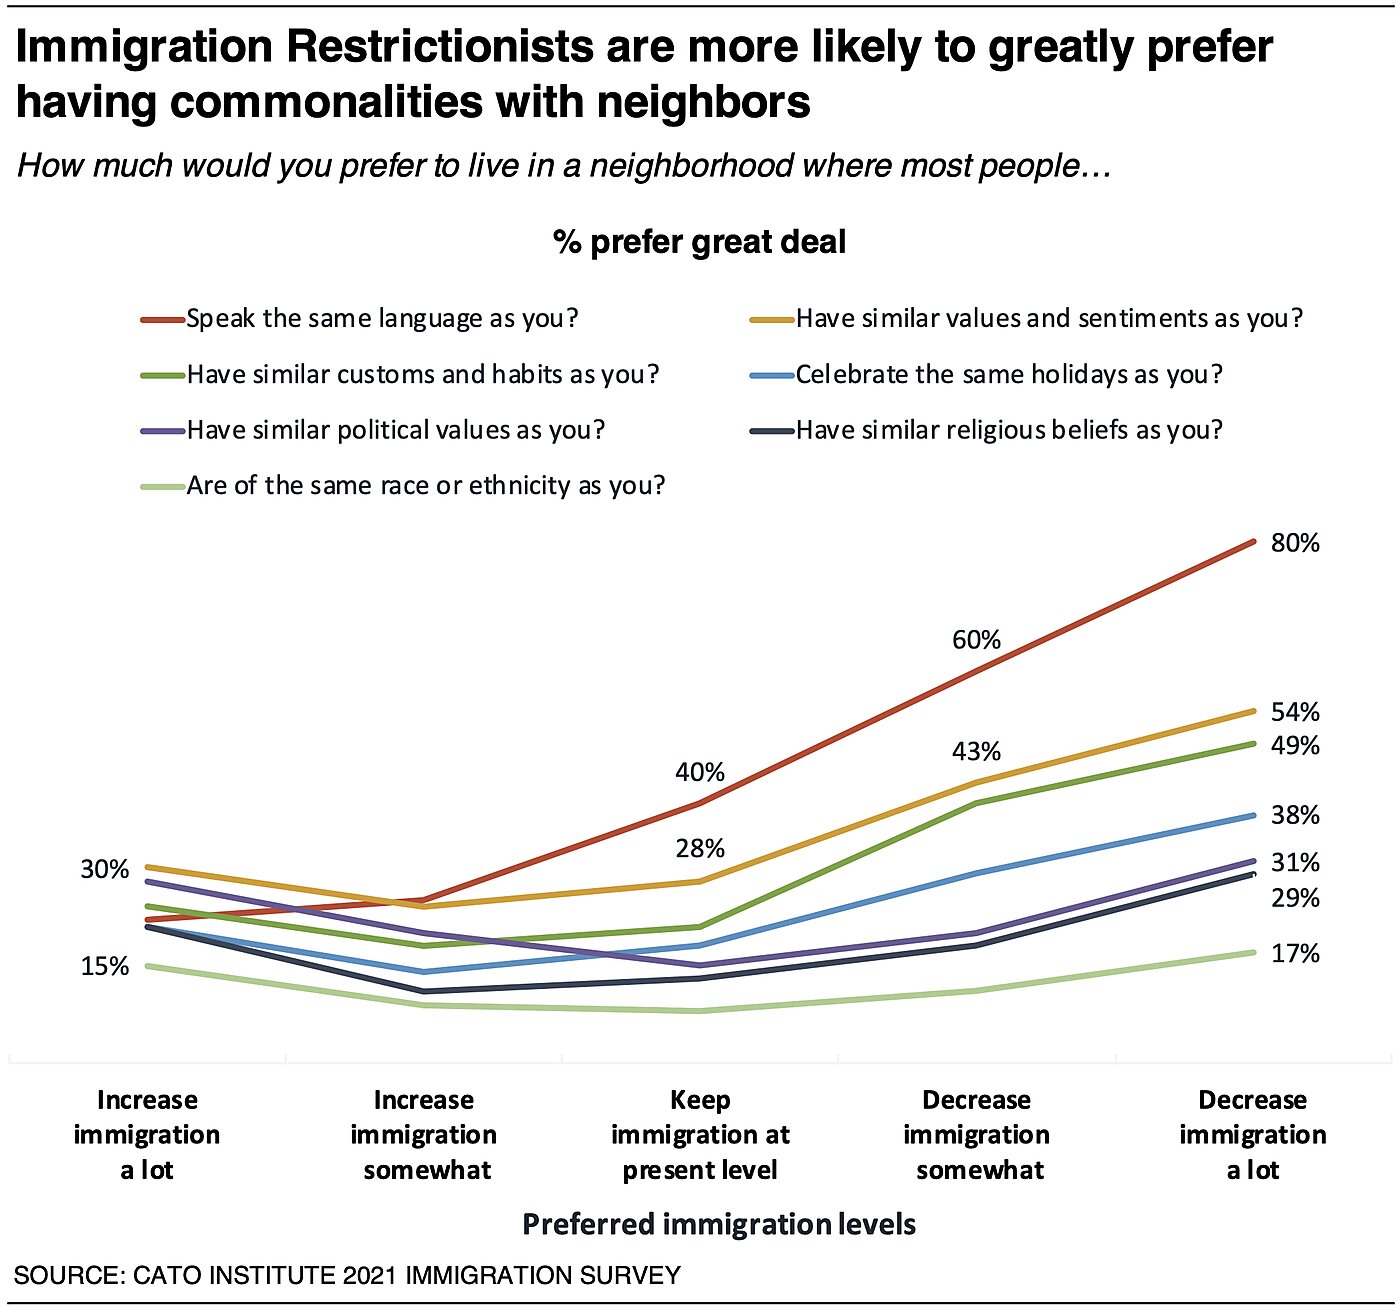
These data suggest that Americans who have above-average preferences for neighborhood commonality and relatability are more likely to want to restrict immigration.
66% Say English Fluency Is Necessary in Order to Fully Integrate into American Society
Two-thirds (66%) of Americans say speaking English is necessary in order to “fully integrate into American society.” Majorities across immigration background and partisanship agree. However, some groups feel more strongly about this than others.
Majorities of first-generation immigrants (57%), second-generation immigrants (55%), and other native-born Americans (69%) who are not second-generation immigrants believe English fluency is necessary for integration in society. Majorities of Republicans (83%), independents (60%), and Democrats (54%) also agree, but Republicans are much more universally in support.
Democrats are divided between their very liberal, liberal, and moderate wings. Thirty-five percent (35%) of very liberal Democrats believe English fluency is necessary compared to 51% of liberal Democrats and 62% of moderate Democrats.
Do Americans agree about the causes of U.S. economic wealth?
Immigration Restrictionists often raise concerns that immigration could undermine the political and economic institutions that allow the U.S. to be a prosperous country.5 Thus the survey asked what respondents think are the main reasons the U.S. is considered a rich country to ascertain if immigrants’ and native-born Americans’ views differ. However, immigrants and non-immigrants gave fairly similar answers. Partisans, however, have very different perspectives about what is responsible for the country’s economic advancement.
The top five reasons given for economic prosperity among all Americans are: freedom (44%), the free market system (39%), the U.S. Constitution (36%), democracy (35%), property rights (19%), and natural resources (19%).
Strong conservatives and liberals have dramatically different views about the reasons the United States is considered a rich country. Liberals tend to emphasize nefarious reasons such as oppression and exploitation of marginalized people and workers. Conservatives tend to focus more on political and economic institutions.
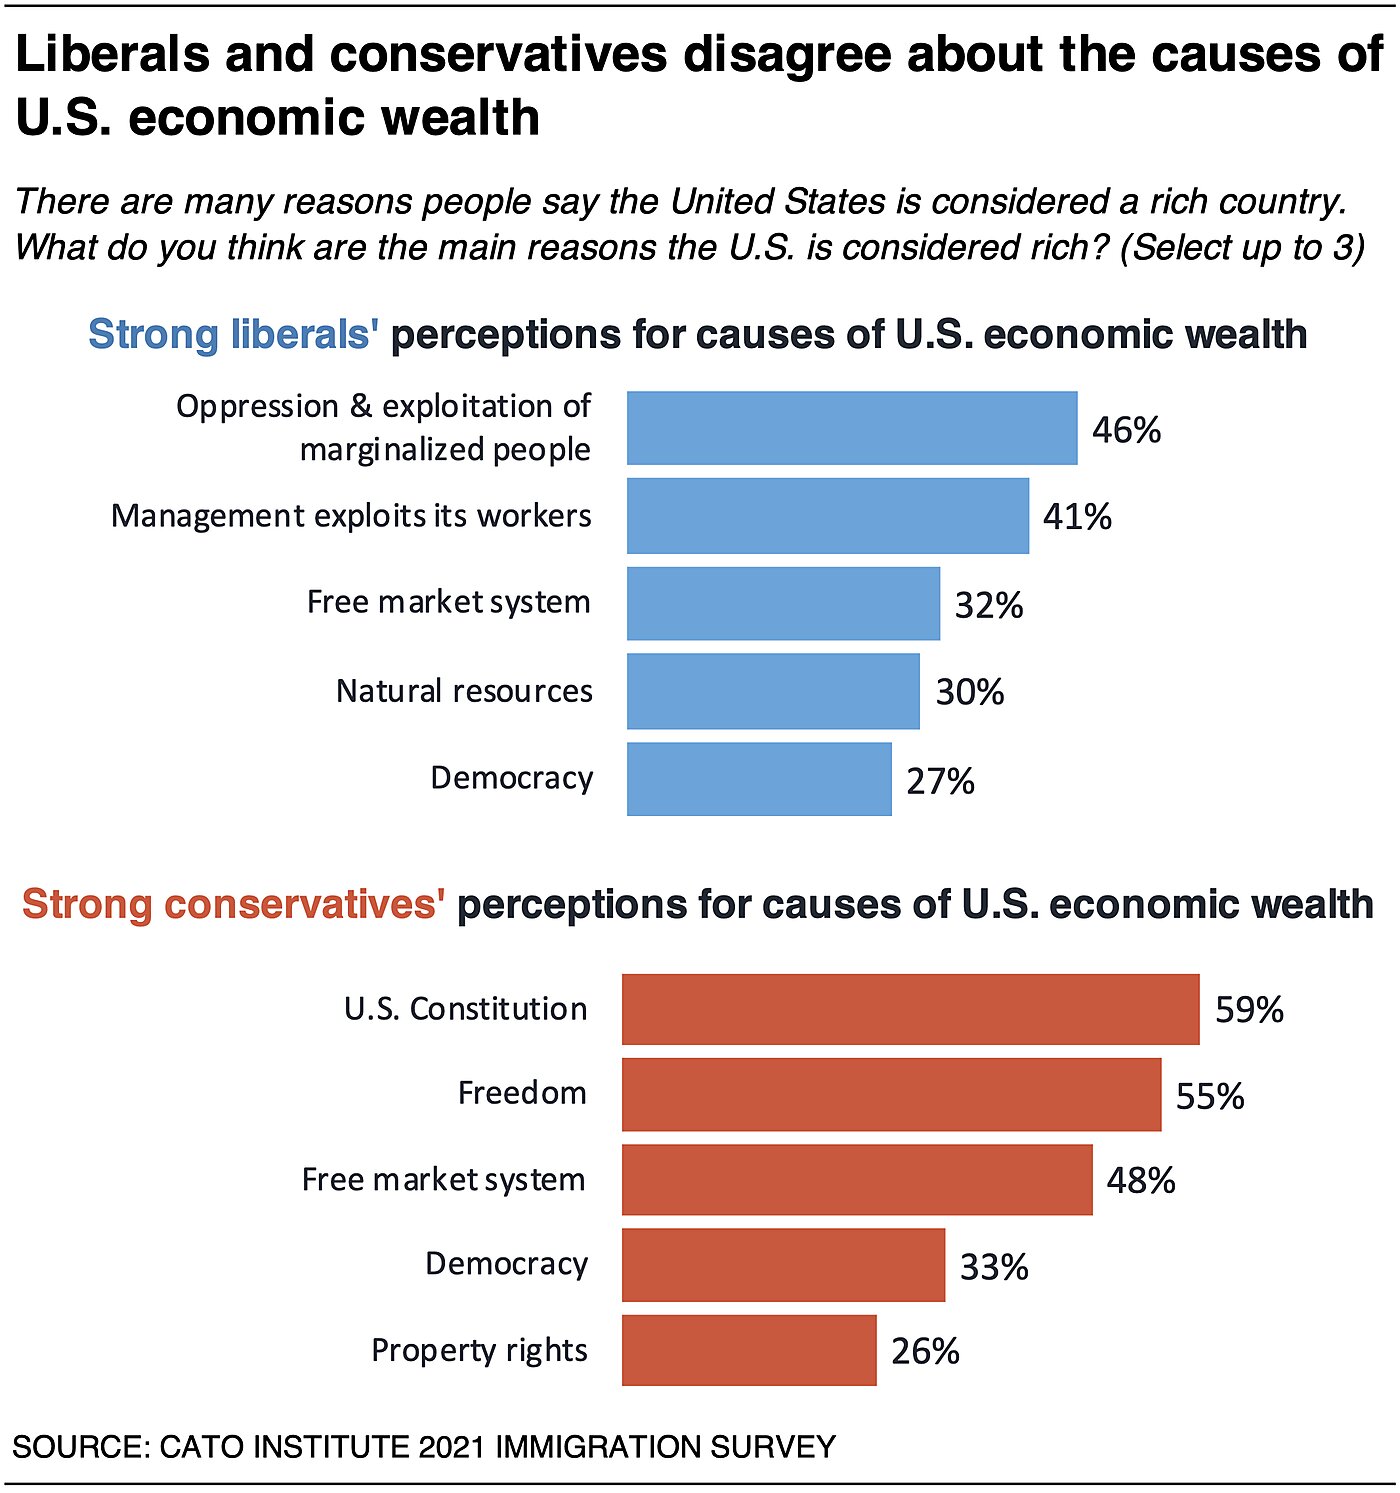
A plurality of strong liberals says that oppression and exploitation of marginalized people (46%) is the main reason, as well as management’s exploiting their workers (41%). After that about a third say the free market system (32%) and natural resources (30%) are primarily responsible and about a quarter (27%) say democracy. In contrast, majorities of strong conservatives say that the U.S. Constitution (59%) and freedom (55%) are the main causes of economic success. About half (48%) say the free market system, a third say democracy (33%), and a quarter say securing property rights (26%) are the primary causes of the nation’s wealth.
First-generation immigrants identify nearly the same top five reasons as all Americans for U.S. economic prosperity: democracy (36%), freedom (35%), the free market system (31%), the U.S. Constitution (28%), and natural resources (18%). Different views by immigration background are slight in comparison to political differences. The differences that do exist include these: first-generation immigrants are about 10 points less likely than the third generation and higher to point to the U.S. Constitution (28% vs. 38%), freedom (35% vs. 46%), the free market system (31% vs. 39%), and property rights (13% vs. 20%) as being primarily responsible.
How Do Attachments to the Nation and the World Affect Immigration Attitudes?
Attitudes about immigration may also vary according to a person’s orientation and attachment toward the nation and the world. According to the Stanford Encyclopedia of Philosophy, cosmopolitanism describes the belief that all human beings belong to a single community of world citizens. Nationalism appears to have many different definitions. Rich Lowry in his book The Case for Nationalism describes nationalism as a greater attachment to one’s fellow citizens than to those outside of the country’s borders and a concomitant desire to elevate the interests of a nation’s citizens above those outside of it. Both cosmopolitanism and nationalism can affect attitudes toward immigration policy. Furthermore, both approaches can be conducive to a more liberalized orientation to immigration, but the factors considered relevant and important will differ.
63% Say Immigration Policy Should Prioritize Interests of the U.S. and Current Citizens
Nearly two-thirds (63%) of Americans say it’s more important when making immigration policy to consider what “benefits the United States and its current citizens.” Another thirty-seven percent (37%) believe it’s more important to consider what benefits the most people regardless of nationality.
Priorities for U.S. immigration policy also correlate with preferred immigration levels. A majority (55%) of Americans who want to increase immigration want policymakers to first consider what benefits the most people no matter where they were born. But majorities of those who want to maintain current levels (56%) or decrease immigration (85%) want immigration policy to prioritize American citizens and the United States first.
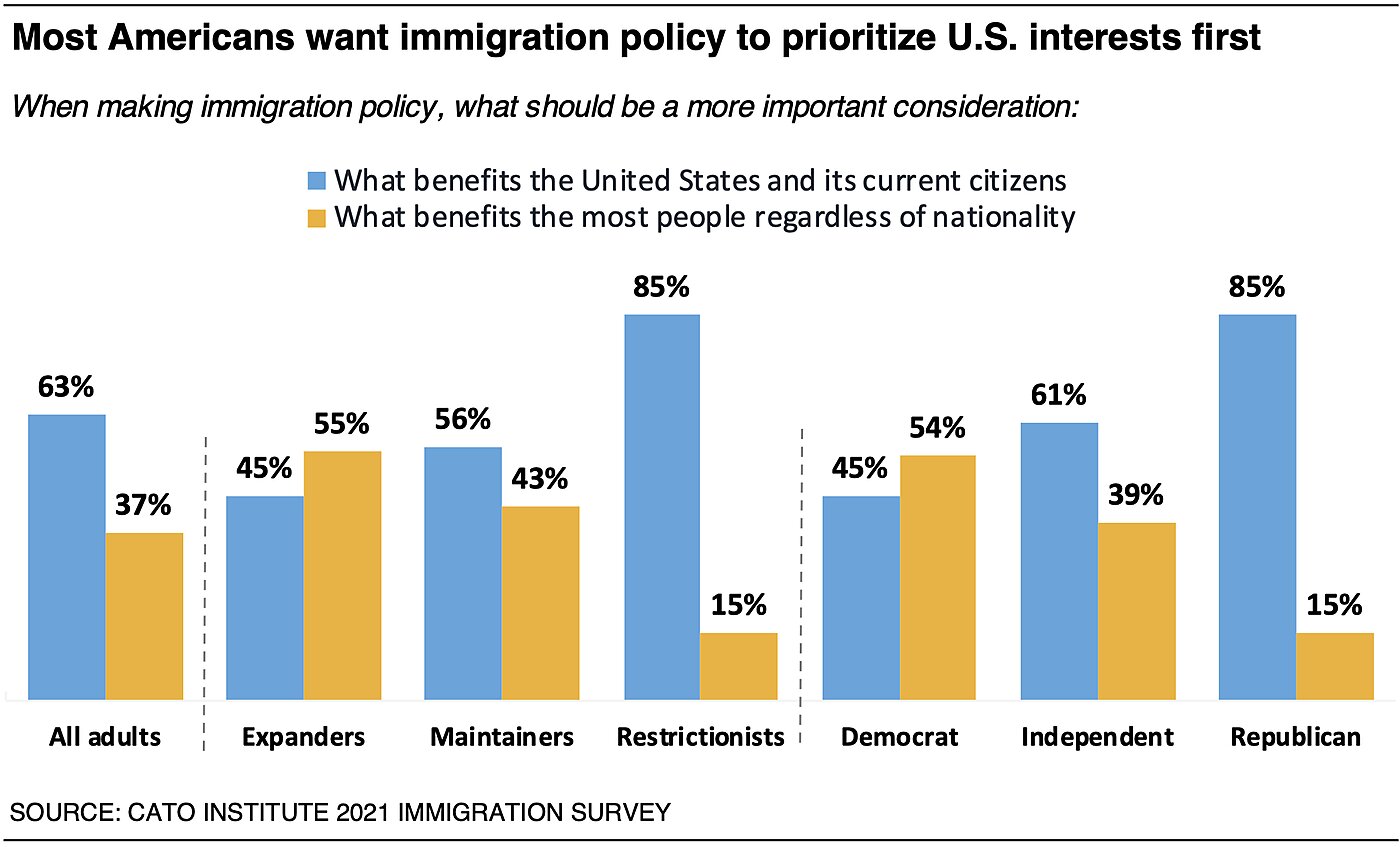
A majority (54%) of Democrats feel immigration policy should primarily consider what benefits the most people regardless of nationality. Conversely, 85% of Republicans and 61% of independents say immigration policy should elevate the interests of the U.S. and its citizens above others.’ These attitudes highly correlate with ideology as well. Fully 68% of strong liberals say U.S. immigration policy should benefit the most people regardless of nationality, while 88% of strong conservatives say immigration policy should consider U.S. interests first.
Views do not vary much by immigration background. First-generation citizen immigrants (57%) are about as likely as second-generation immigrants (55%), and other native-born Americans (64%) who are not second-generation immigrants to say U.S. immigration policy should put the United States’ and current citizens’ interests first.
58% of Strong Liberals View Themselves as Global Citizens
About a quarter (26%) of Americans view themselves more as a “global citizen than a citizen of the United States.” A plurality (48%) disagrees, and 26% aren’t sure.
Primary identification with the world or the nation correlates highly with beliefs about immigration levels. Sixty-one percent (61%) of Expanders who want to increase immigration “a lot” view themselves more as global citizens. In contrast 79% of Restrictionists who want to decrease immigration “a lot” view themselves more as citizens of the U.S. Those who want to keep immigration levels the same are about twice as likely to view themselves first as U.S. citizens (44%) than global citizens (20%).
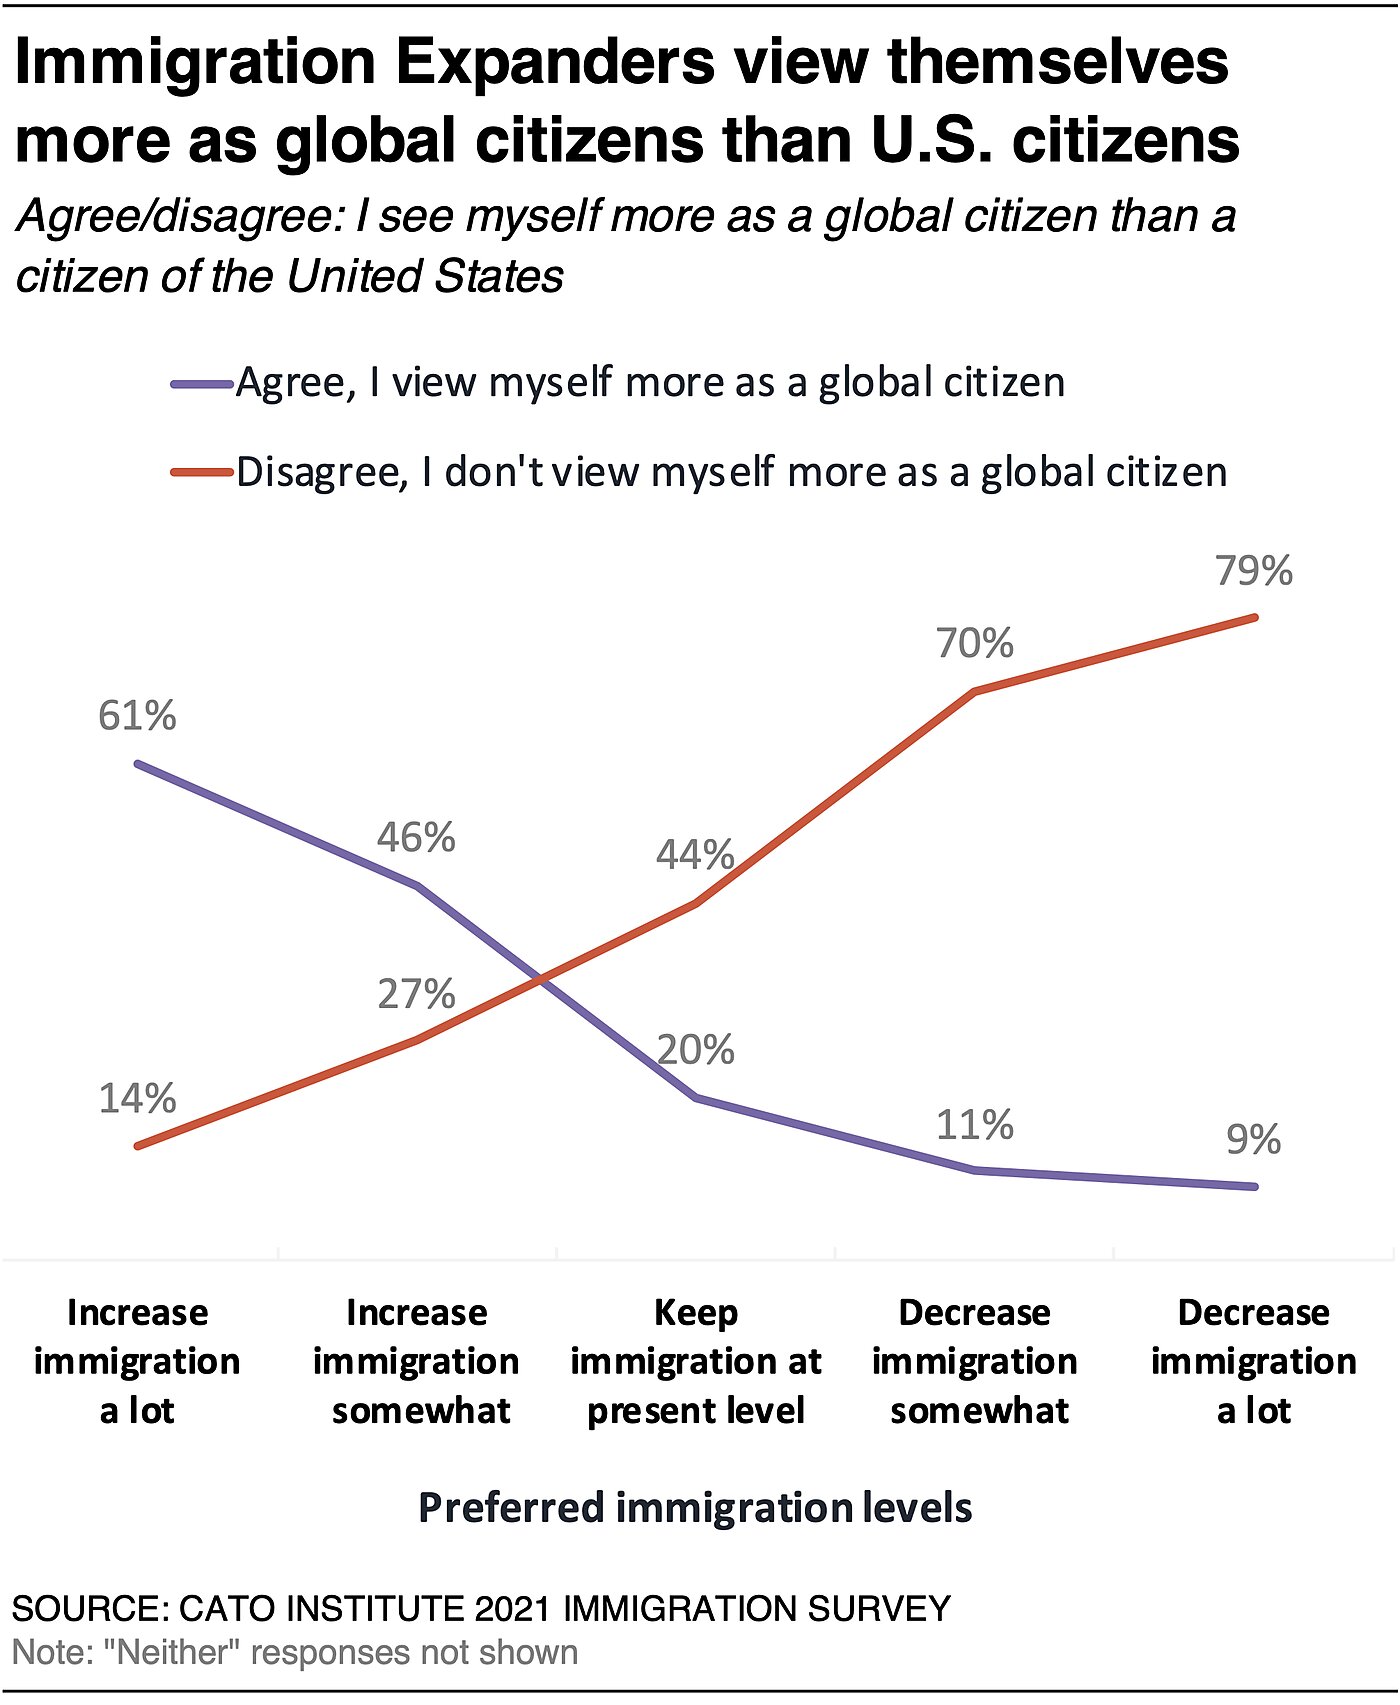
Attachment to global versus national citizenship also varies with political ideology and immigration background. A majority (58%) of strong liberals view themselves more as global citizens than U.S. citizens, compared to 39% of moderate liberals. Nearly-three fourths (71%) of conservatives disagree that they view themselves as global citizens.
About half (48%) of first-generation immigrants say they view themselves more as global citizens than as citizens of the United States. This is more than twice the share (21%) of native-born Americans who are not second-generation immigrants who agree. Second-generation immigrants fall in between with 33% who view themselves primarily as world citizens.
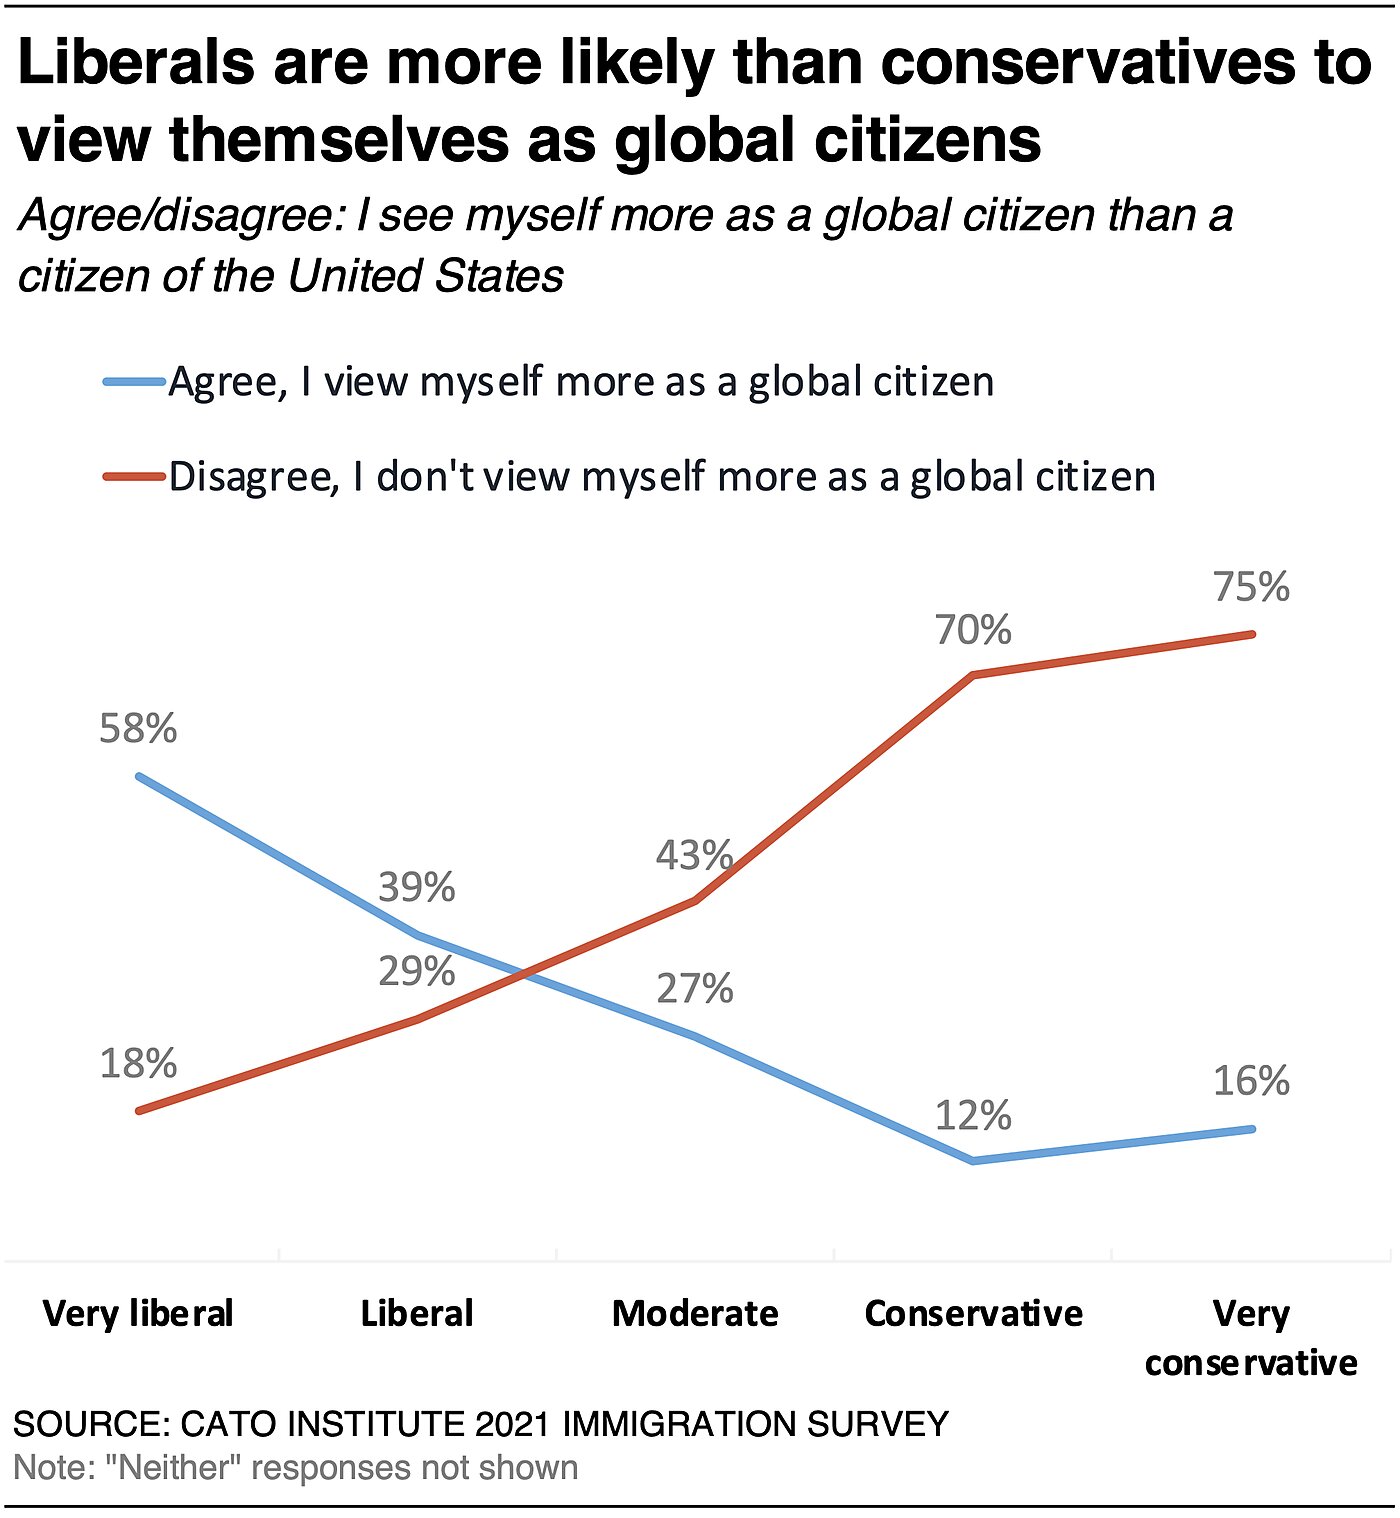
Thought Experiment
To Whom Do You Feel Closer: A Stranger in the U.S. or a Stranger in Another Country?
The survey took an unconventional approach to examining attachments to country and fellow citizens. Survey respondents were split into two groups. One group was asked if they feel a “closer attachment” to “a person living in Jackson, Wyoming,” or “a person living in Paris, France,” or if they “feel the same toward both.” The second group was asked if they feel a closer attachment to a person living in Jackson, Wyoming, or “a person living in Mexico, City, Mexico,” or if they feel about the same toward both. The purpose of the question was to ascertain if a person feels more attachment to a stranger who resides within his or her own country’s borders, or someone outside the country, or if the person feels equally toward both. Jackson, Wyoming was selected because it’s known but has a small population and thus respondents were less likely to have personal friends and family in the area.
Americans are divided, with about half (46%) saying they feel a closer attachment to a person in Jackson, Wyoming, 44% saying they feel similarly attached to a person in Wyoming or Paris, and 10% saying they feel closer to someone in Paris. Similarly, 39% feel closer to a stranger in Wyoming, 51% feel equally close to someone in Mexico City or Wyoming, and 10% feel closer to someone in Mexico City.
Immigration attitudes highly correlate with these attachments. In the first group: Restrictionists are far more likely than Expanders to feel attached to the American stranger in Wyoming (68% vs. 33%). Instead, Expanders are more likely than Restrictionists to feel the same towards both hypothetical Parisian and American strangers (48% vs. 29%) or to feel closer to the Parisian stranger (19% vs. 3%). A similar pattern is found among the second group. Restrictionists are far more likely than Expanders to feel closer to an American stranger than a stranger in Mexico City (60% vs. 26%). On the other hand, Expanders are far more likely than Restrictionists either to feel the same toward both (58% vs. 36%) or to feel closer to the Mexico City stranger (15% vs. 4%).
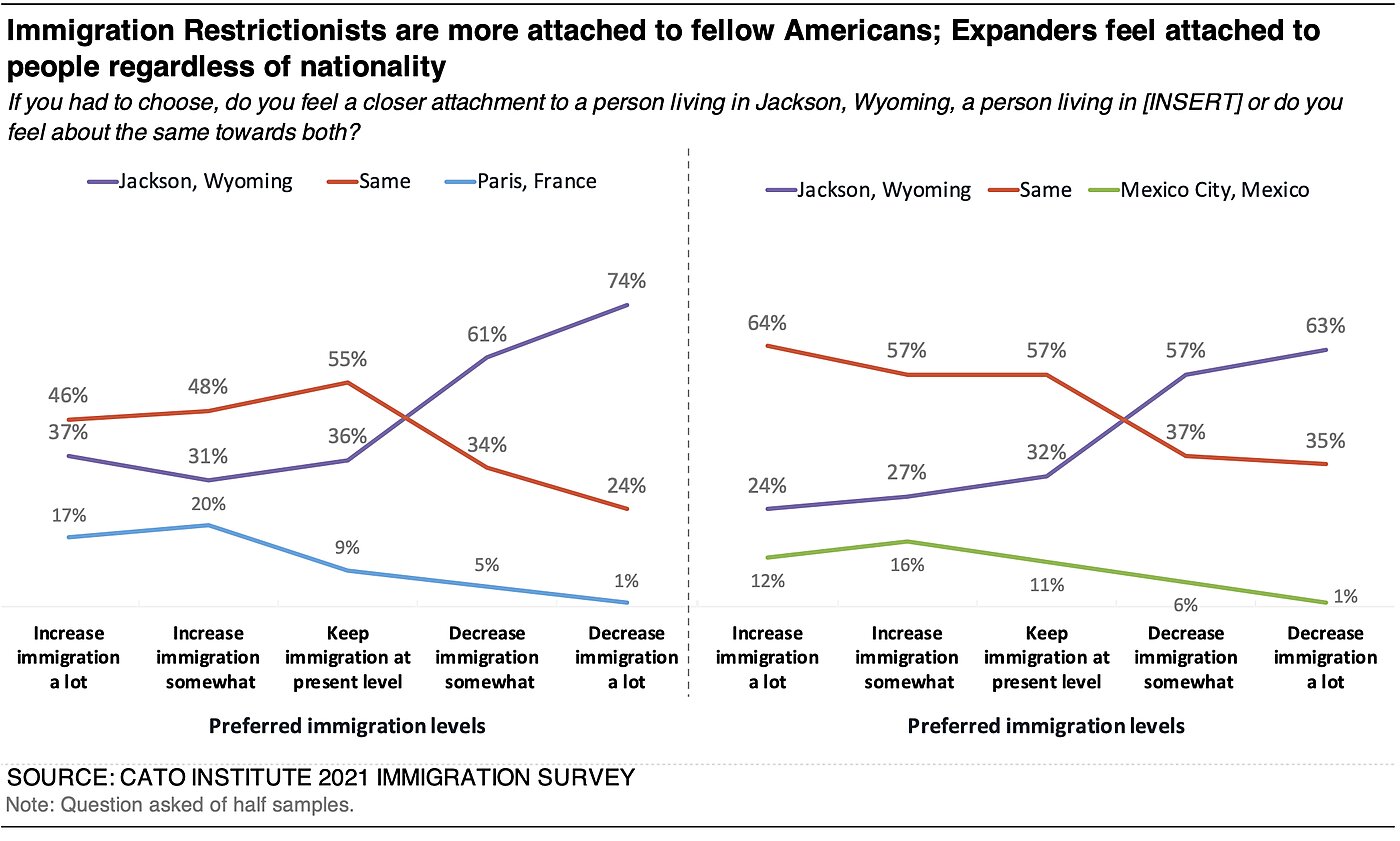
A majority of Democrats feel an equal connection to both the American-born and foreign-born strangers in both samples (57% in the Paris example and 64% in the Mexico City example); whereas Republicans feel a stronger connection to American-born strangers (70% in the Paris example and 61% in the Mexico City example).
Feelings also vary by immigration background. For instance, the share who feel a closer attachment to a stranger in Wyoming than Paris are as follows: 35% among the first generation, 41% among the second generation, 45% among the third generation, and 50% among the fourth generation and higher.
These results demonstrate that even when personal relationships are not considered, some Americans feel a stronger bond to their fellow Americans residing within their own borders. Others feel equally attached to strangers within their country and strangers outside their country. And then others feel a closer attachment to those outside of their country. Thus borders are not as meaningful for these individuals when constructing their attachments to people outside their own social circles. How people form attachments to people they don’t know on the basis of national boundary (or not) may influence their views on immigration as well.
66% View America’s History and Founding as Part of Their Own History
Even though many Americans do not have an ancestor directly involved in the nation’s founding, a large majority of Americans feel a strong connection to the country’s history and founding. The survey found that nearly two-thirds (66%) view “America’s history as [their] own history” and the “founders of the United States as [their] forefathers.”
Although most Americans agree, their intensity of agreement differs. For instance, majorities of Democrats (52%), independents (56%), and Republicans (88%) feel a connection to the country’s history and founding. But Republicans’ feel a stronger connection—65% “strongly agree” they view America’s history as their own compared to 35% of independents and 22% of Democrats.
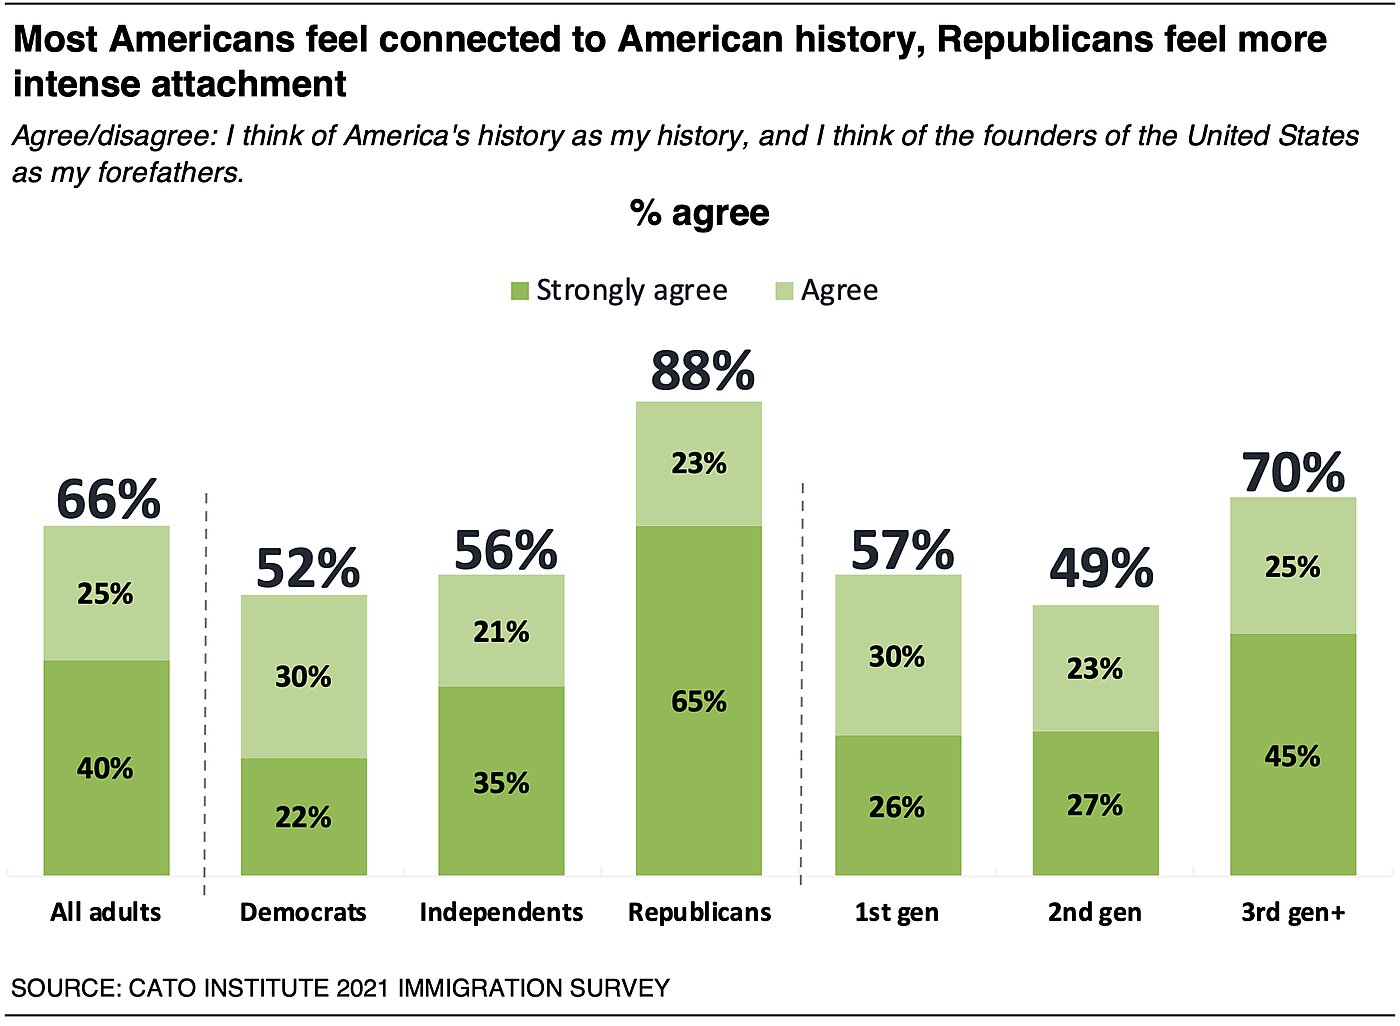
Majorities of both first-generation immigrants (57%) and native-born Americans (70%) who are not second-generation immigrants think of America’s history as their own. Second-generation immigrants are somewhat less likely to agree, but half do (49%).
Immigration Restrictionists feel a closer bond with the nation’s history. Eighty-two percent (82%) think of America’s history as their own, including 63% who strongly feel this way. Majorities of Expanders (57%) and Maintainers (59%) also see themselves as heirs to the country’s history—but less intensely than Restrictionists. Those who feel a deep attachment to the country’s history may be more concerned about the potential for the U.S. to change and have a stronger desire that others share in this attachment. It may also be a fear of change from the past.
82% of Americans Are Patriotic
An overwhelming majority (82%) of Americans say they are patriotic, including 45% who say they are “very patriotic” and 37% who are “somewhat patriotic.” Another 12% say they are “not very patriotic” and 6% feel “not at all patriotic.”
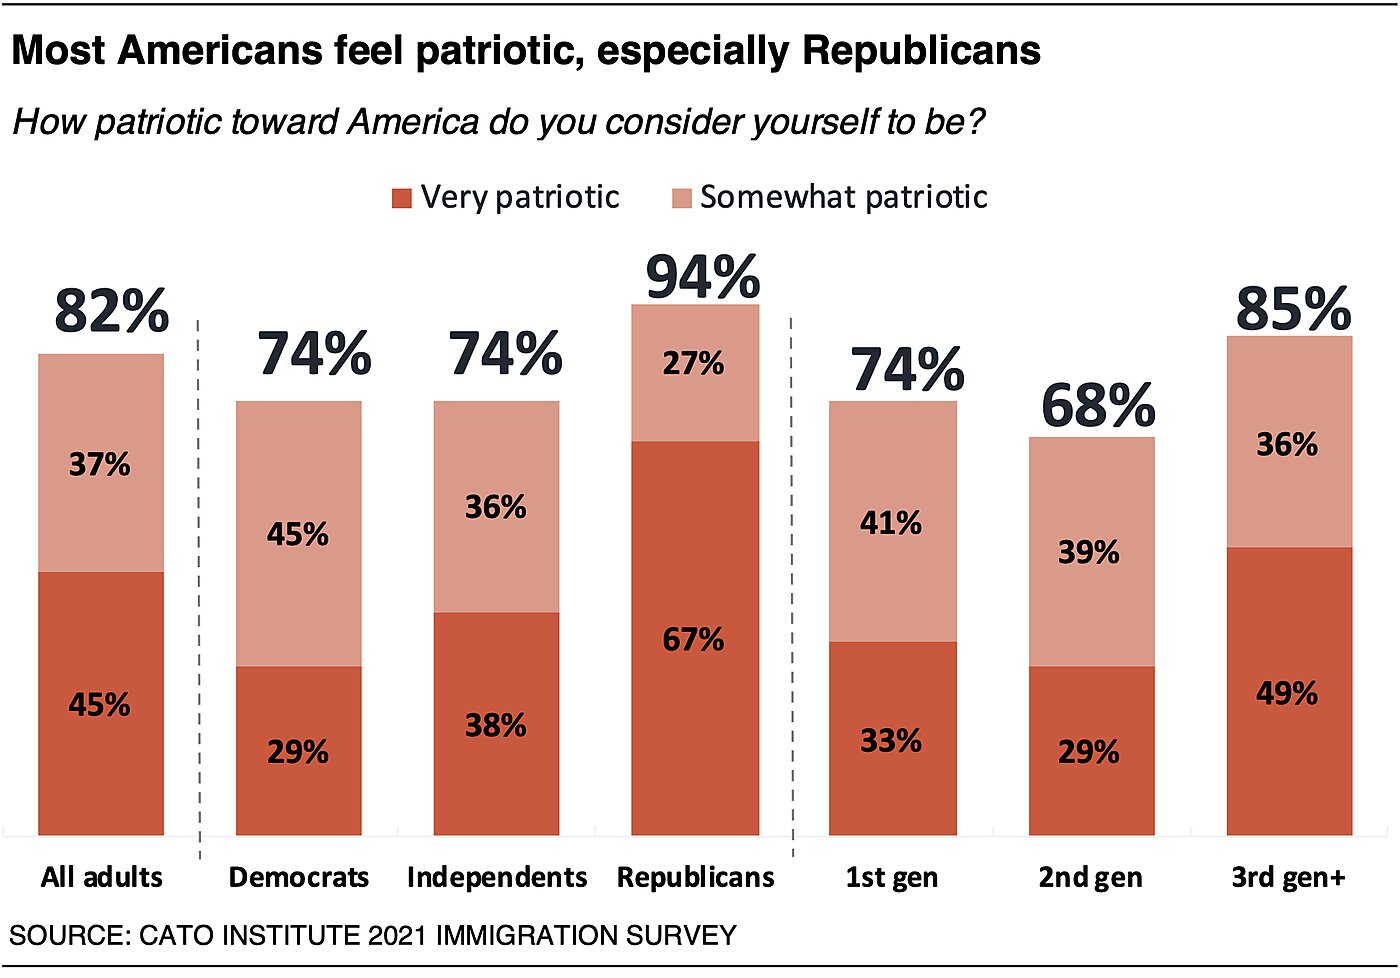
Both majorities of Democrats (74%) and Republicans (94%) are patriotic. However, Republicans (67%) are more than twice as likely as Democrats (29%) to say they are “very” patriotic.
These differences map onto immigration attitudes. While majorities of immigration Expanders (74%), Maintainers (80%), and Restrictionists (90%) all view themselves as patriotic, intensity varies. About a third (31%) of immigration Expanders view themselves as “very patriotic,” as do 38% of Maintainers. In contrast, 60% of immigration Restrictionists (and 71% of hard-core Restrictionists) view themselves as “very patriotic.”
53% of Immigration Restrictionists Say Being American Is “Extremely” Important to Their Identity
Most Americans (61%) say being American is either “extremely” (35%) or “very” (26%) important to their identity. A quarter (24%) say it’s “moderately” important to their identity, and 15% say it’s not important.
Republicans (77%) are about 25 points more likely than Democrats (49%) and independents (53%) to say their American identity is extremely or very important to them. A similar pattern is found by immigration attitudes.
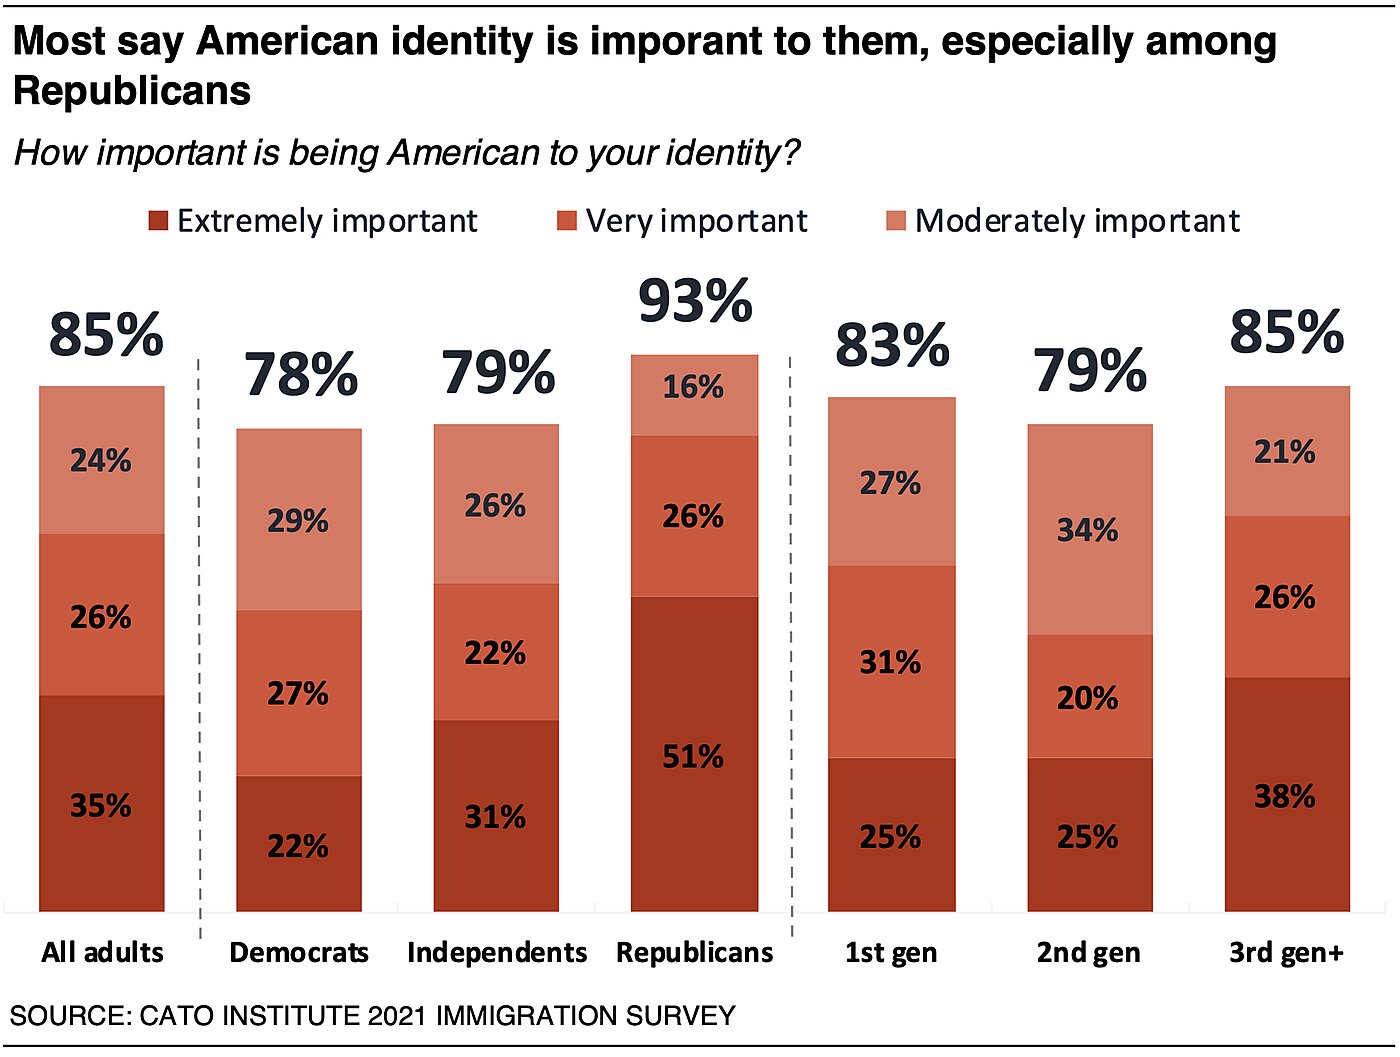
People who want to decrease immigration to the United States are much more likely to feel a strong connection to their American identity. Immigration Restrictionists (80%) who want to decrease immigration a lot are about twice as likely as Expanders (44%) who want to increase immigration a lot to be extremely or very attached to their American identity. Taking intensity into account, 63% of hard-core Restrictionists say this identity is “extremely important” to them compared to 20% of Expanders—a 43-point difference.
Immigrants are similar to Americans overall in an attachment to their American identity. A majority (56%) of first-generation immigrants as well as 64% of the third-generation and higher feel extremely or very attached to their American identity. Second-generation immigrants are about 20 points less attached than other native-born Americans, with 45% who say their American identity is extremely or very important to them.
Section 4: Perspectives from Immigrants and the Second Generation
53% of First- and Second-Generation Immigrants Say Families Came to the U.S. for Economic Opportunities
A majority (53%) of first- and second-generation immigrants say the main reason they or their parents immigrated to the United States was for economic opportunities. More than a quarter (29%) came for freedom. About a fifth say they came to be with family (20%) or to flee political persecution (17%) or violence (17%). Another 15% say they came for their children to attend U.S. public schools, 12% came to attend a college or university, 12% were fleeing religious persecution, and 8% came for government services and benefits.
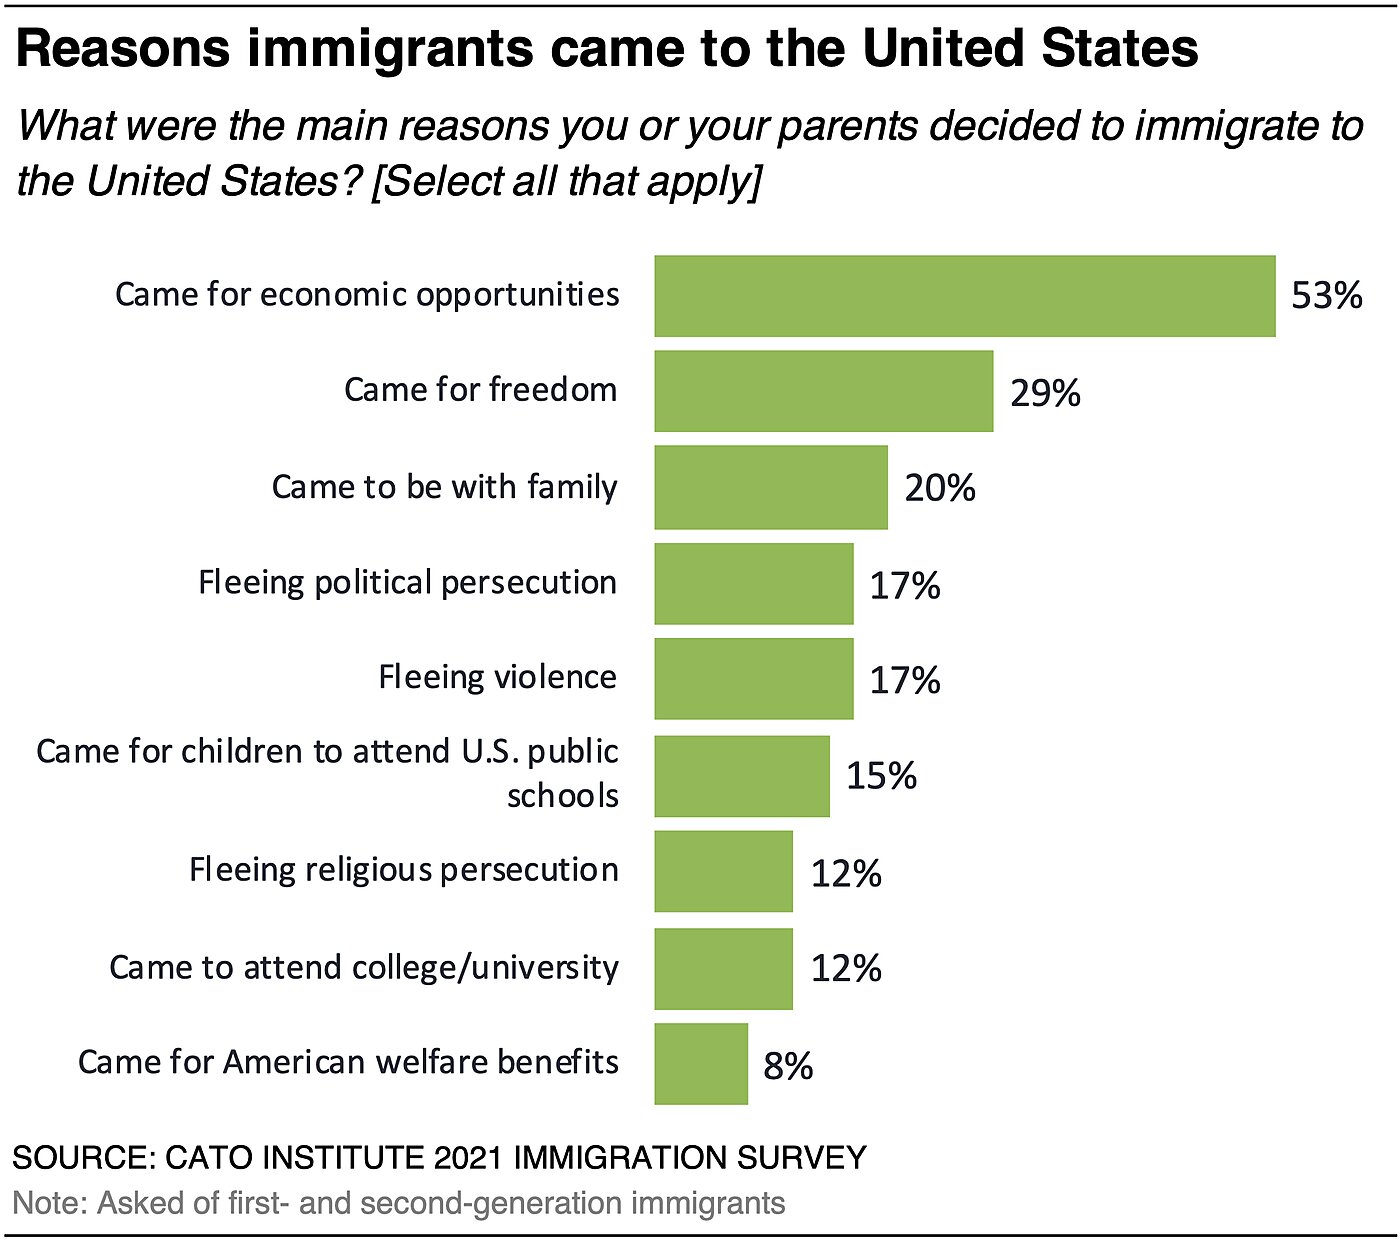
80% of Immigrants Feel Grateful to Be Americans
An overwhelming majority of first-generation immigrants (80%), second-generation immigrants (81%), and other native-born Americans (90%) say they feel “grateful to be an American.”
Intensity varies, with first-generation immigrants (46%) being less likely than native-born Americans (66%) who are not second-generation immigrants to “strongly agree.” Second-generation immigrants fall in between, with 50% who strongly agree they are grateful to be Americans.
Immigrants Have More Favorable Views of the Country than U.S. Liberals
Three-fourths of first-generation (75%) and second-generation (74%) immigrants have favorable feelings toward the United States, as do 81% of other native-born Americans who are not second-generation immigrants.
Immigrants (75%) have more favorable views of the U.S. than very liberal respondents, among which 60% have a favorable view. Eighty percent (80%) of moderates and 89% of conservatives also have favorable views of the country.
74% of Immigrants Say They Feel Patriotic
Nearly three-fourths (74%) of first-generation immigrants, 68% of second-generation immigrants, and 85% of other native-born Americans say they feel very or somewhat patriotic toward the United States.
Native-born Americans who are not second-generation immigrants are more likely to feel “very patriotic” (49%) compared to 33% of first-generation and 29% of second-generation immigrants.
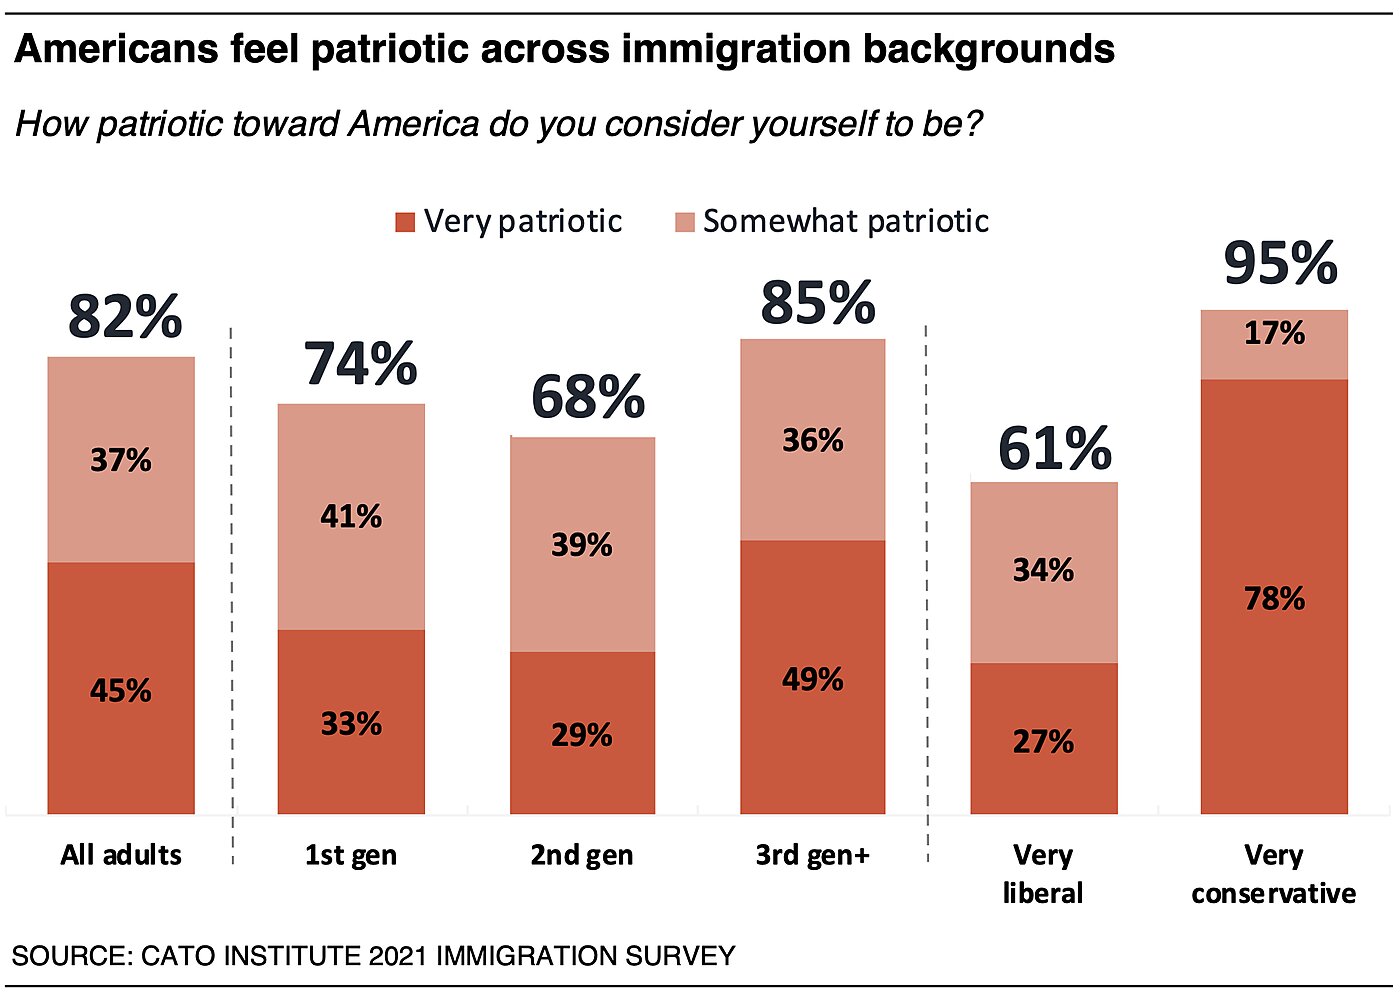
Immigrants feel more patriotic toward the United States than strong liberals (74% vs. 61%) and less patriotic than conservatives (95%).
Immigrants Are Patriotic despite Experiences of Being Treated like an Outsider
Nearly three-fourths (74%) of first-generation immigrants and 68% of second-generation immigrants say they consider themselves to be patriotic. They feel this way despite reporting more experiences in which they have been made to feel like an outsider. Immigrants are more likely to report experiences in which people assumed they were not American, confused them for a service worker at a store, called them racial slurs, and made negative comments about the food they ate. This has led many immigrants to feel like they get judged more than other people and that others don’t view them as adequately American.
A majority (51%) of first-generation immigrants report that people often or occasionally have assumed they are not American while 26% say this rarely happens and 23% report it has never happened to them. In contrast, only 10% of native-born Americans who are not second-generation immigrants say their American identity has been frequently questioned, 14% say this has happened rarely, and 76% say this has never happened. Second-generation immigrants fall in between: 34% say this has happened frequently, 25% say rarely, and 41% say no one has ever assumed they were not American. Asian (46%) and Latino (33%) Americans are more likely than Black Americans (24%) and much more likely than White Americans (10%) to report that people often assume they are not American.
First-generation immigrants (45%) are more likely than second-generation immigrants (34%) and other native-born Americans (31%) to have often or occasionally been confused for a service worker at a store where they did not work.
First-generation Latino immigrants (38%) and Asian immigrants (32%) are about twice as likely as native-born Americans (20%) (and native-born White Americans (16%)) to have often or occasionally been called a racial slur. Native-born Black Americans are about as likely as Latino and Asian immigrants to have been called a racial slur often or occasionally (32%). Another way to look at the data is the percentage of people who say this has “never” happened to them. A majority (54%) of native-born Americans and 59% of native-born White Americans say they have “never” been called a racial slur. In contrast, far fewer first-generation Latino (26%) and Asian (37%) immigrants or second-generation Latino (40%) and Asian (32%) immigrants also say they’ve never been called a racial slur. Similar to first-generation Latino Americans, 29% of native-born Black Americans also report they have never been called a racial slur.
First-generation immigrants (40%) also are twice as likely as native-born Americans (20%) who are not second-generation immigrants to say people have made negative comments about the food they ate. Second-generation immigrants fall in between, with 27% who say this has frequently happened to them.
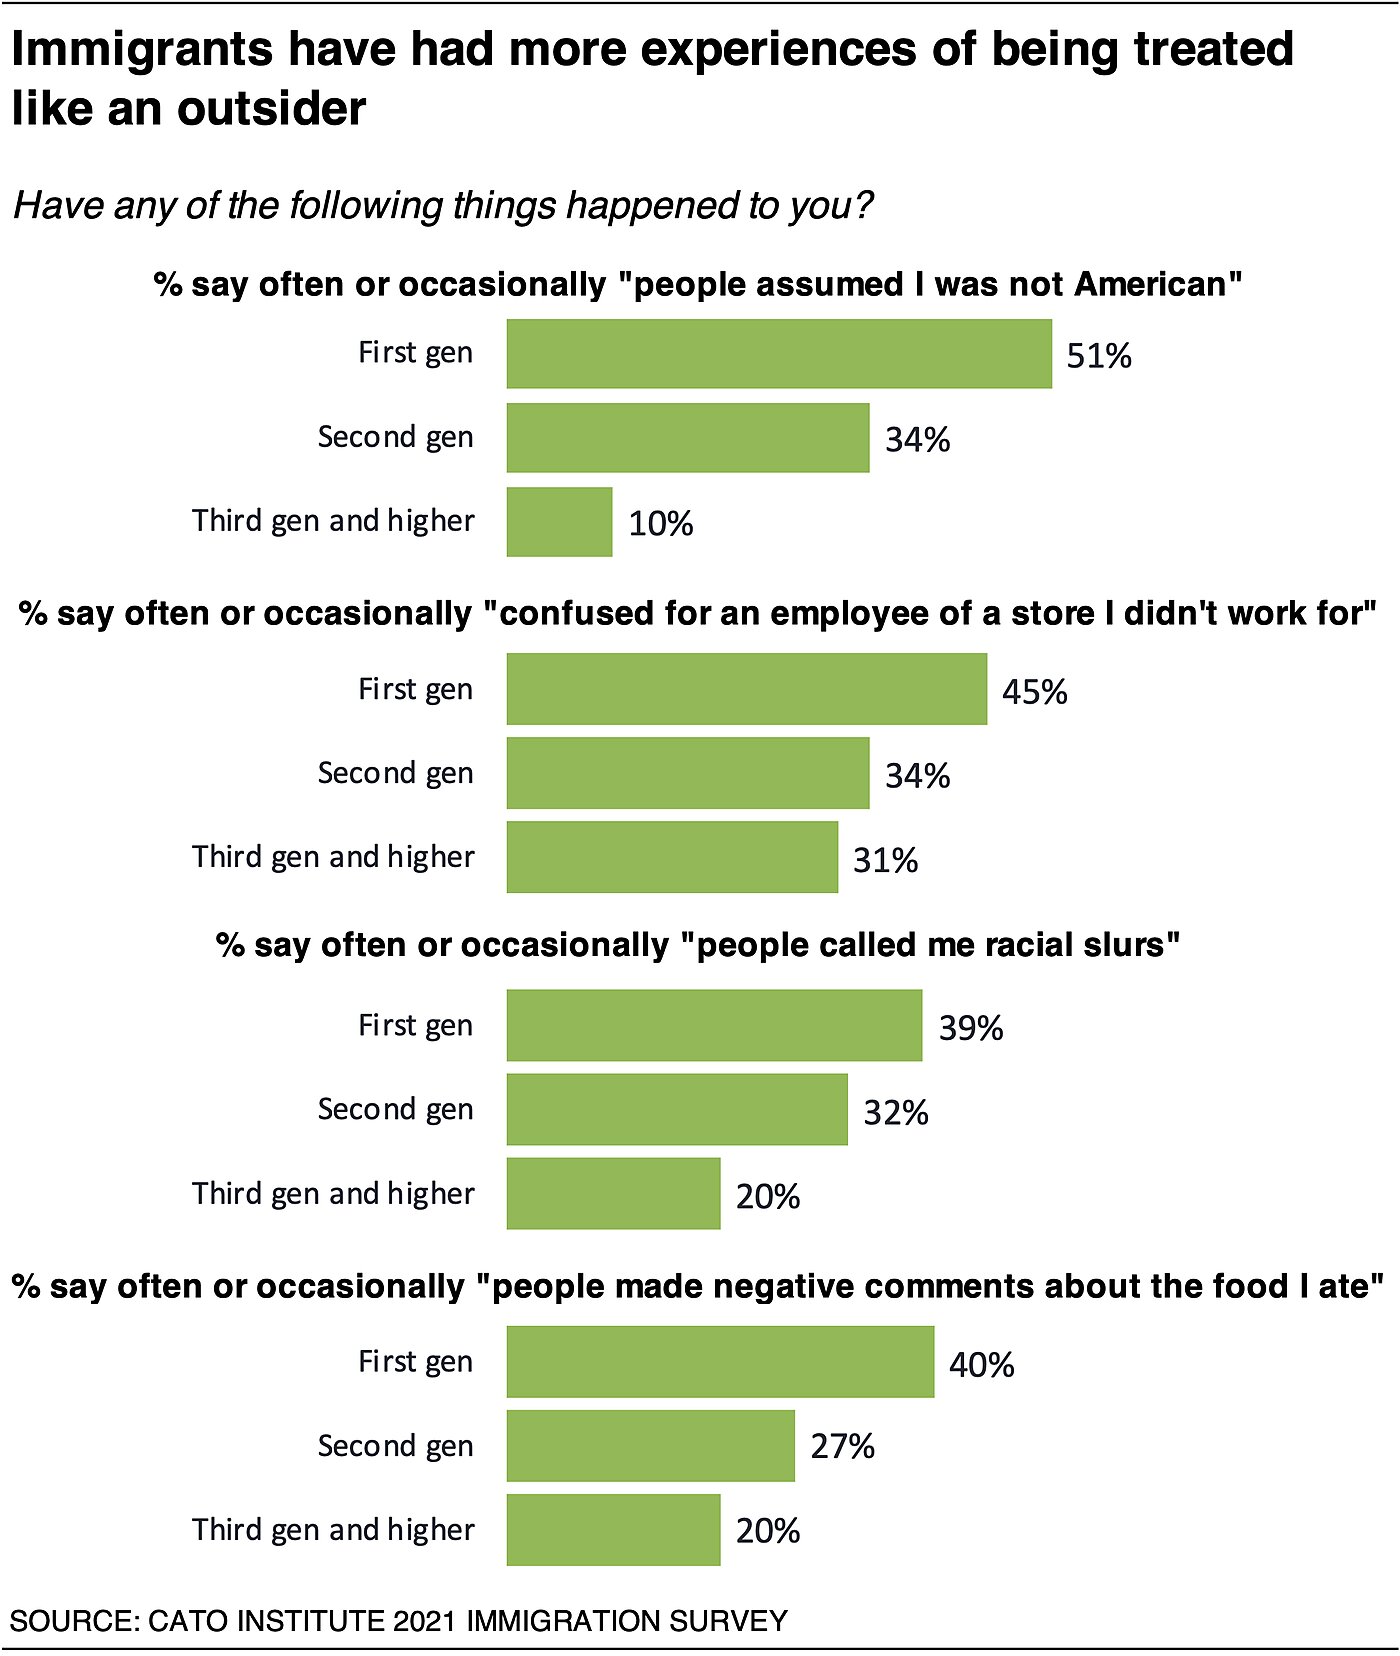
Immigrants and People of Color Feel They Are Not Seen as “American Enough”
A majority of first-generation immigrants (67%), including Latino (71%), Asian (66%), and white (61%) immigrants say they feel that “people like me are not seen as being American enough.” This extends into the second generation among Latino (59%) and Asian (59%) Americans but only 27% of second-generation White Americans. Among the third generation and higher, half of Asian (51%) and Black (50%) Americans feel like they are not viewed as sufficiently American. In contrast, majorities of Latino (67%) and White (86%) Americans have not felt similarly judged.
These results map onto the share of immigrants who feel that people like them “get judged more than others.” Majorities of first-generation Latino (66%), Asian (62%) and white (56%) immigrants, second-generation Latino (50%) and Asian (65%) immigrants, and the third generation and higher native-born Black (76%) and Asian (54%) Americans—all feel they get judged more than other people. In contrast, fewer native-born White (29%) and Latino (44%) Americans who are not second-generation immigrants feel judged.
Taking these results together helps explain why about half (47%) of first-generation immigrants feel that America is more “racist than most other countries” as do 37% of second-generation immigrants, compared to 29% of other native-born Americans who are not second-generation immigrants.
57% of Immigrants Think of American History as Their Own
Majorities of both first-generation immigrants (57%) and native-born Americans who are not second-generation immigrants (70%) think of America’s history as their own. Second-generation immigrants are somewhat less likely to agree, but half do (49%).
56% of Immigrants Say Being American Is Very Important to Their Identity
A majority (56%) of first-generation immigrants and about half (45%) of second-generation immigrants feel that being American is “extremely” or “very” important to their identity. Sixty-four percent (64%) of native-born Americans who are not second-generation immigrants agree.
For earlier generations of immigrants, their racial identity matters about same as their American identity. Fifty-seven percent (57%) of first-generation immigrants and 47% of second-generation immigrants feel their racial identity is extremely or very important to them. Native-born Americans (39%) who are not second-generation immigrants are less likely to agree.
Among Latino Americans, racial identity is more important than American identity among the first generation (70%, 57%) and the second generation (65%, 55%) but reverses among the third generation and higher (62%, 69%). Asian Americans across immigration backgrounds are about equally likely to say their racial identity and American identity are very important to them: first generation (50%, 49%), second generation (50%, 40%), and third generation and higher (58%, 59%). White Americans across immigration backgrounds are more likely to say their American identity is very important than they are to say their racial background is very important: first generation (62%, 46%), second generation (43%, 28%), and third generation and later (63%, 31%). The share of Black immigrants in the sample was too small to calculate and compare responses.
Immigrants Feel Connected to More than One Identity
As noted above, American identity can be one of many identities to which people feel attached. Writing for the Washington Post, Mariya Manzhos an immigrant from Ukraine explained what it was like to feel an attachment to more than one identity:
“Like many immigrants in the United States, I straddled two cultures, belonging to both and neither. I welcomed the tension because each culture brought out my affinity for the other. Leaving Ukraine, I packed a notebook filled with my favorite Ukrainian poems. When homesick, I whispered them to myself like little prayers. The cadence of the soothing Ukrainian words reminded me of belonging. But when I visited Ukraine, I longed for the things I missed in America: the casual dress code, the openness, the root beer and pizza. ‘I love being here and there,’ I wrote in my journal. In between felt like freedom.”
The survey asked the extent to which people considered themselves American and/or something else. About half (48%) of first- and second- generation immigrants say they feel completely American, while 38% feel partially American and partially something else (including 12% who feel mostly American and partially something else, 16% who feel equally American and something else, and 11% who feel mostly something else and partially American). Only 8% say they do not feel American at all, and 5% aren’t sure.
Sole attachment to one’s American identity increases considerably from the first to the second generation, rising from 38% to 57%. And the share who feel attached mostly to something besides their American identity declines from 27% to 12%.
About Half of Immigrants View Themselves as Global Citizens
About half (48%) of first-generation citizen immigrants view themselves more as global citizens than as U.S. citizens. A third (33%) of second-generation immigrants feel more like global citizens, as do about a fifth (21%) of other native-born Americans who are not second-generation immigrants.
Views about Capitalism, Socialism, and the Role of Government in Society
Mentioning Taxes Diminishes the Gap between Immigrants and Non-Immigrants on the Role of Government
At first glance, immigrants tend to favor larger government more than native-born Americans. About two-thirds of first-generation immigrants (64%) and second-generation immigrants (69%) prefer a “larger government providing more services” instead of a “smaller government providing fewer services.” In contrast, about half (51%) of native-born Americans who are not second-generation immigrants agree.
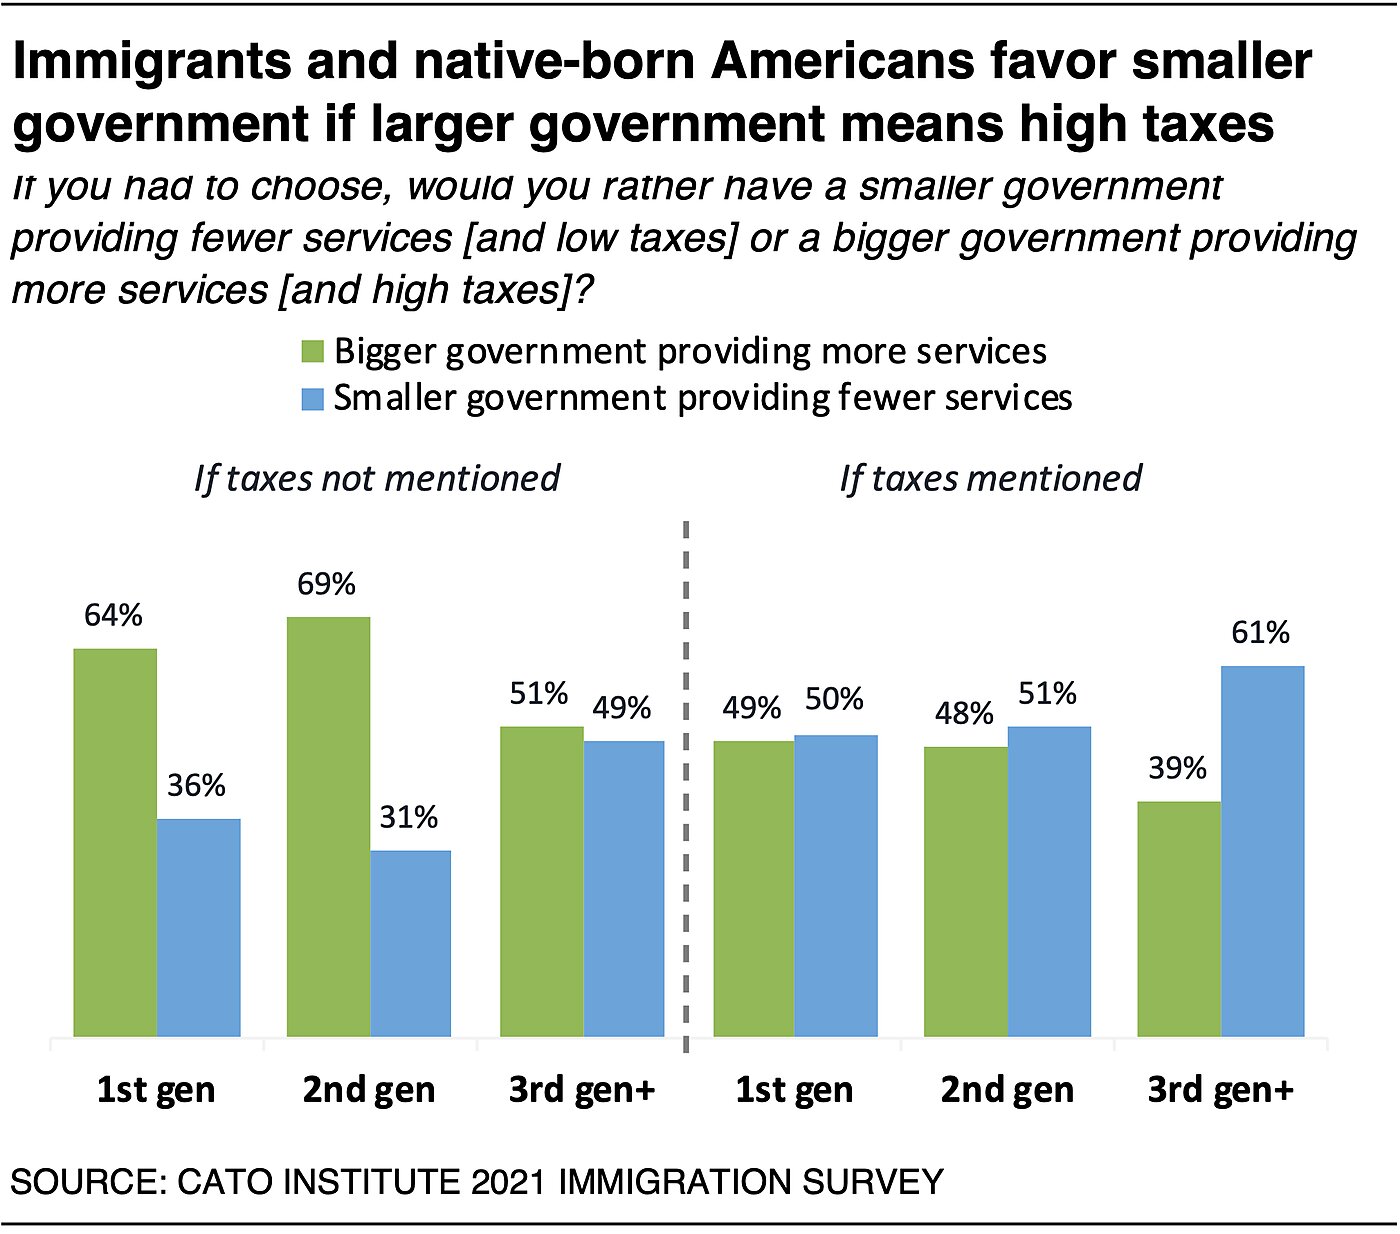
Views change and the gap narrows when taxes are mentioned in the survey question. Survey respondents were split into two groups. The first group was asked if they favor larger or smaller government that provides more or fewer services. The second group was asked this same question, but with tax rates specified: would they prefer a “larger government providing more services and high taxes” or a “smaller government providing fewer services and low taxes”? If larger government requires high taxes, 50% of first-generation, 51% of second-generation, and 61% of the third generation and higher prefer smaller government, fewer government services, and low taxes.
First-generation immigrants are more likely than later generations to envision a more active role for the federal government. About two-thirds (67%) of first-generation immigrants believe that “the government in Washington should see to it that every person has a job and a good standard of living,” and 33% say the government should “let each person get ahead on their own”—a 34-point margin. Attitudes shift considerably among the second-generation, in which 56% think government should guarantee jobs and 44% think each person should get ahead on their own—a 12-point margin. A majority (54%) of other native-born Americans who are not second-generation immigrants say each person should get ahead on their own, and 46% say government should ensure jobs.
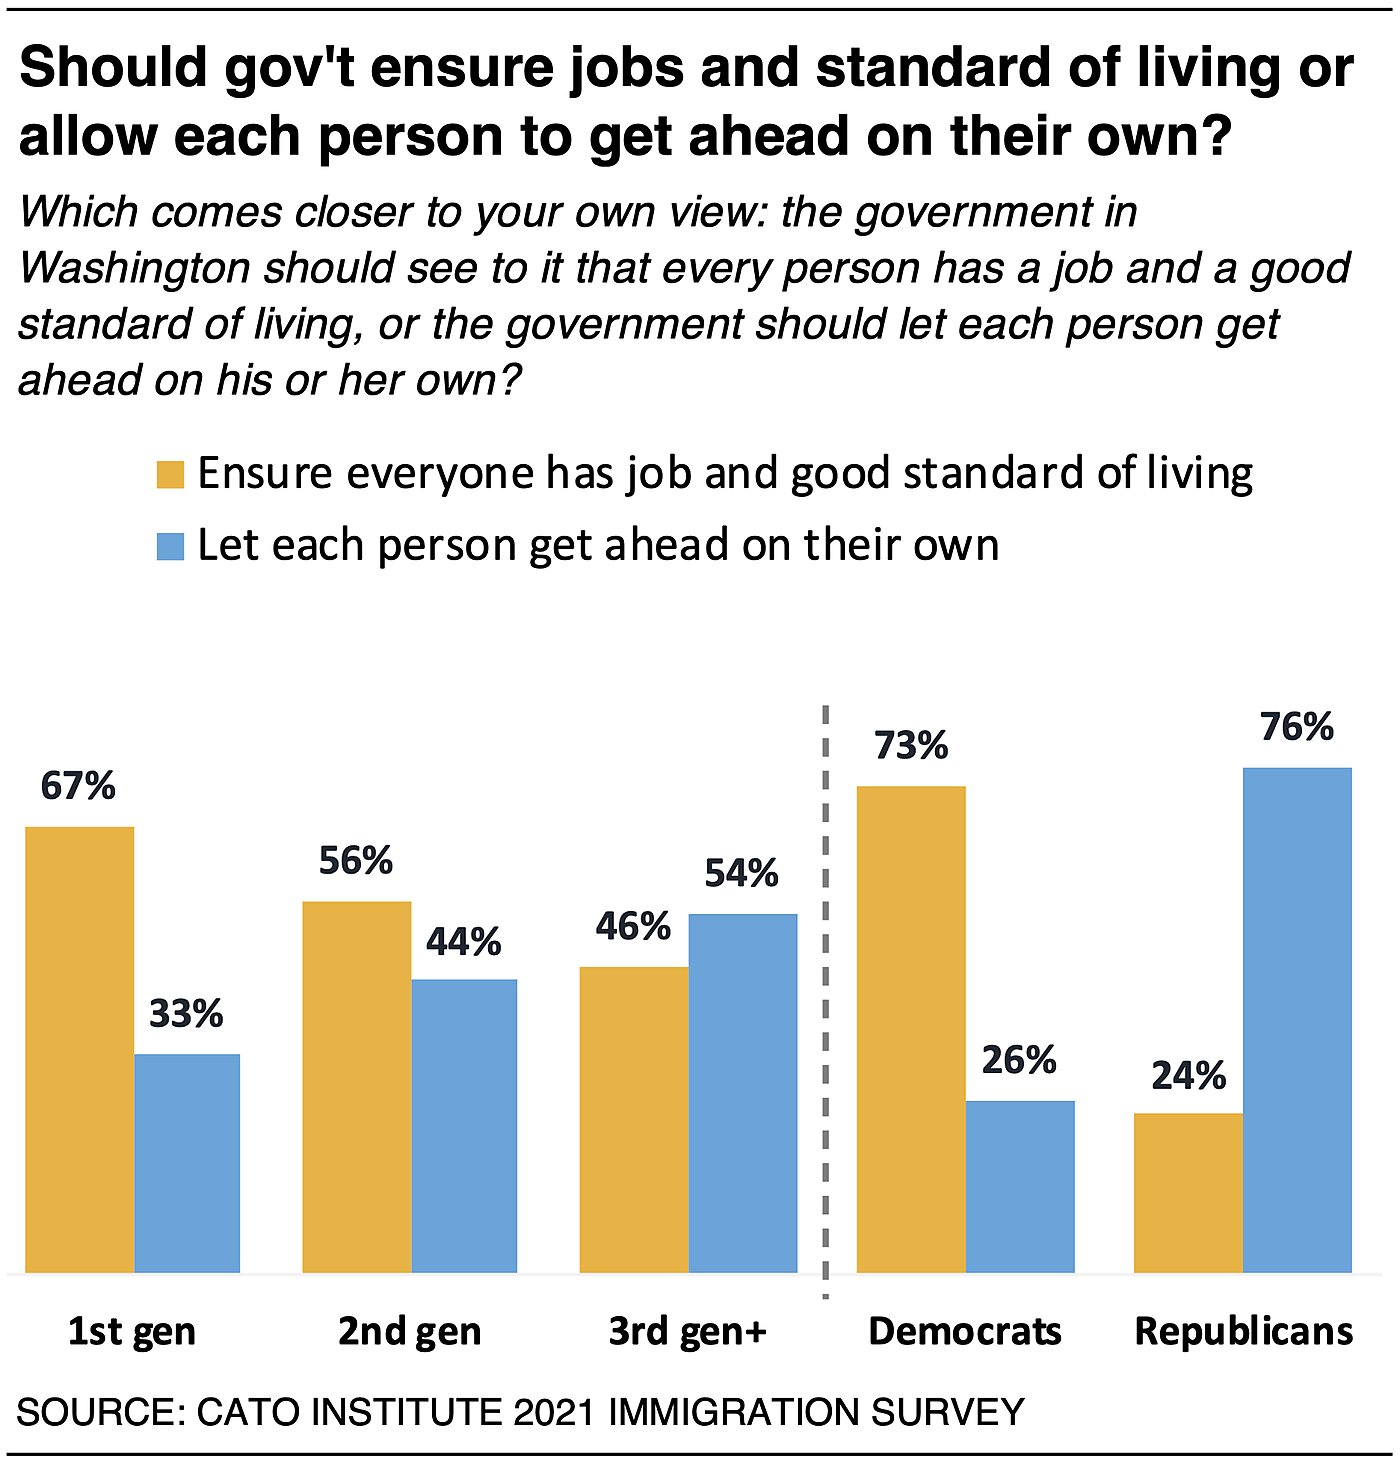
Democrats and Republicans are near mirror images of each other. Democrats prefer that the government ensure jobs by a 73% to 26% margin, and Republicans prefer letting each person get ahead on their own by a 76% to 24% margin.
Support for Socialism Slides in Later Generations
First-generation immigrants hold favorable attitudes of both capitalism (63%) and socialism (60%). However, support for socialism appears to slide among the second generation (49%) and third generation and higher (39%). In contrast, support for capitalism remains fairly high among the second generation (58%) and the third generation and higher (64%).
Democrats express a clear preference for socialism (68% favorable) to capitalism (47% favorable). In contrast, Republicans are about 6 times more likely to have a favorable view of capitalism (77%) than socialism (13%). Independents are more favorable to capitalism (57%) than socialism (35%).
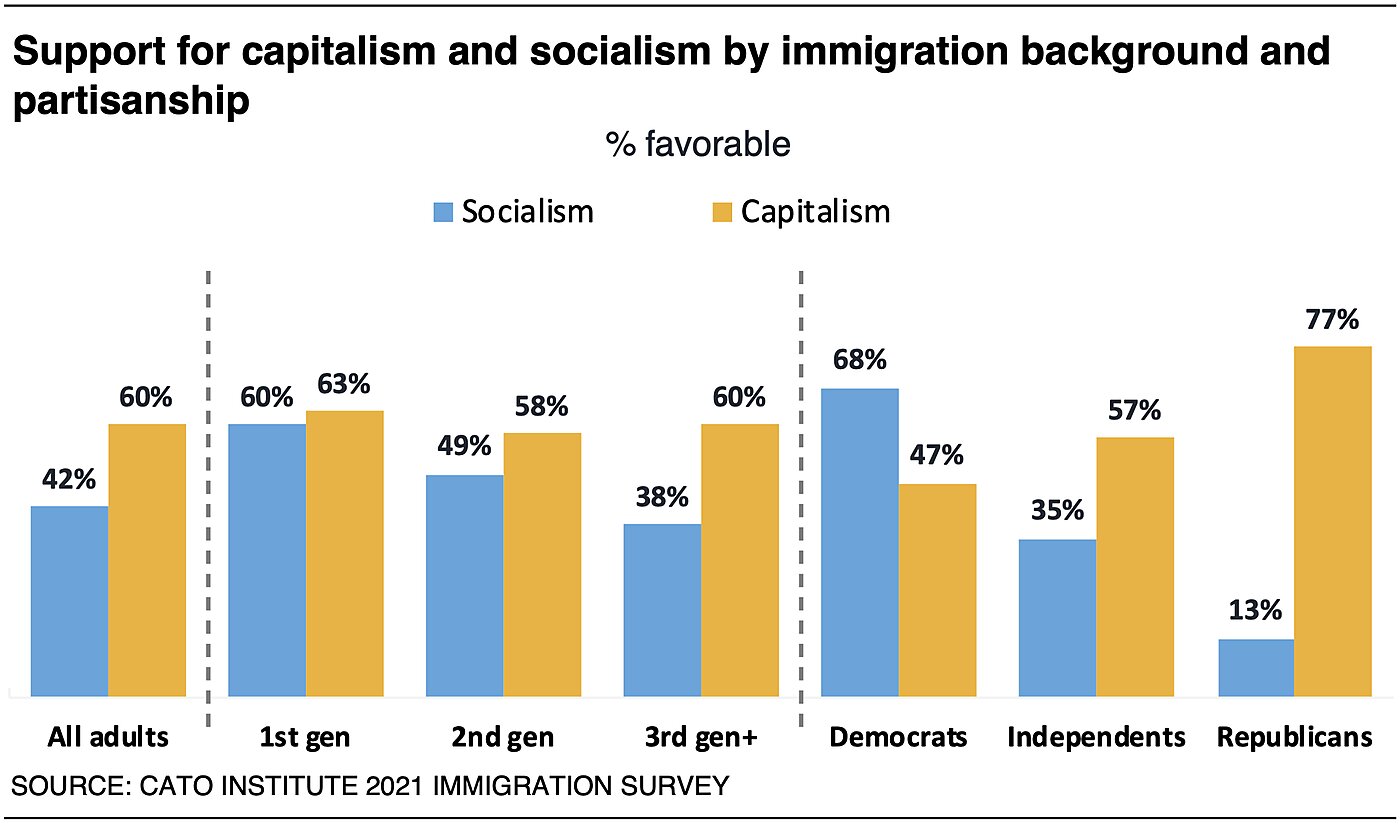
But do Americans agree what socialism means? Its definition is often the subject of dispute. Overall, Americans are divided in half about what socialism means, with 50% who think it means “a system where the government controls key parts of the economy such as runs the businesses, banks, utilities, transportation and communication industries,” and 49% who think it means “a system in which government provides citizens with health insurance, retirement support, and access to free higher education.” First- and second-generation immigrants also are evenly divided about whether socialism means state control or social welfare.
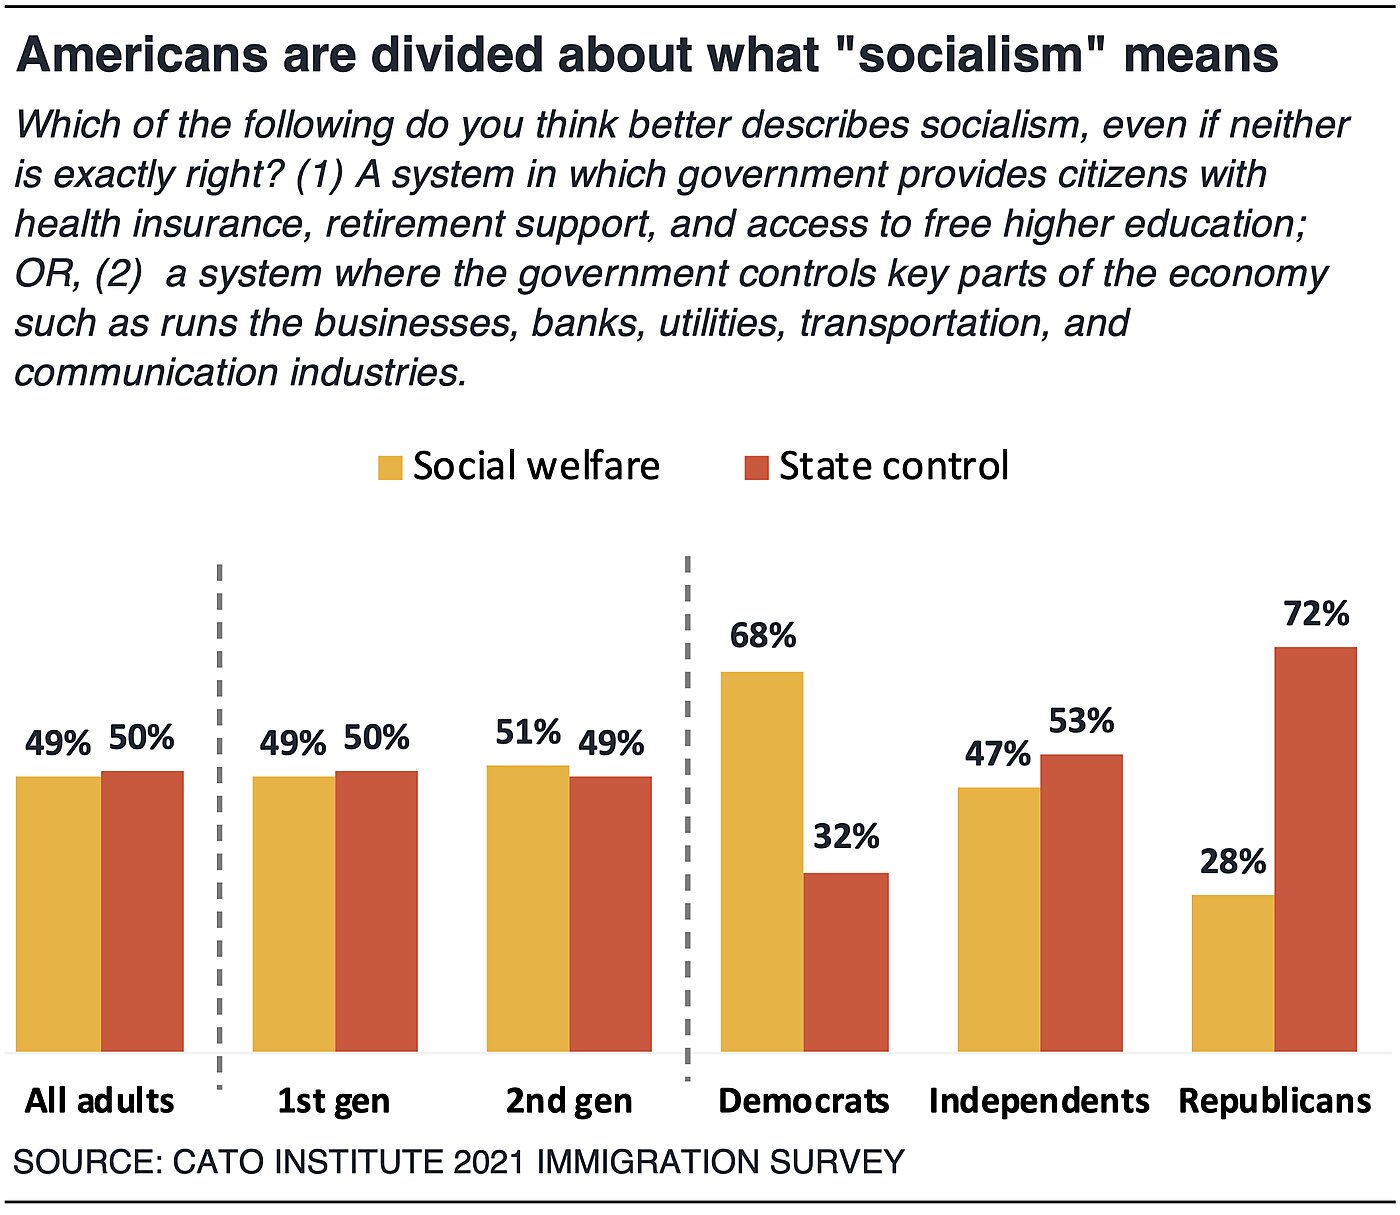
While Democrats are more likely to view socialism favorably than Republicans and immigrants, Democrats are more likely to say (68%) that socialism is “a system in which government provides citizens with health insurance, retirement support, and access to free higher education” than to say (32%) that it is “a system where the government controls key parts of the economy.” Republicans and independents view socialism differently. Majorities of Republicans (72%) and independents (53%) think socialism means state control of the economy rather than social welfare.
Support for socialism depends on how people define it. Among Americans who believe that socialism means state control, 77% have a negative view of socialism and 21% have a positive view of it. Conversely, those who think socialism refers to social welfare spending, 63% have a positive view and 35% have a negative view.
Americans have stronger opinions about the free market’s impact on giving people chances to get ahead. Nearly two-thirds (62%) say the free-market system “gives everyone a fair chance,” while 38% say that it “survives by keeping the poor and marginalized down.”
Majorities of Americans (about 6 in 10) across immigration backgrounds, Republicans (81%), and independents (65%) believe the free market gives people a fair chance rather than exploits the marginalized. Democrats stand out, with a majority (55%) who feel the free market survives through exploitation.
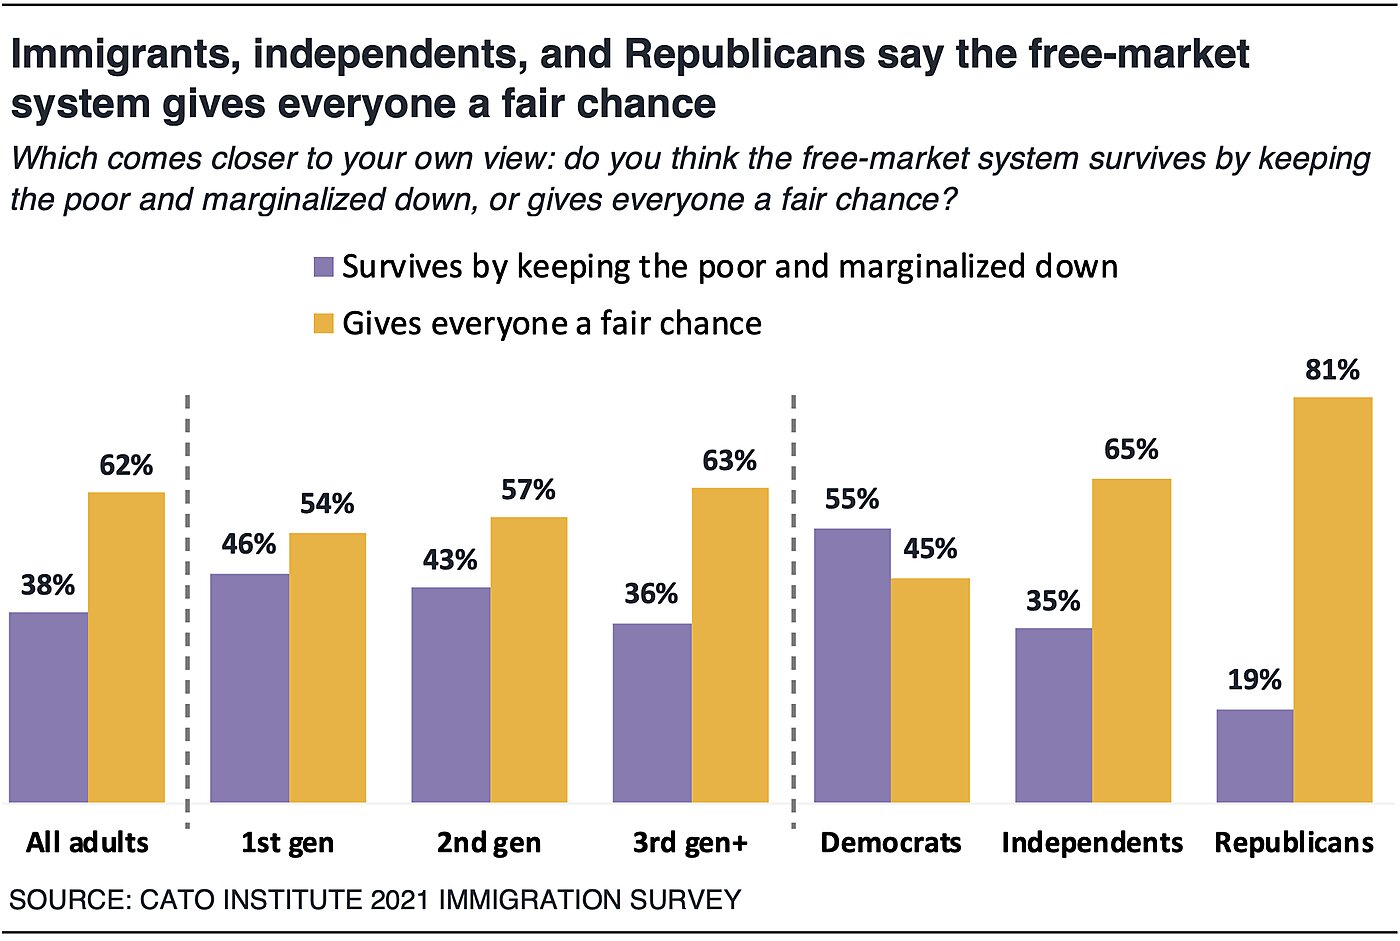
Acknowledgments
The authors would like to thank John Samples, Alex Nowrasteh, David Bier, Nicole Divers, and the many individuals who provided valuable input into the survey design and research process.
Cover design by Roshni Ashar and Jon Meyers.
About the Authors


This work is licensed under a Creative Commons Attribution-NonCommercial-ShareAlike 4.0 International License.