The renewable energy mantra heard around the world is a steady one: Renewables are getting cheaper every year. We must transition to a renewable future.
The renewable energy mantra heard around the world is a steady one: Renewables are getting cheaper every year. We must transition to a renewable future.
The best narratives are ones based on a true story. Start from a kernel of truth, one that is verifiable, and the rest of the story will be accepted as gospel. But what if that initial thought-kernel—the proverbial mustard seed from which the rest of the narrative grew—is misleading?
Wind and solar power are not as cost competitive as mainstream narratives suggest. Though the levelized cost (explained below) of electricity from renewable sources is comparable with dispatchable sources of power like combined cycle natural gas, this comparison is highly misleading. Variable renewable energy (VRE) sources like wind and solar are resource-constrained and dependent on such factors as weather and the time of day, generating power only 25% to 34% of the year. While dispatchable sources of power (which include nuclear and coal as well as gas) produce electricity on demand, VRE sources do not. This allows operators to vary dispatchable energy sources based on the needs of the grid, while VREs vary depending on the weather, season, and clock.
As VRE penetration levels rise, their value to the system declines. Developed countries like the United States require power night and day, all year round. Because VRE sources depend on weather and time of day, they do not have the ability to dispatch their power on demand. Instead, they depend on dispatchable power plants on the grid to function as a de facto battery, balancing electricity supply and demand when the VREs fall short. When the sun is shining and the wind is blowing, dispatchable power plants reduce their electricity output to keep supply and demand in balance. During times of no sun and low wind, dispatchable power plants increase their output to cover for the lack of VRE power. Therefore, as VRE penetration levels rise, the dispatchable plants sit increasingly idle, yet they must still be available to provide 24/7 power. This “double building” of VREs is a main reason why electricity costs increase with VRE penetration levels.
The Misleading Culprit: Levelized Cost of Electricity
The levelized cost of electricity (LCOE) is the cost of electricity for a particular energy source. Put more carefully, it is the average revenue per unit of electricity generated that would be required to recover the costs of building and operating a generating plant during an assumed financial life and duty cycle. LCOE is usually given in terms of dollars per megawatt hour (MWh).
LCOE is often used to quantify the general competitiveness of different generating technologies. For instance, data from the financial consulting and asset management firm Lazard indicate that the LCOE for utility-scale solar decreased from a midpoint of $358 per MWh in 2009 to just $35 in 2021, and onshore wind generation fell from $134 to $38. As a result, new construction of solar and wind projects has lower LCOE than new construction of natural gas combined cycle, coal, and nuclear power. Hence the popular narrative: “Renewables have lower LCOE, therefore they’re cheaper and should be built everywhere.”
But this “kernel of truth” is misleading. LCOE provides a cost of electricity from a particular power source, but only when that power source is generating electricity. That’s an important caveat for energy sources that usually aren’t operating. As noted, in the case of VRE like wind and solar, power typically is only generated 25% to 34% of the time over the course of a year. Therefore, VREs are only able to take advantage of their “cheap” LCOE when the sun is shining or the wind is blowing.
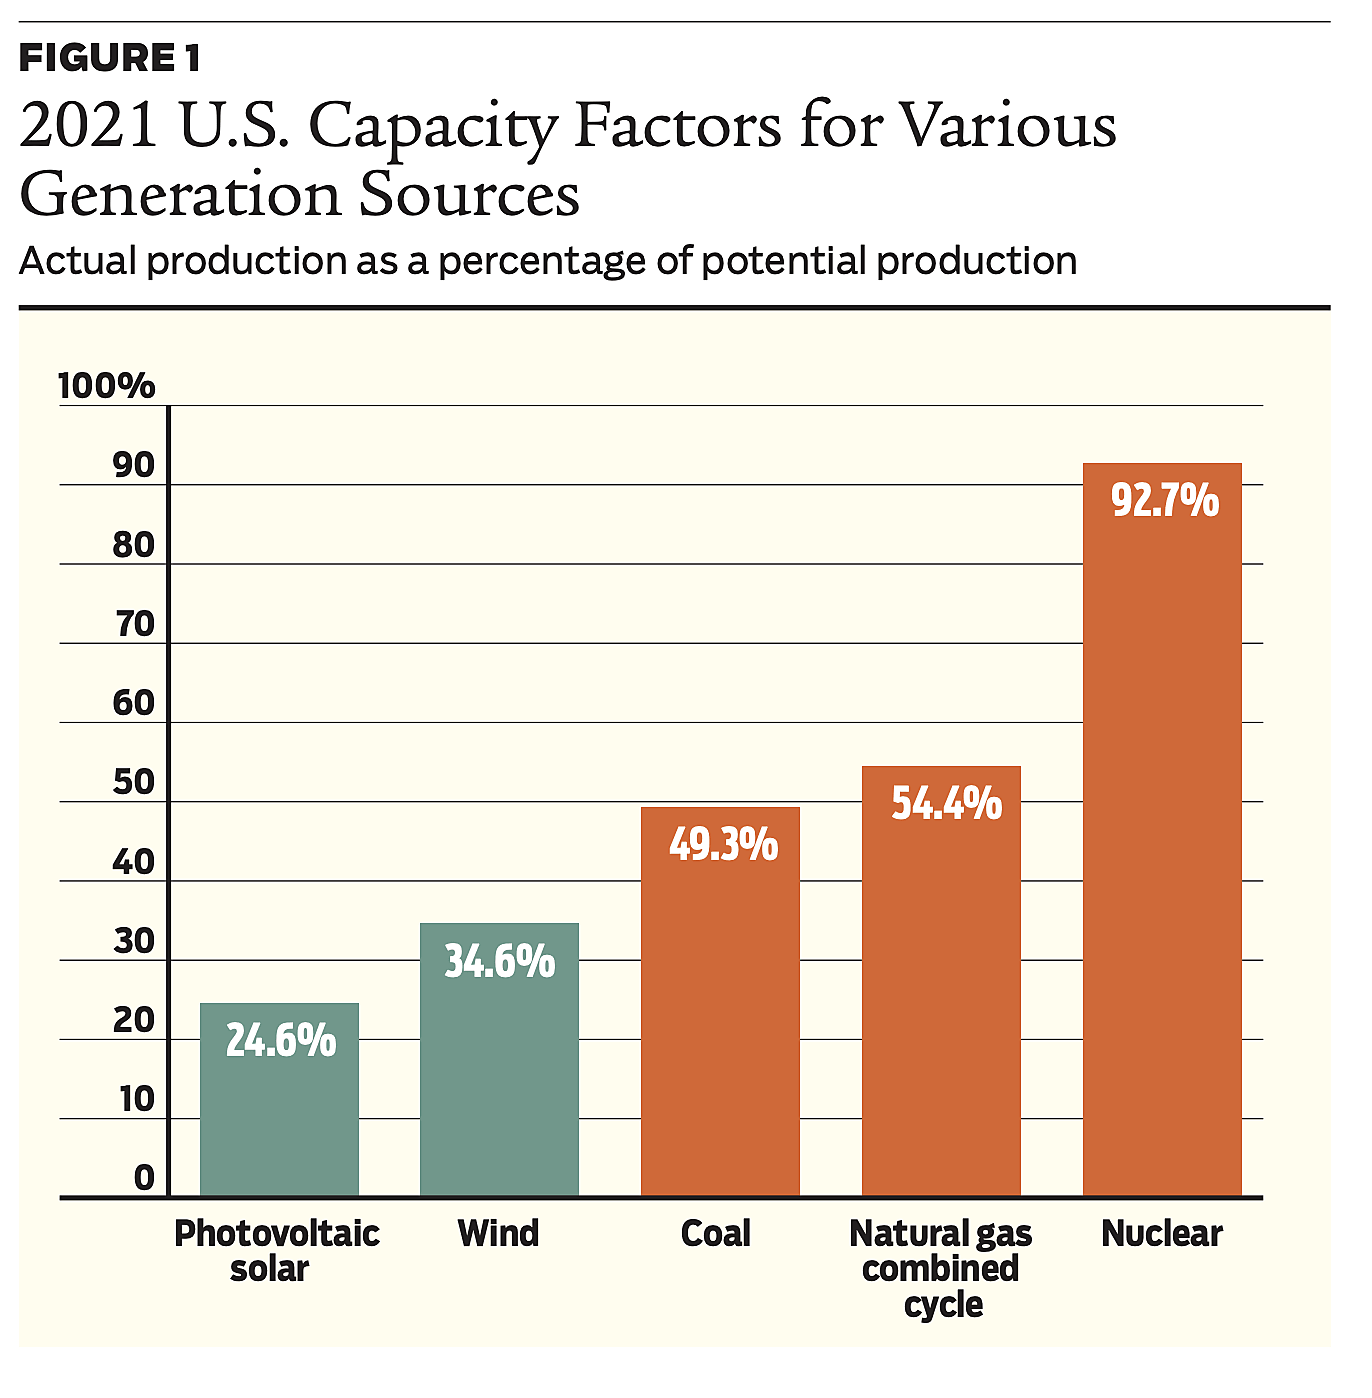
Capacity factor is an important measure of how “productive” an energy source is. It is the percentage of output an energy source actually produces compared to how much it could produce if it were operational 24/7. For example, if a nuclear power plant could produce 1,000 gigawatt hours (GWh) of electricity over a full year but only produces 900 GWh over that time, then its capacity factor for the year would be 90%.
Figure 1 shows the average capacity factor of dispatchable and VRE sources in the United States in 2021. In the United States, solar farms have an average capacity factor of 24.6%, wind farms 34.6%, while dispatchable energy capacity factors range between 49% and 92%. Keep in mind that dispatchable energy sources vary their power production in part based on the needs of the grid so as to keep supply and demand in balance, while VRE sources are inextricably tied to weather and daylight. As an example, while the average 2021 capacity factor of coal was 49.3%, it jumped to 65.9% in August because of high summer-time energy demands. Similarly, natural gas combined cycle averaged a year-long 2021 capacity factor of 54.4%, but it increased its power output to 67.4% in August 2021. Wind and solar are incapable of doing the same.
LCOE is, therefore, not a good metric for comparing VREs to dispatchable sources of power. In their 2022 Annual Energy Outlook report, the U.S. Energy Information Administration (EIA) said so explicitly:
We list the LCOE values for dispatchable and resource-constrained technologies [VREs] separately because they require a careful comparison. LCOE by itself does not capture all of the factors that contribute to actual investment decisions, making direct comparisons of LCOE across technologies problematic and misleading as a method to assess the economic competitiveness of various generation alternatives.
In its future modeling outlook, the EIA points out that though photovoltaic solar LCOE is lower than natural gas combined cycle LCOE, more combined cycle generation is expected to be installed than solar. They forecast this because “the relative value of adding [combined cycle] to the system is greater than for [photovoltaic solar], which LCOE does not capture.”
A different metric is needed, one that more correctly identifies not the cost but the value of adding a particular source of energy to the grid.
Levelized Avoided Cost of Electricity
A better comparison of economic competitiveness between generation technologies is the Levelized Avoided Cost of Electricity (LACE). This reflects the value of the generation technology in serving the electric grid. LACE “provides a proxy measure for potential revenues from the sale of electricity generated from a candidate project displacing (or the cost of avoiding) another marginal asset.”
In other words, LACE compares what a prospective new energy source would be worth if dropped into a pre-existing grid. If it is more affordable to maintain the current generation rather than installing new power generation, then the new power generation would have a lower LACE. For example, a new solar farm that would displace power from a more expensive gas-fired peaking unit will have a higher LACE than one that would displace power generation from a more affordable combined cycle natural gas unit or a coal-fired unit with low fuel costs.
Comparing LACE and LCOE allow for clearer comparisons of different generation technologies. If LCOE is the cost of electricity from an energy source while LACE is the value of the electricity from that same energy source, a simple ratio of LACE to LCOE will allow for a quick economic comparison to gauge the economic competitiveness of energy sources. As the EIA puts it:
We calculate LACE-to-LCOE ratios (or value–cost ratios) for each technology to determine which project provides the most value relative to its cost. Projects with a value–cost ratio greater than one (that is, LACE is greater than LCOE) are more economically attractive as new builds than those with a value-cost ratio less than one (that is, LACE is less than LCOE).
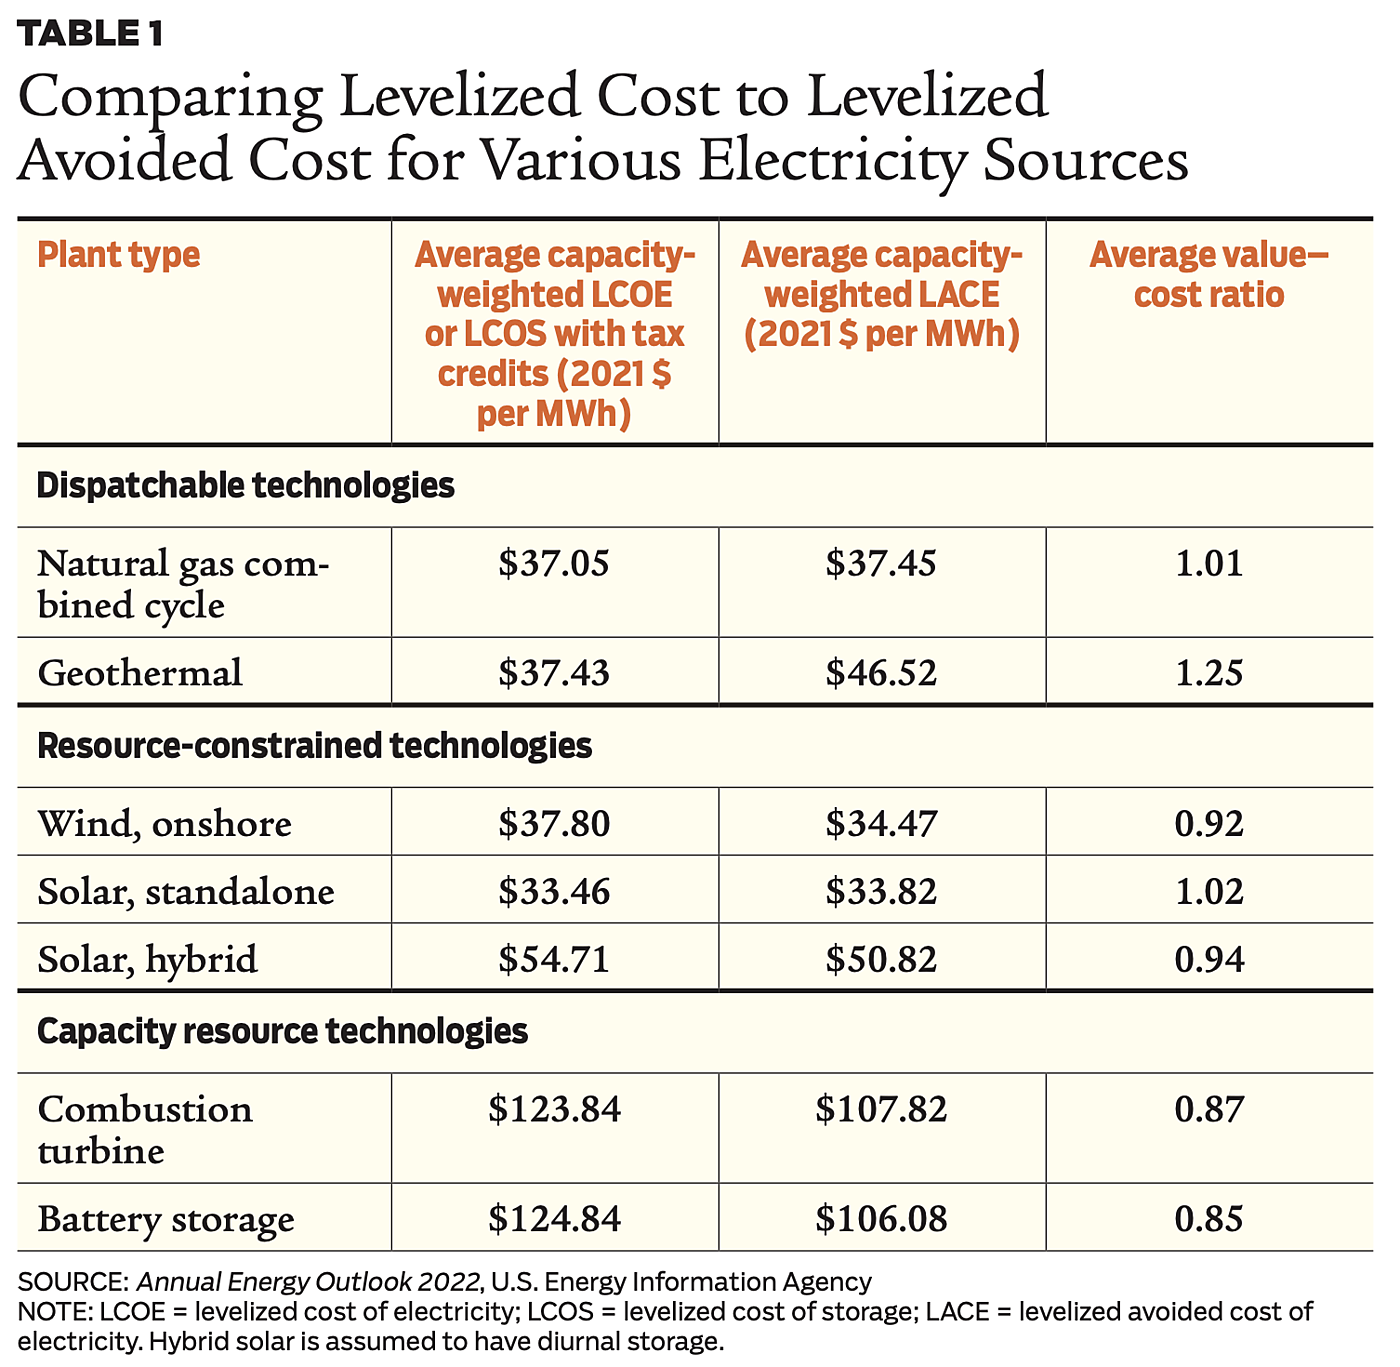
Table 1 compares the LACE and LCOE for different energy power plants. The only new-build options with a value–cost ratio (including tax credits) greater than 1.0 are natural gas combined cycle, geothermal, and standalone solar. Opportunities to install geothermal plants are limited because they require specific geological conditions. As such, the remaining two power plant options with value–cost ratios over 1.0 are standalone solar and combined cycle natural gas.
Without tax credits, the LCOE for solar increases while the LACE remains unchanged. This would bring the solar (standalone) ratio down from 1.02 to 0.94 and solar (hybrid) from 0.93 to 0.87. Therefore, without the heavy government subsidies currently enjoyed by solar, it would not be economical to install new solar facilities on the U.S. grid.
LACE-to-LCOE ratios help explain why energy forecasts like EIA’s predict more natural gas combined cycle capacity to be installed in the near future than photovoltaic solar capacity.
In the developed world, it is not enough to have access to affordable electricity. Even more important than electricity’s cost is its availability. Flipping a light switch needs to be immediately followed by the glowing of a lightbulb, day or night. People and firms do not simply need power, they need power all the time, no exceptions. The U.S. electrical grid was built to accommodate this need by using dispatchable energy plants. When electricity demand spikes at midday in the middle of summer, dispatchable power plants are fed more fuel to increase their electricity output. The same is not possible with VREs.
The Issues with Getting to 100% Renewable Energy
Is a 100% renewable grid technologically possible, is it reliable, and is it economical? No, no, and no.
Researchers at the federal National Renewable Energy Laboratory (NREL) and the U.S. Department of Energy (DOE) published two major studies in the journal Joule in June and July 2021 addressing the challenges of the United States going 100% renewable. Renewable energy (RE) generated 20% of all U.S. electricity in 2021. The first of the two studies states that “at current RE penetration levels, RE is cost competitive with traditional generation sources in many regions of the United States.”
However, the studies conclude that there remain too many unanswered questions and unidentified unknowns about the feasibility of achieving 100% renewable energy in the United States. As the researchers put it in the first report:
Significant unanswered questions remain regarding moving toward or achieving 100% RE at a national scale for all hours of the year. There is no simple answer to how far we can increase RE penetration before costs rise dramatically or reliability becomes compromised. Studies have found no specific technical threshold at which the grid “breaks,” and we cannot extrapolate from previous cost analyses because of nonlinearities and unknown unknowns.
In a nutshell:
- It is unknown what level of VRE can be added to the grid before it breaks or becomes unaffordable. However, it is all but certain that at some unknown point the grid will become unreliable and costs will skyrocket. And yet, more VREs are built every year.
- The costs to upgrade the grid are significant and unknown.
- Dispatchable low-carbon energy sources like nuclear or coal/natural gas with carbon capture technology can play a significant role in maintaining grid stability because they can act as a de facto battery.
Despite these problems, the mantra does not change: Renewables are getting cheaper every year. We must transition to a renewable future.
The Main Obstacles to a 100% Renewable Grid
Some things people consume, like food and water, do not require immediate consumption. If one were to buy too much bread, it can be stored in the pantry or frozen for later use. Electricity is fundamentally different. Electricity is only generated from an energy source when it has someplace to be consumed. When a single electron enters the “grid,” it must be consumed somewhere instantaneously. In other words, when a light is switched on, a generation unit somewhere on the grid is ramping up to generate the power needed to keep the light on.
Electricity consumption and generation must always be balanced. If it isn’t, the power grid could collapse. Thankfully, the immense size and interconnectedness of electricity grids make the balance issue easier to handle; billions of electrical loads across the country are constantly being added and removed, averaging out at any given moment.
Understanding this, one can appreciate the problem with VREs: they don’t have the ability to “decide” when to increase their power production. Instead, they are at the mercy of the weather and the day and depend on the dispatchable power plants on the grid to function as a de facto battery, kicking in or going idle to keep electricity supply in balance with demand. Therefore, as VRE penetration rises, its value to the system declines.
This can be broken down into three basic “balance” problems:
- Short-term variability problem: Short-term fluctuations of VREs rely on the grid for stability.
- Diurnal mismatch problem: Peak solar generation during the day occurs four to six hours before peak demand, and peak wind generation typically occurs at night, when demand is low.
- Seasonal problem: There is significant seasonal mismatch among wind, solar, and demand patterns.
Short-term variability problem / As previously noted, the United States had 20% VRE generation in 2021. Despite these sources’ significant variability, the power grid has not failed system-wide. Utilities have been able to cost-effectively integrate VREs using a combination of institutional changes such as shorter scheduling intervals, improved forecasts in system operations, and larger balancing areas to smooth resource variability. “Larger balancing areas” refers to the fact that, because the grid is so vast, inconsistencies in VRE generation are “smoothed” by ramping dispatchable energy sources up or down to keep the grid from collapsing. As more VREs are added to the grid, it becomes exponentially more difficult to use the rest of the dispatchable grid as a “smoothing” system. Therefore, as VRE penetration levels rise, their value to the grid declines.
Low-LCOE power generation, such as wind and solar, reduce wholesale electricity prices. At first glance, this may seem like a positive: electricity is cheaper thanks to renewables. The problem is that having dispatchable power plants on the grid is of the utmost importance to balance or “smooth” the grid. Utilities will continue to build new non-renewable capacity and extend the life of existing non-renewable plants, and the money for these new facilities must come from somewhere. So, electricity rates will increase and Americans will pay more for power even though VREs are “cheaper” when producing.
As the NREL and DOE researchers put it in the first of their two reports:
Overall, the balance challenge factors that have been identified at current levels of deployment have strong implications for the ability of [photovoltaic solar] or wind to serve the load in higher RE penetrations—particularly before considering energy storage, demand response, or other enabling technologies.
Diurnal mismatch problem / Diurnal mismatch, as it relates to VREs, describes the problem that solar generation peak occurs four to six hours before demand peak and wind generates more at night, when demand is low. In other words, VREs produce too much power when not needed and not enough when power is needed.
Grid experts, scientists, and studies agree that there may be a “breaking point” where the ratio of VREs to dispatchable generation is so high that the dispatch portion of the grid can no longer sufficiently smooth electricity supply and demand. This point has not been reached yet. Studies mostly conclude that a 50%+ VRE penetration is technically feasible while maintaining supply–demand balance and adequate operating reserves. This would be significantly expensive, albeit “well-understood changes to grid operations, many of which have already occurred or are underway both in the United States and internationally, including incorporating wind and solar forecasting, new reserve products, and wide-area cooperation,” in the words of the NREL and DOE researchers’ first report. Once again, reading between the lines, “wide-area cooperation” entails using dispatchable power plants on the grid to offset the variability of wind and solar.
Though mostly untested on a large scale, below is a list of theoretical measures that could be taken to address the diurnal mismatch problem, some more realistic than others:
- Focus on dispatchable sources such as nuclear, natural gas, and coal (with carbon capture, if necessary) as the prime forms of generation, combined with low levels of VREs.
- Electric vehicles could charge during times of peak VRE generation (during peak solar in between morning and evening commutes, and during peak wind at night), thereby shifting more demand to times when these electricity sources are available and other demand is lighter.
- Industrial processes could consume more power during peak solar production or at night during peak wind.
- Installing diurnal storage with four to 12 hours of storage capacity. While storage costs have decreased, they currently remain prohibitively expensive. Additionally, the more storage capacity that is installed, the lower the value of the storage to the overall system.
- Dramatically overbuilding VREs. The idea is that if the price of VREs decreases even further, VREs may be competitive even at high curtailment rates.
Conventional wisdom assumes the continued decrease in cost of VREs and diurnal storage. However, this may not be the case going forward. Battery energy storage systems (BESS) prices have trended up in the last couple of years. In fact, BESS costs have increased significantly in the past year. Andy Tang, vice president for energy storage and optimization at the global energy technology group Wärtsilä, recently told the trade publication Energy Storage News:
We’re looking at a 25% (+/–) increase in the cost base of BESS systems versus one year ago. There are inflationary pressures across the whole system, but this magnitude of increase is really being driven by the battery cells.
The seasonal problem / As difficult as the smoothing problem is over the course of a day, it is much harder over the course of a year. There currently exists no solution for the seasonal mismatch in supply and demand at 100% RE. It is unknown at what level of RE penetration seasonal mismatch dramatically raises energy costs and what technologies or changes are needed to overcome this problem.
The specific RE penetration level that would break the grid is unknown. Some of the brightest energy analysts in the country are currently making their best guesses on this using intricate modeling, and there is no consensus. Going well beyond the current 20% penetration of VRE is a gamble, with skyrocketing electricity prices and grid instability as consequences.
It is unknown at what level of RE penetration seasonal mismatch dramatically raises energy costs and what technologies are needed to overcome this problem.
To serve a load with 100% RE plus diurnal storage, RE and diurnal storage costs would need to decrease so dramatically that building oversized units becomes economical even at high curtailment rates. This is likely not a pragmatic or reasonable outlook, especially given the increased price of raw materials. Therefore, the exponential price increases expected when approaching 100% RE indicate that a stable solution must include more than VRE and diurnal storage.
The two options usually cited as potential future solutions to the seasonal challenge are:
- Seasonal storage that would provide hundreds or thousands of hours of energy capacity. This would allow power to be delivered to the grid during consecutive weeks and months where energy demand outweighs supply. Most seasonal storage concepts include the production of a liquid or gas fuel such as hydrogen. The fuel is then stored before being used to generate electricity in gas turbines, reciprocating engines, or fuel cells. Current limitations for this strategy include high capital costs and low round-trip efficiency.
- Using RE “peaking” resources such as biomass-fueled, geothermal, and hydroelectric generators when demand outpaces VRE supply. Until now, these sources have not been considered a peaking resource.
Neither of these two options is currently viable. The best analytical modeling tools used by experts are lacking when it comes to long-term storage. There are too many unknown unknowns. As the NREL and DOE researchers put it in their first report:
Overall, much work remains to fully evaluate the technology mixes that would economically address the seasonal mismatch of supply and demand. This is compounded by the need for improved tools and data sets. Current planning tools have limited ability to evaluate very-long-duration to seasonal storage, and understanding the nature of this challenge will also be enhanced by greater and more coordinated analysis of inter-annual variability of VRE supply patterns, frequency of extreme weather events, and longer-term shifts in demand patterns created by climate change and electrification.
Is Green Hydrogen the VRE Savior?
“Green hydrogen” is often proposed as the solution to the seasonal storage problem. The concept sounds simple: use renewables during peak VRE generation to produce hydrogen from electrolysis of water, and store that hydrogen to use later to generate power during periods of peak demand. Problem is, storage of such large amounts of hydrogen is prohibitively expensive, and there is little prospect that will change. Though not economical (and perhaps not technologically feasible), NREL’s models use green hydrogen systems as dispatchable power to reach its envisioned 100% RE.
Producing hydrogen is simply trying to replicate, on a human-scale, what nature has already done on a planetary scale. The earth has natural deposits of energy sources such as oil, natural gas, coal, and uranium. Instead of using these resources, green hydrogen is an energy-balance fool’s errand: it requires far more energy to produce hydrogen than the energy that is returned. Though energy would be added to this system via VRE, it would take impractical amounts of VRE and infrastructure for this process to work at scale.
An analogy would be heating a home directly with natural gas compared to heating a home with electricity generated from natural gas:
- In the former, natural gas is extracted from the earth and burned in homes to generate heat directly.
- In the latter, natural gas is extracted, transported to a power plant, burned to generate electricity, then the electricity is transmitted thousands of miles to reach a home, where it is run through a resistive coil to generate heat.
Electrically heating a home can cost about 300% more than heating a home directly with natural gas.
As the International Energy Agency put it in a 2019 report:
All energy carriers, including fossil fuels, encounter efficiency losses each time they are produced, converted or used. In the case of hydrogen, these losses can accumulate across different steps in the value chain. After converting electricity to hydrogen, shipping it and storing it, then converting it back to electricity in a fuel cell, the delivered energy can be below 30% of what was in the initial electricity input. This makes hydrogen more “expensive” than electricity, or the natural gas used to produce it. It also makes a case for minimizing the number of conversions between energy carriers in any value chain.
Green vs. blue hydrogen / An additional hurdle is the cost of green hydrogen (produced by wind or solar) compared to “blue hydrogen,” which is produced from nonrenewable sources that employ carbon capture technology. On average, green hydrogen costs more than three times blue hydrogen (currently around $5.60 per kilogram for green hydrogen and $1.80 for blue). Both are more expensive than natural gas.
What is more, blue hydrogen will always be inherently more expensive than natural gas because of the energy loss from converting natural gas to hydrogen. And without a carbon tax, green hydrogen is unlikely to ever be cost competitive with blue hydrogen or natural gas.
Though still more expensive than natural gas, blue hydrogen is the lowest-cost clean hydrogen. One contributing reason blue is more affordable than green is the difference in footprint of the land required. The planned Asian Renewable Energy Hub (AREH) project in Australia, if constructed, will be the world’s largest green hydrogen project. Constructing it as a green hydrogen plant will require 410 times more land than if AREH were a blue hydrogen facility. It will require 5,750 km2 of land (bigger than the state of Delaware) to produce 1.76 metric tons of green hydrogen per year, with the water electrolysis powered by 23GW of solar and wind generation. Conversely, this same AREH project via blue hydrogen would require just 14 km2 of land (about the size of downtown Los Angeles).
As explained by the Global CCS Institute, a think tank dedicated to promoting carbon capture and storage:
Supporting 530 [megatons] of green hydrogen would cost over US$8,000 billion, compared to approximately US$300 billion for blue hydrogen. This covers pipelines, electricity generation and distribution. There are many assumptions built into these cost estimates. While not definitive, they illustrate that the essential infrastructure required to support production of climate-relevant quantities of green hydrogen could cost 20 or 30 times more than the infrastructure required to support production of the same quantity of clean hydrogen using fossil fuels with CCS.
Recently, the U.S. DOE announced $8 billion in public funding to create regional hydrogen “hubs” as called for in the 2021 Infrastructure Investment and Jobs Act. Additionally, the DOE’s “Hydrogen Shot” program has a goal to reduce green hydrogen costs to $1/kg within a decade, which would be more than an 80% reduction from current prices. However, the International Energy Agency published an analysis estimating costs of green hydrogen would only drop by 30% by 2030. This is yet another indication that major companies, governments, and international organizations are simply guessing at what advancements can be achieved in renewable energy.
Conclusion
The United States is leading the renewable energy charge down a primrose path: the quest for a 100% renewable grid. Upon first glance, the above-mentioned NREL and EIA reports seem to indicate the feasibility of such a quest. A more careful reading shows how much is unknown in the effort to reach 100% renewable, especially in terms of grid stability and power cost.
The consensus is that grid instability and power cost increases will occur as renewable penetration increases, though there is no consensus on what level of renewable penetration will be the threshold of serious problems. While the United States currently has 20% renewable energy penetration, NREL’s latest study predicts 57% RE penetration by 2050 while EIA predicts 37% by 2050. The difference between the two predictions is indicative of the gamble currently playing out over the U.S. power grid. Going well beyond the current 20% penetration of VRE is a risk, with skyrocketing electricity prices and grid instability as consequences.
The power demand for the U.S. grid is projected to be virtually flat over the next 30 years. That would change dramatically if we try to electrify the entire economy. It would add two new giant power demands: for transportation and for heating. The seasonal storage problem would only compound the difficulty, bringing the whole endeavor into question.
Readings
- “BESS Cost Base Has Gone Up 25% Year-on-Year, Says Wärtsilä,” by Cameron Murray. Energy Storage News, July 13, 2022.
- “Levelized Costs of New Generation Resources in the Annual Energy Outlook 2022.” U.S. Energy Information Administration, March 2022.
- “Long-Run System Value of Battery Energy Storage in Future Grids with Increasing Wind and Solar Generation,” by Dharik S. Mallapragada, Nestor A. Sepulveda and Jesse D. Jenkins. Applied Energy 275: 115390 (2020).
- “Quantifying the Challenge of Reaching a 100% Renewable Energy Power System for the United States,” by Wesley J. Cole, Danny Greer, Paul Denholm, et al. Joule 5(7): 1732–1748 (2021).
- “Seasonal Energy Storage for Zero-Emissions Multi-Energy Systems via Underground Hydrogen Storage,” by Paolo Gabrielli, Alessandro Poluzzi, Gert J. Kramer, et al. Renewable and Sustainable Energy Reviews 121: 109629 (2020).
- “The Challenges of Achieving a 100% Renewable Electricity System in the United States,” by Paul Denholm, Douglas J. Arent, Samuel F. Baldwin, et al. Joule 5(6): 1331–1352 (2021).
- “The Future of Hydrogen.” International Energy Agency, 2019.

This work is licensed under a Creative Commons Attribution-NonCommercial-ShareAlike 4.0 International License.