This year’s debate over trying to repeal, replace, or just rename Obamacare often recycled the well-worn nostrums concerning private health insurance arrangements. Among them:

  • A large majority of health care spending involves a much smaller, less healthy portion of the insured population, which means that the distribution of health care spending is highly concentrated.
  • Most individuals are healthy and need to spend very little on health care each year.
  • Sustainable health insurance markets require that healthy customers pay more than they want so that less healthy customers can pay less for the care they need.
  • Extensive government intervention, such as standardized benefits, generous subsidies, and limits on risk-based underwriting, is necessary in health care markets because those markets are prone to adverse selection and dangerous “death spirals.”

Voilà. These four points have given you the equivalent of graduate-level course work in health policy. You could pass yourself off as an expert. At a minimum, you could serve as either an insurance industry lobbyist, political advocate of conventional wisdom, or defender of the Affordable Care Act’s (ACA) intertwined mix of mandates, minimum benefits, insurance rating rules, and taxpayer subsidies. (Sometimes, it’s hard to keep those roles apart.)

But what’s more interesting is how limited is the empirical base on which this chain of standard assumptions is built and linked.

It turns out that health care spending, at least in the under-age-65 private markets for health insurance, has become less, not more, concentrated in recent decades. After a significant decline in spending concentration about two decades ago, it has stabilized at that lower level. There is a significant decline in concentrated spending among individuals from one year to the next. That decline in the “persistence” of high spending continues in people’s later years, though at a less significant rate.

Nevertheless, the overall pattern remains that a majority of individuals below Medicare age, or people not redirected to other forms of public insurance coverage (primarily Medicaid) as a result of longer-term disabling and income-limiting health conditions, just don’t need to spend that much of their income on health care. Whether they still should be required to pay much more for their insurance under the ACA or some other government intervention is largely a matter of policymakers’ choice rather than economic necessity.

Questioning the soft foundation of longstanding assumptions about the nature and sustainability of private health insurance markets matters across a range of contemporary policy discussions and health reform options. They involve issues such as community rating, standardized minimum benefits, risk-protection subsidies, the individual insurance purchasing mandate, health savings accounts, and retirement savings incentives.

DO LOW SPENDERS HAVE A DUTY TO PAY MORE?

Marc Berk and Zhengyi Fang offered one recent update to the still-modest volume of mainstream empirical research on these issues. They highlighted what should already be obvious to casual consumers of conventional health policy wisdom.

Berk and Fang found that the ongoing level of health care expenditures incurred by the lower-spending half of the U.S. population, for noninstitutionalized services, ranged between 2.7% and 3.5% between 1977 and 2014. They analyzed the most likely traits of low spenders and found these people considered themselves to be in good or excellent health. Compared to those in the upper half of annual health spending, the low spenders were younger (twice as likely to be below age 18 and four times less likely to be over age 65). They also were four times as likely to lack insurance coverage. High spenders were somewhat more likely to have public insurance coverage. The latter were more than twice as likely to report difficulty with immediate access to care.

So, for the substantial portion of the population that remains essentially healthy, has few direct concerns about access to care, and does not cost very much money to treat, it’s tempting to ask why public policy doesn’t largely “leave them alone.” But Berk and Fang instead raise concerns that the low spenders are less likely to support some provisions of the Affordable Care Act—perhaps because it does not benefit them, or at least provides benefits to others without requiring the others to make sacrifices while these low spenders do. This is the basis for the concern that if insurance coverage of the low spenders declines, insurers’ ability to offer affordable coverage to high spenders will also decline.

The implicit political translation at play here is that low spenders are often seen primarily as “donors” to fund the more expensive costs of high spenders—not through more-transparent taxes and public expenditures, but rather through the cross-subsidies produced by rating restrictions and coverage mandates.

DECLINING CONCENTRATION OF HEALTH SPENDING

Annual statistical snapshots of health spending distribution at the individual level can obscure two important trends: First, this spending itself became less concentrated in recent decades. Second, its persistence over longer periods of time is diminishing.

As often happens in policy-oriented extrapolations from statistical time series, findings can be shaped by how one slices and dices the underlying data. The time period highlighted, the cohorts of the overall population identified, the data source, and the subset of health coverage programs examined can shape different stories.

For example, Samuel Zuvekis and Joel Cohen were the first analysts to pick up a new trend toward less concentrated health care spending among top spenders since 1996. They used some of the same Medical Expenditure Panel Survey (MEPS) data that Berk and Fang would later use in their paper described above. However, Zuvekis and Cohen explained how, from 1996 to 2003, rapid growth in prescription drug spending was linked to slower growth in spending for inpatient care and thereby largely accounted for recent reductions in health spending concentration.

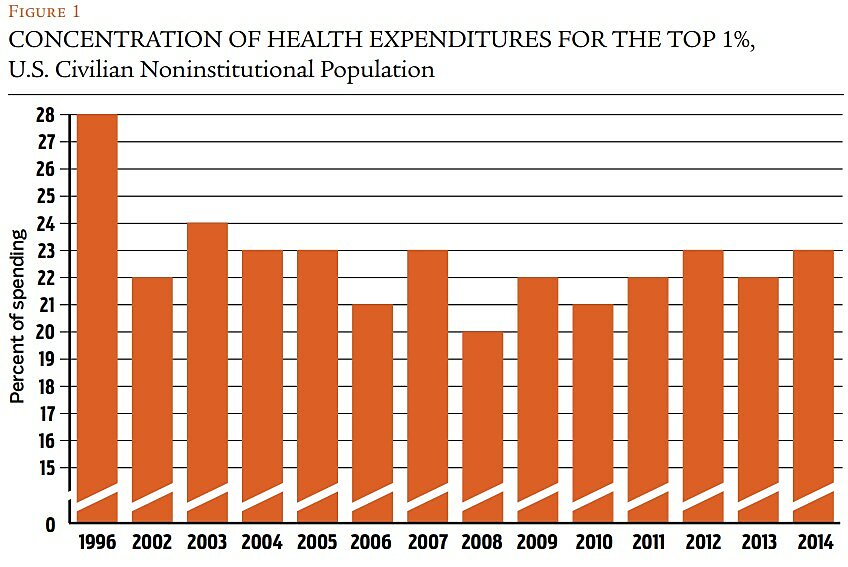
They began with earlier work by Berk and Alan Monheit that indicated that the top 1% of spenders in several surveys ranging from 1977 to 1996 accounted for more than one quarter of all health care expenses, and the top 5% accounted for more than half. Although the distribution of the top 5% apparently changed very little over those past three decades, subsequent examination found lessening of this concentration at the very top. William Yu and Trena Rice calculated that in 1998 the top 1% of spenders accounted for 28% of total expenditures, but that concentration measure decreased to 22% by 2002.

Zuvekis and Cohen concluded that increased use of prescription drugs was behind most of the reduced concentration in overall health spending. That conclusion resulted from their observation that recent spending on drugs was comparatively evenly concentrated across the population. However, they noted that the top 1% of people in the expenditure distribution still accounted for a relatively high share of all expenses, and that the top 10% accounted for nearly two-thirds. They call for efficiency-driven delivery system reforms to increase savings for this small but costly population.

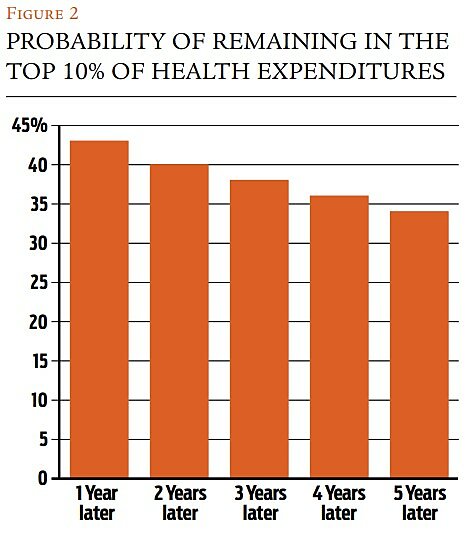
Top spenders / Steven Cohen enhanced this budding line of work by examining the “persistence” of concentrated levels of health spending in particular population cohorts over a two-year period. He noted the decrease in concentration at the upper tail (the top 1%) of the expenditure distribution from 1996 (28%) to 2013 (21.5%). Regarding persistence of this concentration among individual spending cohorts, Cohen found that of the top 1% in 2012, 14% maintained that ranking in 2013. Of the top 5% in 2012, 33.7% retained that ranking in 2013. Of the top 10%, 42.7% kept that top decile ranking in 2013, whereas 28% dropped down to the lower 75% level. So, as one expands the range of those in more concentrated spending cohorts, one finds more persistence across a two-year period. In the broadest cohorts, 74% of the individuals in the top half of the 2012 spending distribution retained that ranking the next year. At the other end of the spending distribution, roughly three out of four individuals (73%) in the bottom 50% of spending in 2012 similarly retained that ranking in the next year.

Low spenders are often seen primarily as “donors” to fund the more expensive costs of high spenders—not through more-transparent taxes and public expenditures, but through the cross-subsidies of mandates and restrictions.

Cohen’s analysis also unearthed some interesting findings about spending by the uninsured, who were disproportionately represented in the lower half of health care spending. The full-year uninsured comprised over 25% of those in the bottom half of health spending in both 2012 and 2013. Moreover, only 2% of individuals under age 65 who remained in the top decile of spending in both years were uninsured for all of 2013. In simpler terms, covering the full-year uninsured may not increase health care spending very much.

Other earlier analyses of spending persistence at the individual level through use of the MEPS data sharpened the direction of these trends. Steven Cohen and William Yu found that in 2005, 18.1% of the entire noninstitutionalized U.S. population in the top 1% of annual health spending retained that ranking in 2006. They also calculated that the full-year uninsured comprised 22.1% of the noninstitutionalized population under age 65 remaining in the bottom half of spending in both 2005 and 2006. Only 2.5% of those who remained in the top decile for both years were similarly uninsured during that period.

These MEPS-based analyses all remain limited to two-year intervals by that survey’s panel design for interviewing the same individuals over time. However, several other research efforts have tracked the spending distribution of smaller components of the U.S. population for somewhat longer periods.

Employer-sponsored insurance / Most notably, a research team led by Richard Hirth recently examined spending persistence within a large, under-65 population that was privately insured for six years through mainly self-insured medium and large employers. This unique study of long-term spending patterns relied on six recent years (2003–2008) of claims data from the Truven Health MarketScan Database. Over 2.5 million people could be followed for the entire period.

Hirth et al. found that almost 70% of individuals in the six-year sample never had annual health spending in the top 10% of the distribution. Of those in the top decile of spending in 2003, just 43.4% were likely to be there the next year (2004), but the drop-off in their spending then slowed in later years, with 34.4% of them in the top decile in 2008. In other words, the concentration of spending declines more moderately at the relatively high end (top 10%) over time, after the first two years. Another measure of this pattern can be found in how the top 1% of spenders in 2008 accounted for 24% of total health spending that year, whereas the top 1% of spenders for the full 2003–2008 period accounted for only 14% of all health spending during that interval.

Regulation - Winter 2017/18 - Article 4 - Figure 1

Despite this residual persistence in high-spending status for some, overall mobility in who enters and exits the top 10% distribution in any given year is substantial. Hirth et al. determined that more than half of those in the top 10% in one year were not in that decile the following year. Three-quarters of those who ever appeared in the top 10% of annual health spending for a single year did so only once or twice over the entire six-year period studied. The types of individuals most likely to be in the top decile of health spending included those who were much older, female, had early retiree status, or were union members.

What about comorbidities, the simultaneous presence of two or more chronic diseases in a patient? Certain chronic health conditions produced more persistent high spending (rheumatological or renal conditions, diabetes, AIDS), whereas spending for other conditions (myocardial infarction, tumors) declined more substantially over time.

Health savings accounts / The Hirth study provides the most extensive and ambitious update of more limited earlier work in this field of research. About two decades ago, Matthew Eichner, Mark McClellan, and David Wise sketched out an early model for predicting the persistence of high levels of health spending by individuals covered by employer-sponsored health insurance in a large firm. Their analysis was framed within the context of whether tax-advantaged health savings accounts (then-labeled “Individual Health Accounts”) coupled with high-deductible insurance could help reduce moral hazard, increase consumer sensitivity to health care costs, lower the projected increase in future health care spending, and increase personal saving for retirement needs. The countervailing public policy concern involved whether this approach would outweigh increased variation in lifetime health care cost burdens at the individual level compared to more comprehensive—but also more expensive—insurance coverage shared more broadly through similar premium payments.

For their research, Eichner, McClellan, and Wise drew upon employee health spending data within a single large firm over a three-year period. After modeling longer-term spending projections based on this longitudinal sample of insurance claims, they estimated the distribution of remaining balances in employee health savings accounts at the time of retirement. The researchers found that the relationship between expenditures two years apart was substantially weaker than the relationship between health spending just one year apart, and that the concentration of such spending declined consistently over more years. Their model projected that high expenditure levels typically did not last for many years and many employees would not even incur large medical expenditures over an entire working lifetime. Hence, Eichner, McClellan, and Wise calculated that, if enrolled in a high-deductible insurance plan with premium savings deposited into personal savings accounts, about 80% of employees would be left with at least half of their lifetime “savings” contributions at the time of retirement. Only about 5% would have less than 20% remaining in their accounts.

Keeping in mind that this early model was built on a number of flexible assumptions about cost-sharing levels and tax benefits along with limited empirical evidence, it still suggests that such a plan is feasible for reducing health insurance costs while increasing retirement savings. The authors acknowledged the need to balance the respective benefits against the risks of far less healthy individuals facing much higher lifetime out-of-pocket costs.

Medicare spending / About 10 years later, Gerald Riley provided another important contribution to research on the persistence of high-cost spending for a much different cohort: Medicare beneficiaries. Riley utilized the Continuous Medicare History Sample, a far more comprehensive time series of individual-level Medicare spending data, to analyze 30-year trends for the distribution and persistence of high spending over time. He found that the top 5% of Medicare’s traditional fee-for-service enrollees accounted for 54.2% of Medicare spending in 1975, but only 43% in 2004. Spending concentration for the top 1% of Medicare beneficiaries registered a similar decline, from 20.4% of spending in 1975 to 15.5% in 2004.

A different way to measure reduced Medicare spending concentration involved aggregating spending over four-year periods for the most costly cohorts of fee-for-service beneficiaries. For example, Riley calculated that the most costly 5% accounted for 34.4% of Medicare spending between 1975 and 1978, but only 29.8% between 2001 and 2004. Similarly, the top 1% accounted for 12% in 1975–1978, but only 10% in 2001–2004.

Riley suggests that the decrease in concentration in Medicare spending reflected an overall shift in costs from inpatient hospital services to less-concentrated ambulatory services, along with the relative stability in the dollar level of the Medicare Part B deductible. Other contributing factors included increased life expectancy, which tended to spread the same level of personal health care costs over a greater number of years and thereby reduced concentration in any given year, greater use of expensive technologies on less-sick patients, and more recent evidence of declining disability among the elderly.

Riley’s findings on trends in high-cost spending persistence were less pronounced. He concluded that it tended to increase from 1975 until approximately the mid-1990s (peaking in 1995, when 24.8% of the most expensive 5% of Medicare enrollees remained in that same category in the subsequent year). That level of high-spending persistence then decreased slightly thereafter.

You have unsaved changes on this Component item. Regulation - Winter 2017/18 - Article 4 - Figure 2

Two important limitations on the Riley estimates of Medicare spending concentration are that they did not involve enrollees in Medicare’s private managed care insurance plans (Medicare Advantage), and they ended before the effects of full implementation of prescription drug benefits within the traditional Medicare program could be measured.

Medicaid and CHIP / A very recent analysis of spending persistence for enrollees in Medicaid and the Children’s Health Insurance Program (CHIP) found strong links between patterns of high spending and longer-term health conditions.

Using claims data for nondual-eligible (i.e., not also eligible for Medicare) enrollees in New Jersey’s Medicaid and CHIP programs from 2011 to 2014, Derek DeLia examined the characteristics of those who appeared in the top 1% of statewide spending every year (persistently extreme spending). He found that one-fourth of extreme spenders in 2011 remained in that category throughout the four-year period. Most notably, almost all (89.3%) of the persistently extreme spenders were aged, blind, or disabled (ABD).

In other words, those who gained other traditional Medicaid coverage because they had low incomes—but were not otherwise suffering from longer-lasting and readily identifiable health care conditions—were far less likely to be extreme spenders. (The study did not include the Medicaid expansion population under the ACA.) DeLia’s analysis showed somewhat more spending persistence for Medicaid/​CHIP enrollees than observed in other populations. However, even within the ABD categories of Medicaid/​CHIP enrollees, it remains difficult to predict in advance which particular individuals—apart from those with developmental disabilities—become persistently extreme spenders in the future. The study noted that individuals in nursing facilities and those with very high risk scores were more likely to die or have persistently high spending (always in the top 10% but not always the top 1%) than to have persistently extreme spending.

End-of-life spending / Several other recent studies have targeted narrower cohorts of individuals assumed most likely to become high-cost patients, such as those in the last year of life. However, a review of Medicare beneficiaries who died in 2012 by Matthew Davis et al. concluded that spending near the end of life is a marker of general spending patterns often set in motion long before death.

The researchers found more persistent patterns of high spending in the full year before death for almost half of the beneficiaries studied. These deceased individuals who began the last year of life with high initial spending, which then steadily increased until death, were most likely to have four or more chronic conditions. Only 12% of deceased Medicare enrollees demonstrated a different late-rise spending pattern in which spending was very low up to four months before death and then increased exponentially.

Erik French et al. similarly challenged the view that end-of-life health care spending is a major component of overall medical expenditures. The authors examined data from nine developed countries including the United States. They found that spending at the end of life is modest relative to overall spending, and that the ratio between the two is relatively similar across very different health care systems. The researchers calculated that spending in the last 12 months of life accounted for only 8.5% of total health expenditures. They concluded that any savings from the scaling back of such spending would be “swamped by normal growth in health care costs.”

The uncertainty and variation in health risks and their likely costs over time argue for more private choice and less public uniformity in the scope and scale of what insurance covers and how it is financed.

Low-income “super utilizers” / Finally, a study by Tracy Johnson et al. examined the spending patterns over a two-year period for “super utilizers”: patients who consistently accumulate multiple hospital admissions.

The researchers focused primarily on low-income super utilizers who were either publicly insured or uninsured and treated within an urban safety-net-integrated delivery system. Although the authors found that approximately 3% of adult patients met their super utilizer criteria and consistently accounted for 30% of adult health care charges, fewer than half of those patients identified initially as super utilizers remained in that category seven months later. Only 28% remained super utilizers at the end of one year.

The majority of super utilizers experienced brief periods of very high spending and then returned to lower utilization. Per-person spending for the original cohort fell almost 60% after two years. Although the study did not adjust for patient death and attrition from the particular delivery system examined, it strongly suggests that there is far more instability in super utilizer status at the individual—as opposed to population—level, and often less time for targeted interventions to reduce such high spending.

CONCLUSIONS

The research does indicate that the concentration of health care spending has decreased, not increased, in recent decades. The persistence of high spending for particular individuals over time has also decresed. The current evidence base is complicated by studies that use different time periods and inconsistently slice across various segments of the health spending distribution (e.g., top 1%, top 5%, top 10%, top half, etc.).

However, they do suggest that sufficient uncertainty and variation in health risks, and their likely costs over time, still remain. This argues for more private choice and variation, and less public uniformity, in the scope and scale of what insurance covers and how it is financed.

As first suggested in the older work by Eichner, McClellan, and Wise, many people would benefit from the cost-saving incentives provided by the combination of less comprehensive insurance and tax-advantaged health savings accounts. This would give them greater control over their current health spending and help them to accumulate necessary savings to protect against future risks. The best available evidence on trends in health spending concentration and persistence suggests that a substantial majority of Americans would benefit from scaling back their insurance coverage, using it to protect against unlikely but catastrophic health shocks during their working lifetimes.

The research does indicate that the concentration of health care spending is decreasing, not increasing. The persistence of high spending for particular individuals over time is also decreasing. Many costly, high-risk individuals recover their health, alleviate the worst aspects of their conditions, or otherwise weather the financial storms of poor health—at least for a time. Sadly, other high risks drop out of insurance pools through earlier deaths. These issues are not new ones that private insurance markets, bolstered by better public policies, are incapable of handling.

Simply designating almost anyone who remains ill for more than a few days as suffering from a “chronic condition” and pushing everyone into the nearest large risk pool (with no questions asked about its premiums, practices, and policies) recycles unsolved problems while distracting us from the following three key elements of more robust solutions.

Multiple risk pools and public policy / The political search for the Holy Grail of establishing a “single risk pool,” such as the ACA’s efforts to mandate certain coverage levels and suppress price differences across the entire individual insurance market, remains destined to fail. However, our complex health care system can, to one degree or another, provide special protections for various riskier populations prone to needing more health care than they could finance on their own.

A host of semi-specialized risk pools already offer various types of such insurance protection. They include:

  • Medicare for the aged
  • Medicaid for the poor and low-income disabled
  • continuous coverage protection for employees with pre-existing conditions, under the 1996 Health Insurance Portability and Accountability Act
  • guaranteed renewability for those who bought and maintained coverage in the same individual insurance marketplace
  • subsidized high-risk pool coverage for those either denied coverage or charged much higher premiums because of the predictable health risks they present

The need for these subsidized protections against the high costs of health care and health insurance for the predictably unhealthy in private markets is reduced further by the switching costs of changing insurance plans and the effects of substantial tax subsidies that dull heightened cost consciousness. The latter dampen the real-world range of potential adverse selection and risk-based pricing.

Of course, public policy to address remaining problems still could be improved (e.g., extending continuous coverage incentives and risk protections to the individual market). But all of these measures do collectively manage to make the cost of care and coverage in the rest of our private insurance markets much more affordable, stable, and market-oriented. So the price of maintaining more choice and freedom within the sphere of private insurance includes ensuring that our safety net protections for the most vulnerable Americans are sufficient, robust, and realistic.

Prevent, treat, and alleviate high-risk conditions / Good policy solutions for managing and reducing the substantial costs of treating the small portion of the population with high-cost health conditions do not adopt the expedient bypass of simply rearranging the direction of dollars flowing through health insurance. Nor should they try to force individuals with different preferences and resources into large pools limited to ill-fitting standardized plans. Real progress requires improving the efficiency and effectiveness of our health care delivery system.

Further, a future-oriented reform strategy needs to focus more on a broader portfolio of public and private investments to reduce the incidence and delay the onset of costly chronic health conditions. Improving the social determinants of health, social mobility, family stability, early educational opportunity, health literacy, and health behavior needs to become more than a rhetorical placeholder parked on the sidelines of broader health care reform.

Targeted, transparent subsidies / Trying to finance the special needs of predictably high-cost individuals primarily through the cross-subsidy tools of insurance regulation undermines political accountability, efficiency, price transparency, and distributional equity. Political skeptics might observe that those are precisely the reasons why policymakers pursue such policies.

Charging even higher premiums to one group of insurance customers in order to make premiums for another group lower, or restricting the cost-conscious choices of the former in order to subsidize the broader spending preferences of the latter represents little more than less-progressive taxation through more politically expedient means. Moreover, the overall revenue base of individual insurance market premiums in particular is simply too narrow and precarious to support overly ambitious cross-subsidies.

A more effective way to assist individuals with high-cost conditions involves a different combination of investments and interventions:

  • Subsidize their unusual expenses more openly and compassionately, on the targeted basis of high need and low income, through direct, on-budget spending.
  • Improve the efficiency and effectiveness of their treatment.
  • Delay the onset and reduce the magnitude of those conditions in currently healthier and younger populations.

If we concentrate harder on reframing the questions and become more persistent in searching for better answers, then we would be better able to shed some of the mounting burdens imposed by current regulators, cross-subsidizers, and standardizers. We might even gain more space to become healthier and wealthier.

Readings

  • “End-of-Life Medical Spending in Last Twelve Months of Life Is Lower than Previously Reported,” by Eric B. French, Jeremy McCauley, Maria Aragon, et al. Health Affairs 36(7): 1211–1217 (2017).
  • “For Many Patients Who Use Large Amounts of Health Care Services, the Need Is Intense Yet Temporary,” by Tracy L. Johnson, Deborah J. Rinehart, Josh Durfee, et al. Health Affairs 34(8): 1312–1319 (2015).
  • “Health Expenditure Persistence and the Feasibility of Medical Savings Accounts,” by Matthew J. Eichner, Mark B. McClellan, and David A. Wise. In Tax Policy and the Economy, vol. 11, edited by James M. Poterba; MIT Press, 1997.
  • “Identification of Four Unique Spending Patterns among Older Adults in the Last Year of Life Challenges Standard Assumptions,” by Matthew A. Davis, Brahmajee K. Nallamothu, Mousumi Banerjee, and Julie P. W. Bynum. Health Affairs 35(7): 1316–1323 (2016).
  • “Long-Term Trends in the Concentration of Medicare Spending,” by Gerald F. Riley. Health Affairs 26(3): 808–816 (2007).
  • “Mortality, Disenrollment, and Spending Persistence in Medicaid and CHIP,” by Derek DeLia. Medical Care 55(3): 220–228 (2017).
  • “Most Americans Have Good Health, Little Unmet Need, and Few Health Care Expenses,” by Marc L. Berk and Zhengyi Fang. Health Affairs 36(4): 742–746 (2017).
  • “New Evidence on the Persistence of Health Spending,” by Richard A. Hirth, Teresa B. Gibson, Helen G. Levy, et al. Medical Care Research Review 72(3): 277–297 (2015).
  • “Prescription Drugs and the Changing Concentration of Health Care Expenditures,” by Samuel Zuvekis and Joel W. Cohen. Health Affairs 26(1): 249–257 (2007).
  • “The Concentration and Persistence in the Level of Health Expenditures over Time: Estimates for the U.S. Population, 2012–2013,” by Steven B. Cohen. Statistical Brief #481, Agency for Healthcare Research and Quality, September 2015.