The social rate of return would include all benefits and costs to members of society, not just financial returns to government itself. Serious analysts agree that rates should take into account both the displacement of private capital that occurs when government invests and the reduction in consumption that contributes to the government source of capital.
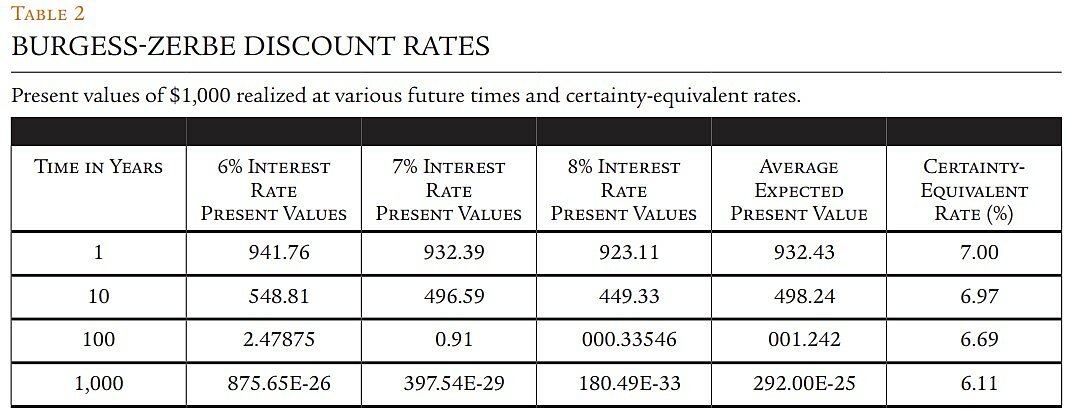
Using this approach, David Burgess and I concluded in a 2011 Journal of Benefit-Cost Analysis paper that public investment should pursue a 7 percent real rate of return (that is, the return after inflation) on average, with a range of 6–8 percent for different, “typical” government projects. At the extremes, when project funding and benefits affect only consumption and not capital availability, the acceptable rate might be as low as 3.5 percent; yet when projects reduce private capital but don’t contribute to capital formation, rates should be as high as 8.5 percent. It is, however, expensive to determine those differential consumption and capital effects on a project-by-project basis, so a useful rule of thumb suggests that projects should yield returns in the 6–8 percent range.
This simple but correct answer has been difficult to implement. Federal agencies have exhibited striking inconsistencies in their use of discount rates, not only across agencies but, in the case of some regulations, within agencies. More extreme, the Environmental Protection Agency and the National Oceanic and Atmospheric Administration have used low discount rates (3 percent) for benefits and high rates (7–10 percent) for costs, even during the same time period—a procedure that appears particularly problematic.
In an attempt to standardize the rate used, the Office of Management and Budget began issuing discount rate guidelines in 1972 and continues to issue them on an annual basis. In 1992, just prior to Bill Clinton entering the Oval Office, the guidelines lowered their recommendation from 10 percent to 7 percent, which remains the OMB-recommended expected return today.
Unfortunately, OMB guidelines have had little effect on rates actually used by government. This should not be surprising; the lower the rate, the more projects an agency can justify, while agencies that use higher rates are put at a competitive disadvantage.
ALTERNATIVE RATES—AND WHY THEY’RE WRONG
A number of rationales exist for not following the OMB-recommended 7 percent real rate. The most common one is the belief that market interest rates (e.g., for government or corporate bonds) represent the opportunity cost of capital, and that cost should not influence government investment. But in fact, market rates of interest do not take into account the actual returns on private investment, which is around 8.5 percent in real terms. (Burgess and I calculated this return as the ratio of national income minus compensation to labor divided by the replacement value of capital.)
Some proponents of alternative rate-of-return targets suggest using rates based only on the rate of time preference—that is, the amount one must pay an individual to induce him to delay consumption from today to the future. Such rates will be lower than the returns available on alternative investments. But this policy seems irrational if one’s goal is enhancing public welfare; focusing only on the cost of consumption delay ignores the opportunity costs of higher-yielding investments that are forgone because money is routed to lower-returning investments. In a world of capital constraints, should we invest in a project that yields 2 percent when projects yielding 7 percent are available? In addition, the rates of pure time preference ascertained from surveys vary wildly across individuals and thus provide little guidance for public investment choices.
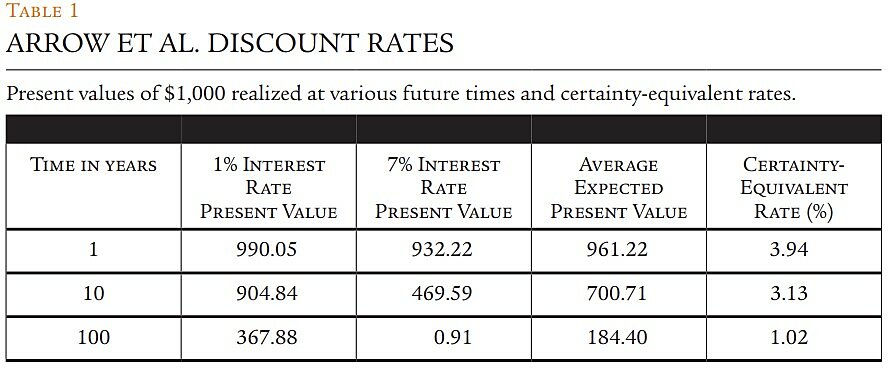
Arrow / Recently, in a paper published in the journal Science, Nobel economics laureate Kenneth Arrow and coauthors proposed social rates that vary from 1 percent to 3.94 percent, with the higher rate for projects with shorter time horizons and the rate falling toward 1 percent as the time horizon increases and benefits are realized further into the future. Those rates are based on time preference rates that vary from 1 percent to 7 percent. To translate the time preference rates into social rates, Arrow et al. start with the assumption that time preference rates in any future period vary from 1 percent to 7 percent with equal likelihood. Because they are interested in the effect of each of those rates, they average not the rates themselves, but the discount factors (DFs) associated with each rate for each time period of future returns.


