The chief objection Republicans have to a minimum wage increase is that the jobs lost from an increase outweigh the benefits of paying higher wages to low-wage earners who keep their jobs, and that a majority of those earning the wage are students who are not using their income to support a family. Democrats respond that the job losses from a wage increase would be minimal and argue that higher wages would provide a demand-side stimulus to the long-struggling economy. They also often claim that an increase would boost productivity via an efficiency-wage effect, and suggest that—precepts of economics be damned—companies employing low-income workers are simply insensitive to moderate wage increases.
The enthusiasm the White House and Democratic members of Congress have for a higher minimum wage did not appreciably dim when the nonpartisan Congressional Budget Office issued a report earlier this year acknowledging that increasing the wage to $10.10 an hour would destroy somewhere between 100,000 and 1 million jobs, with a best-estimate of 500,000. The administration responded by pointing to other academic research that purports to show job losses are minimal or nonexistent from minimum wage increases.
Policy and the public / The White House has the upper hand in this brief, at least from a political perspective. Polls show that the majority of Americans support a higher minimum wage and are unpersuaded by appeals to its side effects. The potential job losses from such a policy can be difficult for people to intuit, and the normal churn in an economy makes it impossible for the typical person to discern the effect of incased wages on employment.
An alternative way to convey the effects of a minimum wage increase is to estimate the employment effect on a state-by-state basis. In a recent working paper, “The $10.10 Minimum Wage Proposal: An Evaluation across States,” economists Andrew Hanson of Marquette University and Zack Hawley of Texas Christian University did precisely that, breaking down the job losses in each of the 50 states as well as the District of Columbia and Puerto Rico.
Hewing closely to the methodology that the CBO used in its recent report and using data from the Bureau of Labor Statistics’ Current Population Survey (CPS), they find that while every state will see fewer jobs because of a higher minimum wage, the distribution of job losses would fall disproportionately on the lower Midwest and South, where wages and costs of living tend to be lower. Hanson and Hawley suggest that a minimum wage is a policy tool best left for the states to deploy, or else left untouched.
Who earns less than $10.10? / Using disaggregated occupation data from the Bureau of Labor Statistics (BLS), Hanson and Hawley estimate that over 23 million Americans currently earn $10.10 an hour or less—roughly 16 percent of the 146 million people currently employed. The BLS does not report the entire wage distribution for each state—only the wage cutoffs for the 10th, 25th, 50th, 75th, and 90th percentile—but the percentile information is sufficient to come up with a fairly accurate estimate of how many workers are below the proposed minimum wage threshold.
Since $10.10 rarely aligned perfectly with a BLS percentile cutoff, Hanson and Hawley assumed a linear wage distribution and interpolated the interpercentile wage cutoffs when they estimated at what percentile the $10.10 would hit. From that estimate, they computed how many workers in each occupation and state were below the cutoff.
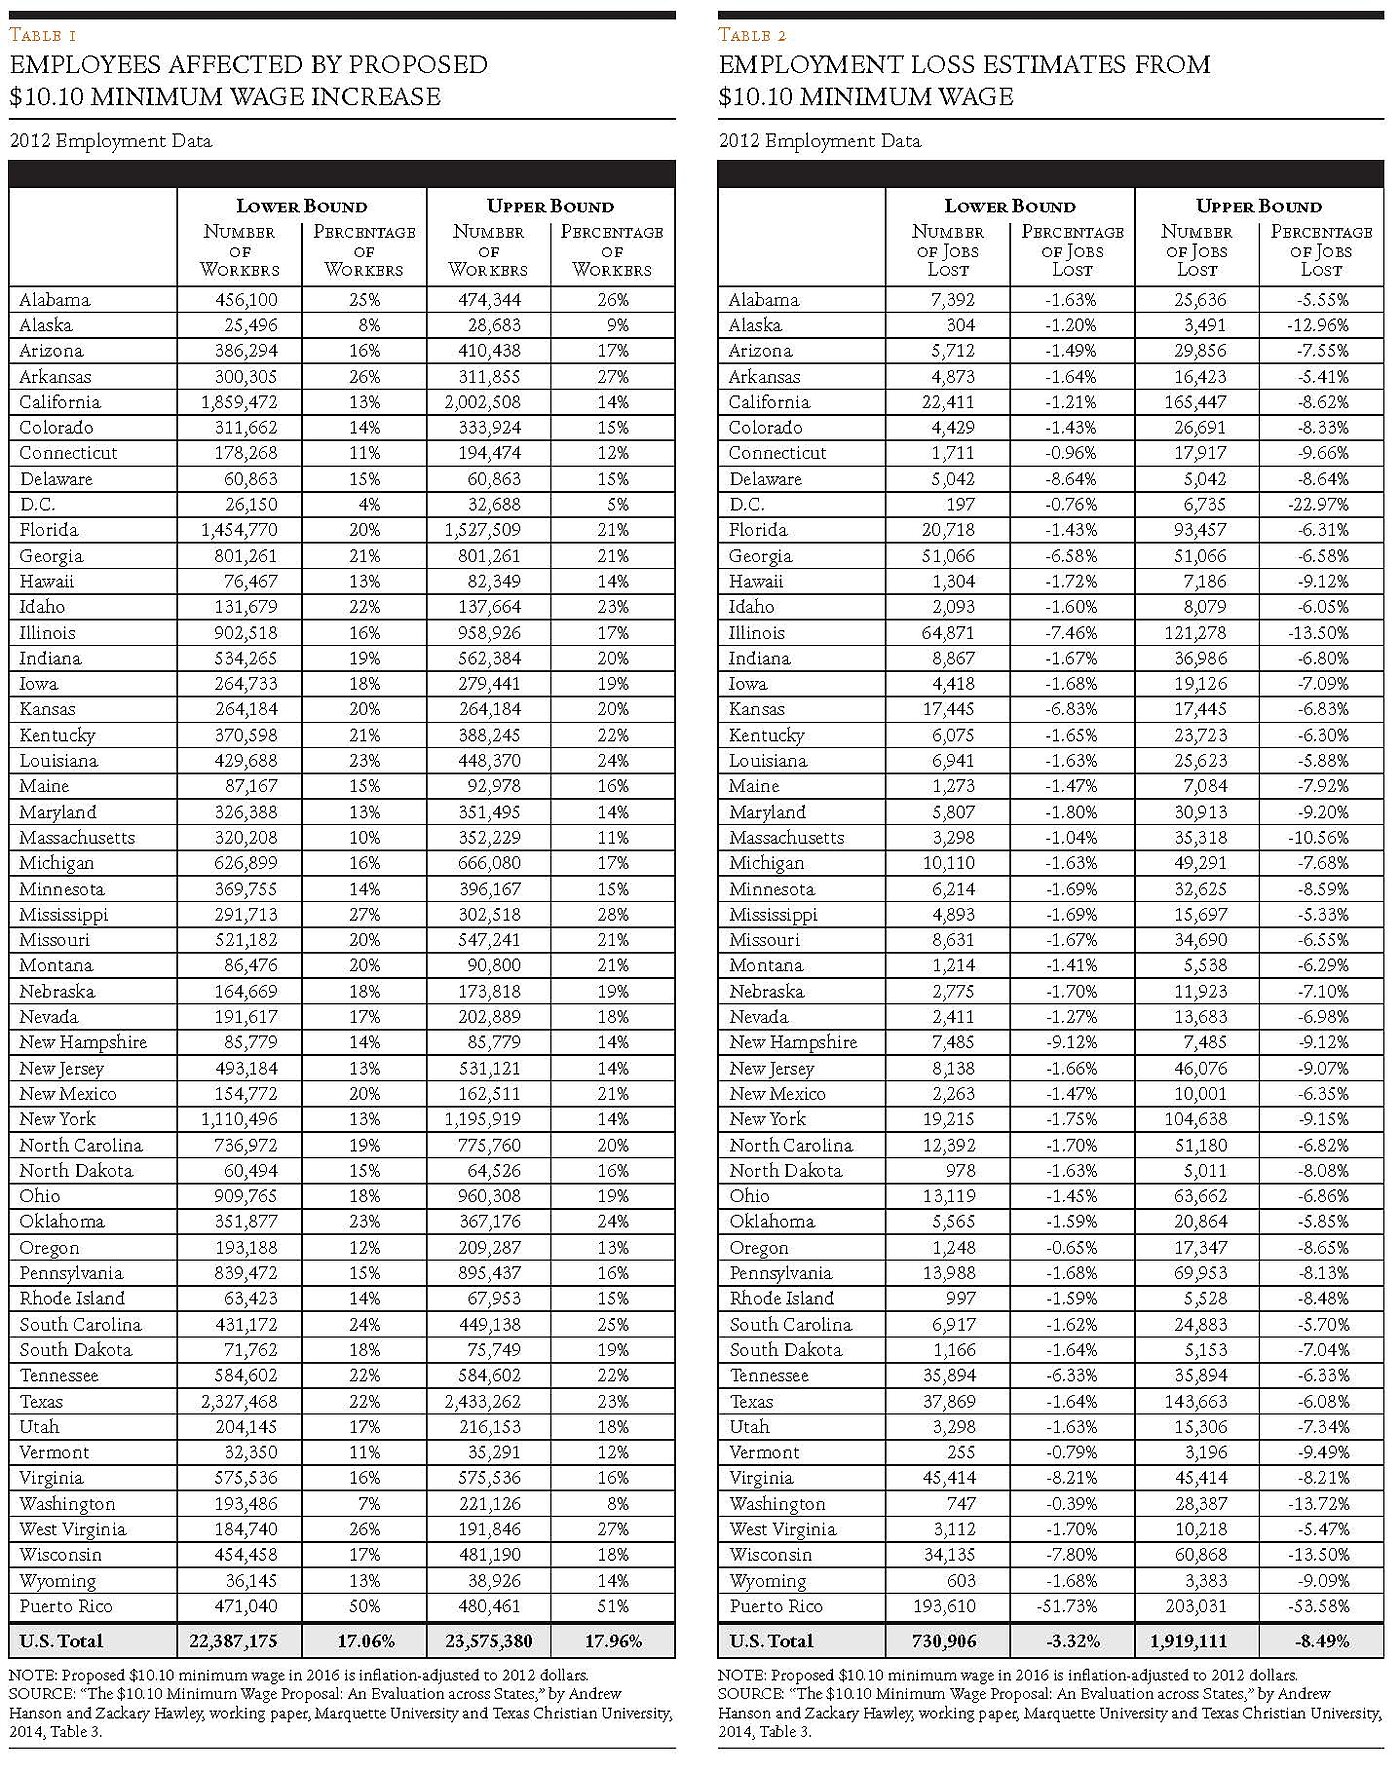
Table 1 shows the number of workers in each state they estimate earn less than the proposed minimum wage of $10.10. Since the data are for 2012, they deflate the proposed $10.10 hourly wage for 2016 (when the White House’s proposal would fully take effect) into 2012 dollars. Roughly 20 percent of the working population in 15 states earn under the equivalent of $10.10: Alabama, Arkansas, Florida, Georgia, Idaho, Kentucky, Louisiana, Mississippi, Missouri, Montana, New Mexico, Oklahoma, South Carolina, Tennessee, and Texas.
Job losses / Of course, not everyone who’s earning less than $10.10 an hour would lose his job if the government were to impose a higher minimum wage. To estimate the job losses, we need to know the elasticity of labor demand, which is a measure of how responsive employers are to changes in the effective price of labor.
Hanson and Hawley reviewed the academic literature on the matter and—consistent with the CBO study—concluded that the consensus elasticity of labor demand for low-skilled workers is between –0.1 and –0.2, and perhaps slightly lower for teenage workers. In other words, a 10 percent increase in wages would result in roughly a 1–2 percent decrease in labor demand.
Applying this range to their low-income wage distribution, Hanson and Hawley come up with a range of estimated job losses from a minimum wage increase to $10.10 that is consistent with the CBO’s nationwide estimate of jobs lost from raising the minimum wage. Their interval estimate—550,000 to 1.5 million jobs lost—is slightly higher than the CBO’s range, and is mainly due to differences between the two in the applicability of the higher elasticity estimate to the low-skilled workers at the low end of the income distribution.
Table 2 shows how the job losses would be distributed across the states. Again, the South and lower Midwest are the hardest hit. Kentucky, Alabama, South Carolina, and Louisiana each would lose somewhere around 25,000 jobs according to their estimates, and slightly less in Oklahoma and Wyoming. Illinois would lose over 120,000 jobs and Texas over 140,000. Puerto Rico would be the biggest loser by far: with fully 50 percent of its workforce currently earning less than $10.10 an hour, the job losses would be extreme—as many as 200,000 gone by dint of a wage distribution much lower than that of the rest of the country and an economy that’s been struggling for nearly a decade.

