Since 1997, the Office of Management and Budget has reported to Congress each year on the benefits and costs of federal regulation. These reports, which generally conclude that the benefits of regulation are an order of magnitude greater than the costs, are used to refute concerns that regulations may be hindering economic growth and to suggest that smart regulation can provide large net economic gains. For example, the Democratic National Committee’s 2012 platform defended President Obama’s regulatory record against Republican criticism by repeating the president’s claim that regulations issued over his first three years produced “more than 25 times the net benefits of the previous administration’s regulations.” The OMB’s draft 2013 report estimates that regulations issued over the last decade have aggregate benefits of between $193 billion and $800 billion, compared to costs ranging from $57 billion to $84 billion.
How accurate are these estimates? A closer examination reveals that the benefit figures are highly dependent on a few assumptions and that the ranges presented are unlikely to reflect the true uncertainty surrounding them.
The benefits and costs of regulations, individually and in the aggregate, are notoriously hard to measure. There is no mechanism like the fiscal budget for keeping track of regulatory compliance spending by individuals and businesses, nor of the benefits that regulation brings. The OMB’s annual report probably offers one of the most comprehensive estimates available on the expected benefits and net benefits (benefits minus costs) of federal regulation, but as the agency acknowledges, it has limitations.
Federal agencies publish between 3,000 and 4,000 regulations each year. To keep its task manageable, the OMB confines its aggregate estimates to “economically significant” rules (those with estimated impacts of $100 million or more in a year) that are issued by executive branch agencies over the previous 10 years for which the agencies have estimated both costs and benefits. Thus the estimates exclude the effects of regulations issued by independent regulatory agencies such as the Securities and Exchange Commission, the Federal Communications Commission, and the new Consumer Financial Protection Bureau, as well as high-impact regulations for which agencies did not estimate either benefits or costs. In the most recent report, for example, the OMB bases benefits and costs for the last 10 years on agency estimates for 115 regulations—less than one-quarter of the 536 economically significant final regulations issued during that period and a fraction of the 3,203 significant regulations and almost 38,000 total regulations published since 2003.
The reported benefits and costs are based on ex ante estimates developed by the agencies themselves before the regulations went into effect. The OMB recognizes that “prospective estimates may contain erroneous assumptions, producing inaccurate predictions” and cautions that its “reliance on [agencies’] estimates should not necessarily be taken as an OMB endorsement of all the varied methodologies used by agencies to estimate benefits and costs.” Those caveats often get lost in public discourse and the aggregate estimates are widely reported, without qualification, as evidence of the net benefits of federal regulatory activity (and recently, of the Obama administration’s skill at identifying new opportunities for beneficial market intervention).
How the Benefits Stack Up
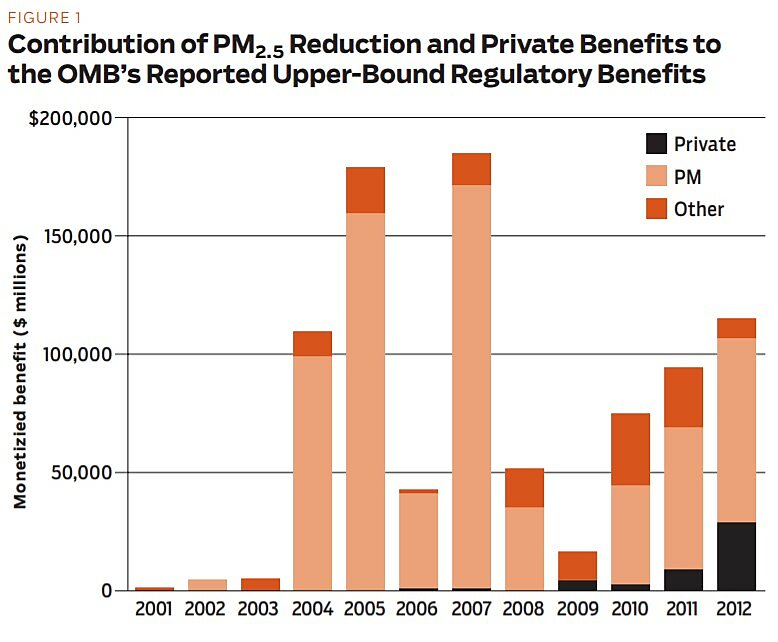
A look at how the OMB’s reported benefits break down is revealing. Figure 1 presents its upper-bound estimates of the benefits of regulations between January 21, 2001 and September 30, 2012. These data reflect “presidential years,” or regulations issued from January 21st in one year until January 20th of the following calendar year. The stacked column within each year distinguishes benefits attributed to three types of regulation:
- reductions in a single pollutant, fine particulate matter (PM2.5)
- regulations that yield private consumer savings
- all other actions
Since the first two categories of benefits comprise almost 80 percent of total reported benefits since 2001 (and over 90 percent of reported benefits in 2012), we examine them below.
Fine particulate matter | The majority of the OMB’s reported benefits derive from regulations that reduce PM2.5, which the Environmental Protection Agency predicts will reduce premature mortality. The EPA derives dollar benefits by multiplying an estimated reduction in premature deaths by a value per statistical life saved (VSL). In reporting these estimates in its annual report, the OMB recognizes the “significant uncertainty” associated with both “the reduction of premature deaths associated with reduction in particulate matter and … the monetary value of reducing mortality risk.”
The OMB identifies six key assumptions that contribute to this uncertainty in PM2.5 benefits estimates. One assumption is that “inhalation of fine particles is causally associated with premature death at concentrations near those experienced by most Americans on a daily basis.” The EPA bases this assumption on epidemiological evidence of an association between particulate matter concentrations and mortality; however, as all students are taught, correlation does not imply causation (cum hoc non propter hoc), and the agency cannot identify a biological mechanism that explains the observed correlation. Risk expert Louis Anthony Cox raises questions as to whether the correlation the EPA claims is real. His statistical analysis (published in the journal Risk Analysis) concludes with a greater than 95 percent probability that no association exists and that, instead, the EPA’s results are a product of its choice of models and selected data rather than a real, measured correlation.
Another key assumption on which the EPA’s (and therefore the OMB’s) benefit estimates hinge is that “the impact function for fine particles is approximately linear within the range of ambient concentrations under consideration, which includes concentrations below the National Ambient Air Quality Standard” (NAAQS). Both theory and data suggest that thresholds exist below which further reductions in exposure to PM2.5 do not yield changes in mortality response and that one should expect diminishing returns as exposures are reduced to lower and lower levels. However, the EPA assumes a linear concentration-response impact function that extends to concentrations below background levels. The OMB observes, “indeed, a significant portion of the benefits associated with more recent rules are from potential health benefits in regions that are in attainment with the fine particle standard.”
Based on its assumptions of a causal, linear, no-threshold relationship between PM2.5 exposure and premature mortality, the EPA quantifies a number of “statistical lives” that will be “saved” when concentrations of PM2.5 decline as a result of regulation. If any of those assumptions are false (in other words, if no association exists, if the relationship is not causal, or if the concentration-response relationship is not linear at low doses), the benefits of reducing PM2.5 would be less than estimated and perhaps even zero.
Further, as the OMB notes, “the value of mortality risk reduction is taken largely from studies of the willingness to accept risk in the labor market [where the relevant population is healthy and has a long remaining life expectancy] and might not necessarily apply to people in different stages of life or health status.” This caveat is particularly important in the case of PM2.5 because, as the EPA’s 2011 analysis reports, the median age of the beneficiaries of these regulations is around 80 years old, and the average extension in life expectancy attributable to lower PM2.5 levels is less than six months.
PM2.5 benefits also figure prominently in regulations whose purpose is not to reduce PM2.5. The EPA refers to these as “co-benefits” because they arise not directly from reducing the pollution targeted by the particular regulation, but from coincidental reductions in PM2.5. Figure 2 illustrates that in 2008, 2010, and 2012 in particular, co-benefits from PM2.5 reductions represent significant portions of total upper-bound benefits. (In 2008, the NAAQS for another criteria pollutant, ozone, derived over 70 percent of its benefits from reductions in PM2.5. In 2010, four regulations claimed 100 percent of their benefits from ancillary reductions in PM2.5. Three of those regulations targeted emissions of toxic air pollutants and the fourth established NAAQS for sulfur dioxide, another criteria pollutant. In 2012, 99 percent of the reported benefits from the EPA’s mercury and air toxics rule, discussed below, were co-benefits.)
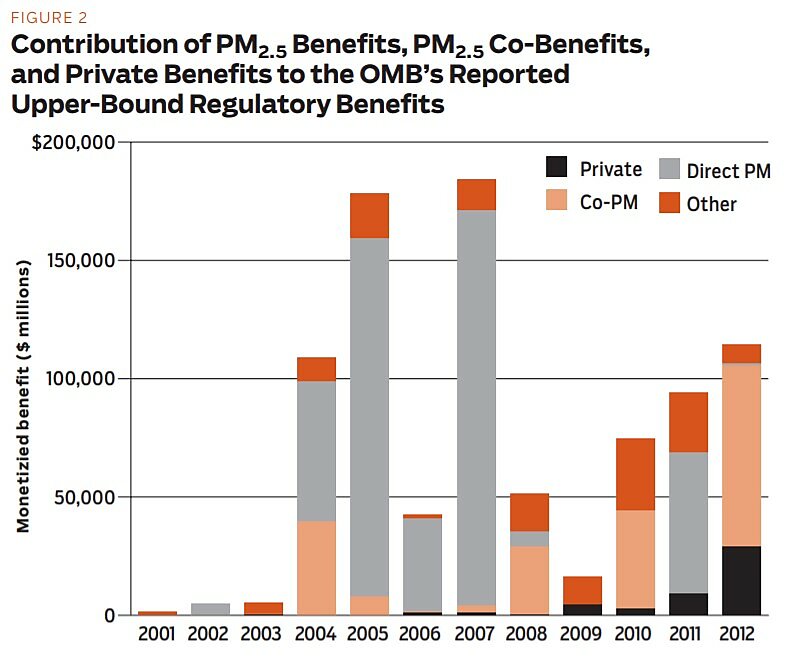
These co-benefits comprise over 50 percent of total benefits in these three years, and appear to be growing in prominence. Since 2009, the EPA has begun extrapolating health benefits to concentrations well below levels that it determines to be “protective of public health” when setting NAAQS.
The agency’s 2012 regulation limiting mercury emissions from electric utilities illustrates the effect of these assumptions. According to its Regulatory Impact Assessment (RIA), regulatory preamble, and fact sheets, the mandated new control technologies will reduce mercury from coal-fired power plants by 90 percent, avoid as many as 11,000 premature deaths per year, and yield annual economic benefits of up to $90 billion per year. The EPA’s estimated costs of complying with the regulation, while large at almost $10 billion per year, are barely 10 percent of those huge benefits.
The EPA’s fact sheet identifies the benefits of the rule as reducing emissions of heavy metals, including mercury and air toxics (MATS), which “are known or suspected of causing cancer and other serious health effects.” It focuses on mercury emissions from power plants, noting that
once mercury from the air reaches water, microorganisms can change it into methylmercury, a highly toxic form that builds up in fish. People are primarily exposed to mercury by eating contaminated fish. Methylmercury exposure is a particular concern for women of childbearing age, unborn babies, and young children because studies have linked high levels of methylmercury to damage to the developing nervous system, which can impair children’s ability to think and learn.
Despite the focus on the health effects of mercury emissions in its public statements, the EPA’s own analysis finds the reduction in mercury emissions brought about by the rule will offer little in the way of health benefits. The agency estimates the regulation will result in an increase of 0.00209 points in the average IQ of exposed children, for a total of 511 IQ points nationwide. Because children in the United States are exposed to mercury from other sources (natural sources, anthropogenic sources from other countries, and non-utility U.S. sources), the EPA estimates they will continue to experience a decrement of 23,909 IQ points nationwide after the rule is fully implemented. The rule will have reduced the IQ decrement from mercury exposure by 3 percent. The EPA assigns a dollar value ranging from $0.5 million to $6.2 million per year to these gains. The agency did not attempt to quantify or value the health benefits of the other air toxic emissions associated with this regulation.
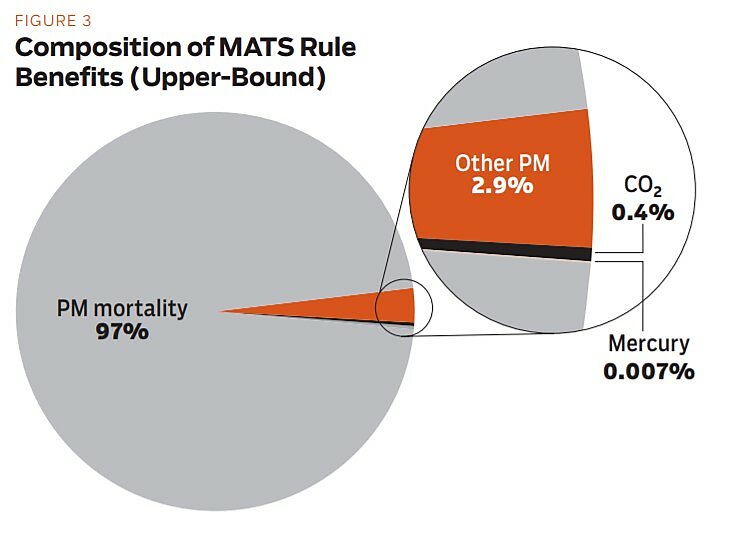
If these were the only benefits of the MATS rule, and if one took the EPA’s estimates of costs and benefits at face value, the $9.6 billion in annual cost would be between 1,500 and 19,000 times greater than the benefit. But the benefits of controlling mercury and air toxics comprise less than one ten-thousandths of the total benefits reported for the MATS rule. The claimed $33–$90 billion per year in economic benefits and 11,000 premature deaths avoided are derived by counting co-benefits that arise not directly from reducing toxic emissions, but from reductions in PM2.5 and carbon emissions that the EPA’s models predict will happen as beneficial side effects of the controls that will be required by the rule. Figure 3 illustrates the portion of benefits from the MATS rule that derive from reductions in mercury and air toxic emissions compared to co-benefits. Some 99 percent of the benefits attributed to the MATS rule are derived by assigning high dollar values to reductions in emissions of PM2.5, which are not the focus of this regulation and which are regulated elsewhere. The co-benefit attributable to a reduction in carbon emissions, which contribute to greenhouse gases in the atmosphere, is between 0.5 and 1 percent of the total benefits.
Recent RIAs derive significant benefits not from correcting market failures, but from allegedly saving businesses or consumers money by constraining their choices.
Consumer savings | Consistent with economic theory, the guiding presidential executive order governing regulation states that “agencies should promulgate only such regulations as are … made necessary by compelling public need, such as material failures of private markets to protect or improve the health and safety of the public, the environment, or the well-being of the American people.”
This philosophy recognizes that private markets are generally efficient at providing for the health and welfare of the public, and that regulatory intervention is appropriate only when private markets demonstrably fail. Yet recent RIAs derive significant benefits not from correcting market failures, but from allegedly saving businesses or consumers money by constraining their choices. Fuel and energy-efficiency standards, in particular, are justified not because they provide social benefits, but because they provide private benefits such as reduced spending on fuel and electricity.
The Department of Energy (DOE) has long estimated private savings associated with its appliance efficiency standards, but as Figures 1 and 2 show, private benefits contributed little to the totals until recently. In 2006 and 2007, the DOE reported approximately $1 billion in private benefits each year. Between January 20, 2009 and September 30, 2012, however, the DOE, EPA, and the Department of Transportation (DOT) have claimed over $45 billion in upper-bound benefits from private savings (15 percent of total benefits during that period).
The 2010 joint rulemaking by the EPA and DOT to reduce greenhouse gas emissions from vehicles illustrates the effect of this analytical approach. The agencies estimate that their regulations setting corporate average fuel economy (CAFE) standards for vehicle model years 2012–2016 will increase the cost of new cars by $345.9 million (present value discounted at 3 percent). They estimate the present value of the social benefits associated with reducing greenhouse gas emissions at $176.7 million. If these were the only costs and benefits considered, the regulation would impost net social costs on society, but the agencies calculate fuel savings over the life of the vehicles of $1.5 billion (also using a 3 percent discount rate).
These impressive private benefits imply that vehicle consumers and manufacturers are leaving money on the table. The agencies do not identify a material failure of private markets that would prevent consumers from reaping these cost savings absent government regulation. Rather, their results depend heavily on their assumptions about future energy prices and the choice of discount rate—a rate significantly lower than consumers reveal they use when making personal decisions. Their RIAs do not appear to appreciate other vehicle attributes consumers might value. By looking at average prices and usage patterns, and applying a low discount rate, the regulators paradoxically conclude, without any apparent irony, that by taking away consumers’ choices, they can make them better off. (For more on these supposed private savings, see “Working Papers,” Spring 2013.)
This appears to be a classic case of the “planner’s paradox,” where planned solutions always look better on paper than unplanned solutions because, in the words of Brian Mannix (“The Planner’s Paradox,” Summer 2003), the planner sees only his “data, assumptions, biases, and understandings of the way the world works…. All of the unseen difficulties with the planned solution—the data, assumptions, biases, and understandings of the world that turn out to be wrong—are invisible to the analyst because the data he considers are his own.”
Almost by definition, regulatory policies substitute the judgment of government regulators for those of individuals, and it’s easy to succumb to Hayek’s “fatal conceit.” When agencies calculate large net benefits without being able to identify a material failure of private markets, and must depend instead on assumptions about consumer irrationality such that they cannot be trusted to make decisions in their own self-interest, those benefits should be viewed with skepticism.
A More Balanced Presentation Is Needed
The OMB’s annual reports to Congress provide the most widely cited information available on both the benefits and costs of regulation. The agency qualifies the numbers it presents, listing numerous caveats and emphasizing that its reports merely summarize agencies’ ex ante estimates of the likely effects of forthcoming rules. Yet, many people—including representatives from the OMB—use the results to make sweeping statements about the benefits of recent regulation and to compare one administration with another.
The OMB’s current estimate of benefits from federal regulation depends heavily on how agencies quantify the benefits of regulations designed to reduce fine particles and those that achieve ancillary reductions in those particles while targeting something else, as well as the private savings for which agencies have hypothesized no market failure. Together, these categories of benefits contribute almost 80 percent of total benefits reported since 2001. Yet, as discussed, the assumptions behind these benefits should be viewed with some skepticism.
Agencies have strong incentives to demonstrate through analysis that their desired regulations will result in benefits that exceed costs. In principle, a benefit-cost analysis should be “complete.” It should include all the significant consequences of a policy decision: direct and indirect, intended and unintended, beneficial and harmful. In practice, all such analyses must to some degree fall short of completeness. The problem with the methods described here is that agencies do not appear to be approaching the problem objectively. On the benefit side of the equation, they quantify or list every conceivable good thing that they can attribute to a decision to issue new regulations, while on the cost side they only consider the most obvious direct and intended costs of complying with the regulation. Thus, in setting stringent utility emissions standards, the EPA dismisses risks associated with reduced electric reliability, the competitiveness of the U.S. economy in international trade, or the effect that higher electricity prices will have on the family budget. In establishing new fuel economy standards, the EPA, DOT, and DOE use unrealistic assumptions to estimate consumer energy and fuel savings, without considering all the complex factors that go into individual decisions about which car or appliance to buy.
The OMB’s role is to serve as a check against agencies’ natural motivation to paint a rosy picture of their proposed actions. While it cannot ensure that agencies consider all the possible consequences of an action in their analyses, it should try to ensure that the boundaries of those analyses are set with some regard to objective science. When a few categories of benefits that have questionable legitimacy puff up benefits by a five-fold margin or more, that does not appear to be the case.

This work is licensed under a Creative Commons Attribution-NonCommercial-ShareAlike 4.0 International License.