Terry Rainwaters owns 136 acres of rural land in northwest Tennessee. He lives on the property with his son, rents a second house on the property to long-term tenants, and farms the property commercially. Because he values his privacy, he has a locked gate posted with “no trespassing” signs at the entrance to the property.
Nevertheless, for years Tennessee wildlife officers have entered his land, roamed around in camouflage, spied on his son while he was hunting, and even installed a surveillance camera in a tree—all without consent, a warrant, or even probable cause.
The officers think they can treat Rainwaters’s private land like public property because of a state statute that allows them to “go upon any property, outside of buildings, posted or otherwise” to enforce hunting regulations. This statute embodies a legal rule called the open-fields doctrine, which gives government officials a blank check to enter private land whenever and however they please.
During Prohibition, the U.S. Supreme Court held that the Fourth Amendment—which typically requires officials to get a warrant before searching private property—does not protect “open fields.” Despite its name, the open-fields doctrine covers far more than fields. It applies to nearly all private land that does not immediately surround a home.
An Unprecedented Power
The Fourth Amendment restricts government officials’ power to search people and their property. Specifically, it protects “the right of the people to be secure in their persons, houses, papers, and effects, from unreasonable searches.” When it applies, the Fourth Amendment typically requires officials to get a warrant based on probable cause before conducting a search. Otherwise, the search is unconstitutional.
Search cases, then, often turn on whether the Fourth Amendment applies in the first place. Some cases are simple: If police jump through your bedroom window and start looking around for evidence, that’s plainly a “search” of a “house” that would require a warrant. But other cases are harder, especially when the Fourth Amendment’s text doesn’t supply an obvious answer. Suppose, for example, that instead of jumping through your bedroom window, police jump over your fence and start roaming around your farm. Do they need a warrant for that?

A century ago, the U.S. Supreme Court said no. In Hester v. United States (1924), the Court considered a case in which federal agents drove to a private farm, entered without a warrant, jumped a fence, and found a man with illegal whiskey. In a two-paragraph, unprecedented opinion, the Court upheld the search because “the special protection accorded by the Fourth Amendment to the people in their ‘persons, houses, papers and effects’ is not extended to the open fields.”
But the term “open fields” is a misnomer. The doctrine isn’t limited to fields or other open areas. Instead, it applies to all private land except for the small but ill-defined ring immediately surrounding the home, called the “curtilage.”
Apart from curtilage, the open-fields doctrine gives government officials free rein to invade private land. And that’s true even if the land is used and marked as private. You could put up a fence, post “no trespassing” signs, and use your land for private purposes—from farming, to hunting, to nature walks with your family—and none of it would matter. The open-fields doctrine allows officials to enter at will.
Measuring the Scope
Nobody has ever quantified the scope of the open-fields doctrine. In a way, that’s not surprising. The doctrine is so broad that the simple answer to “How much private land does the doctrine affect?” is “Most of it.” But we wanted a more precise answer, one that shows, in concrete terms, how much land is unprotected.
To figure that out, we drew upon three publicly available datasets:
- The US Geological Survey’s National Land Cover Database, which captures land cover features like waters and roads for every 30-meter by 30-meter block of land in the country.
- The US Geological Survey’s Protected Areas Database (Version 3.0), which captures public and publicly accessible land.
- Microsoft’s database of buildings for all 50 states and Washington, DC, which captures the size and location of nearly 130 million structures.
We then used ArcGIS Pro, a mapping software, to analyze these datasets. First, we excluded areas whose ownership or regulatory status was either unknown or too variable to classify in a uniform manner across all states: open waters, rivers, roads, public land, and American Indian land. This allowed us to isolate all private land in the country that a property owner might want shielded from government intrusion. Next, we used the mapping software to place a buffer around each building to represent the protected curtilage area.
We made conservative assumptions to avoid overcounting private land. We excluded all waters—including private waters—from our analysis because water rights work differently in each state and because the data did not distinguish between waters based on legal status. We did the same with roads.
We likewise took care to avoid undercounting protected curtilage. Because curtilage is a squishy concept that depends on several factors (proximity to the home, enclosure, domestic use, and visual concealment), we assumed a generous curtilage area: 100 feet in every direction, plus the building footprint. And because the data did not distinguish homes from other buildings, we assumed that all buildings have a protected curtilage area. (Where curtilage areas overlapped, though, we counted them only once.)
Finally, we used U.S. Census Bureau data to identify the percentage of rural land in each state because we wanted to see how the open-fields doctrine maps onto rural and urban areas. For that calculation, we used the Census Bureau’s definition of “rural,” which essentially means any area that is not densely populated or developed.
Figure 1 shows how our analysis works: Panel 1(a) shows a sample of land, property lines, and buildings (all in yellow) in Benton County, TN (where Rainwaters lives). In 1(b), the blacked-out areas indicate that waters, roads, and public lands are excluded. Finally, 1(c) puts a 100-foot curtilage buffer (in green) around each building. Notice in 1(c) how, even after all these exclusions, most of the land in each parcel gets no protection.
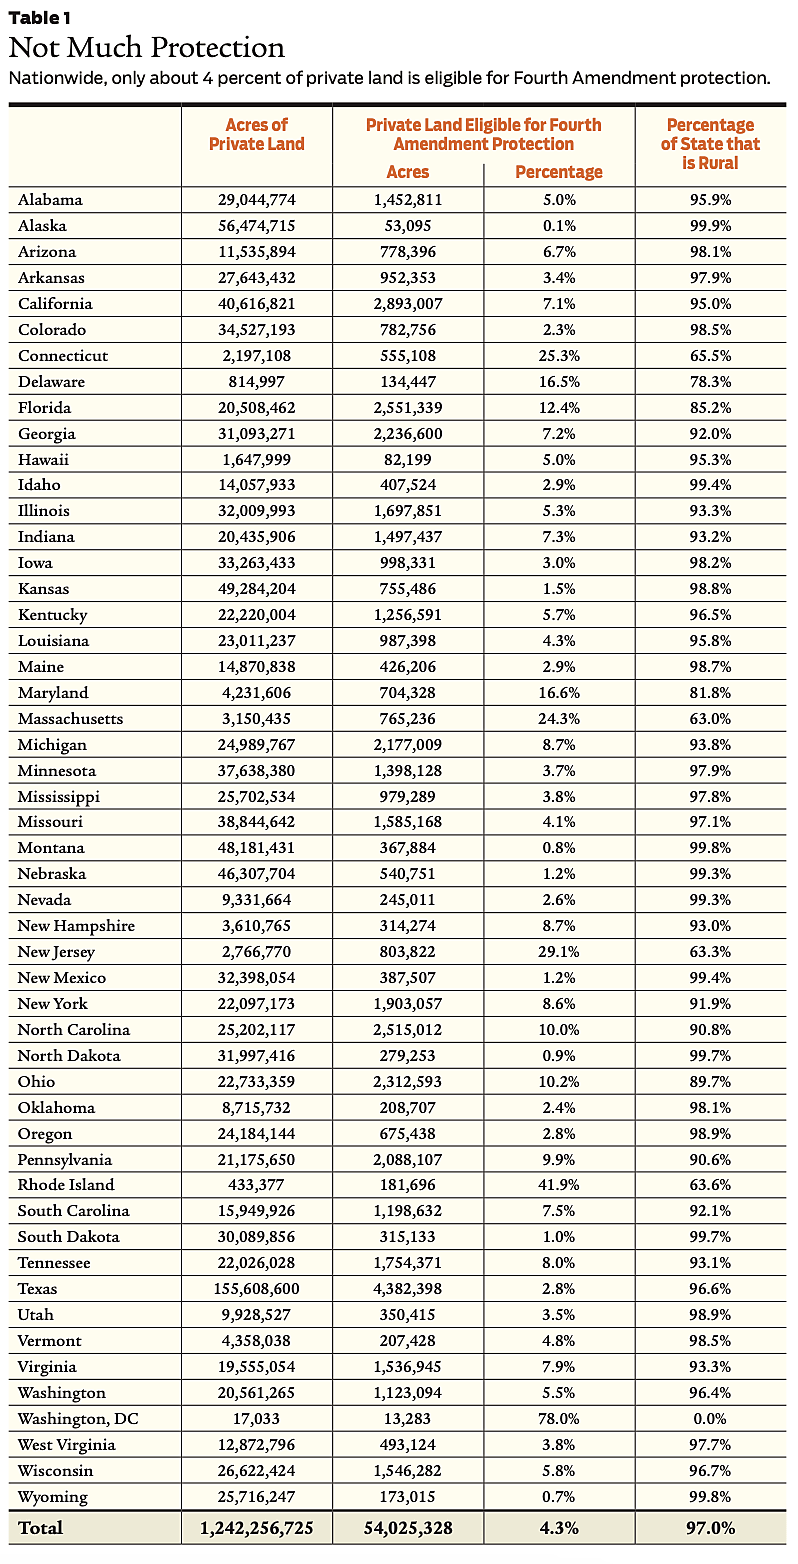
Using this methodology, we quantified the open-fields doctrine’s real-world effects. Table 1 identifies total private land acres, maximum protected private land acres (i.e., our generous estimate of the land that would qualify as curtilage under current Fourth Amendment law), maximum protected land as a percentage of total private land for each state, and percentage of land that is rural for the state and for the country as a whole.
A Continent-Spanning Concern
Our findings show that the open-fields doctrine’s scope is massive. Even under a generous definition of curtilage, only about 4 percent of all private land qualifies for Fourth Amendment protection under current law. In other words, nearly 96 percent of all private land in the country—about 1.2 billion acres—is exposed to warrantless searches.
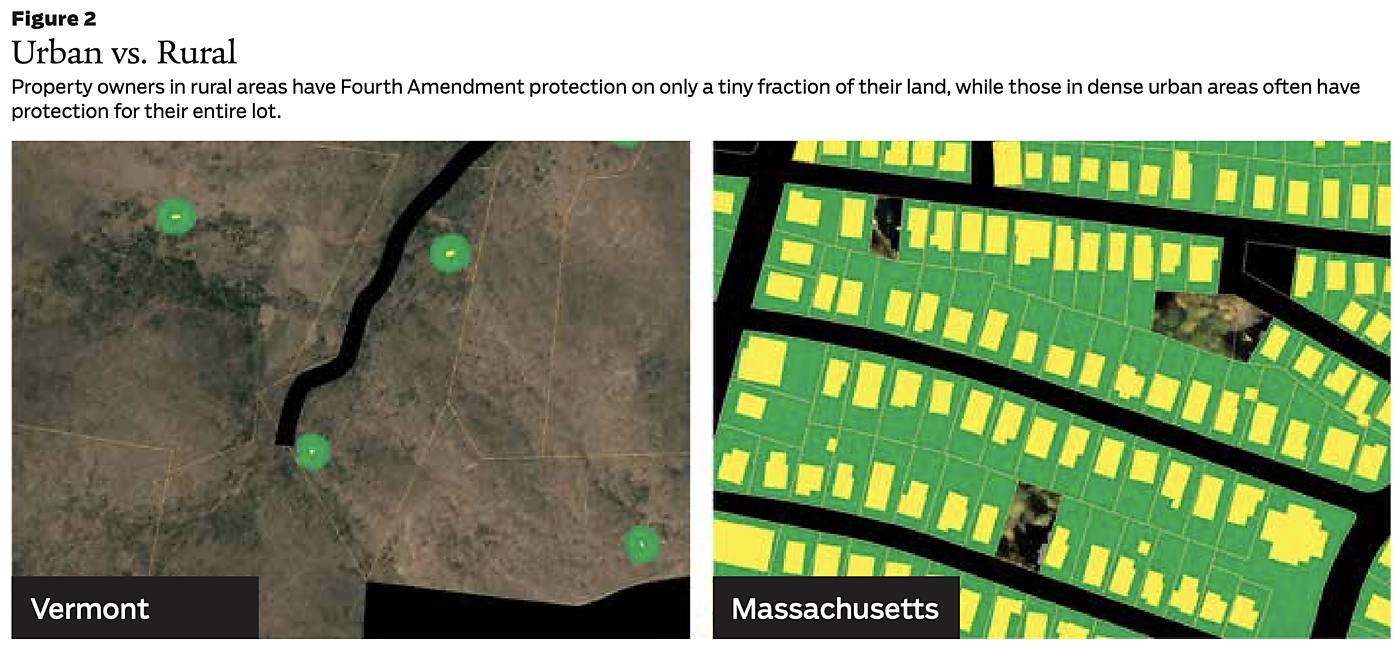
Our findings also show that the doctrine has an outsized effect on rural land. Compare 98 percent rural Vermont to its 63 percent rural neighbor, Massachusetts. Because Vermont has a greater share of private land on larger parcels, a far smaller portion of its land is eligible for Fourth Amendment protection—only about 5 percent compared to 24 percent in Massachusetts.
To illustrate this point, consider Figure 2. On the left is a rural area of Vermont. Only the land in green is eligible for Fourth Amendment protection, leaving most land open to warrantless searches by federal officials. On the right is a typically dense neighborhood in Boston where residents might expect less privacy as they live closer to neighbors. Yet, their small parcels give them the ability to protect their entire lot from government intrusion.

Real Victims
As Rainwaters’s example shows, the open-fields doctrine affects real people. In 2020, after years of intrusions onto his land by state wildlife officers, he partnered with the Institute for Justice to file a lawsuit arguing that Tennessee’s warrantless-entry statute violates the state’s constitution. And in 2022, a trial court agreed, declaring that all private land is eligible for protection in Tennessee and that the warrantless-entry statute is unconstitutional. As of this writing, the case is on appeal before the Tennessee Court of Appeals.
Josh Highlander has experienced similar intrusions. A few years ago, he bought 30 private acres in rural Virginia, posted “no trespassing” signs around the perimeter, and built a house there for his wife and two young children. Despite its size, the land is in a residential subdivision; Josh lives a few houses down from his parents. Like Rainwaters, Highlander expects privacy on his land. He enjoys hunting, farming, and taking walks through the woods with his family.
But Virginia wildlife officers recently shattered Highlander’s expectation of privacy. After issuing his brother a hunting citation in a different county (which the brother is contesting), the officers took a guilt-by-association approach with Highlander. They drove to a nearby cul-de-sac, donned full camouflage, walked right past his “no trespassing” signs, and roamed around his property looking for hunting violations. Eventually, they found a camera he uses to monitor wildlife and seized it. The officers did not have consent, a warrant, or probable cause, and they did not even issue Highlander a citation based on their invasion.
To make matters worse, the officers scared his family. His wife and young son were playing basketball in the yard when they saw the officers—to them, strangers whose “leafy jackets” made them look frightening—prowling around in their woods. They ran inside screaming. For weeks after that, Highlander’s son was afraid to play outside because he feared the “bogeyman” might be watching.
Now, Highlander is fighting back. Last year, he filed a lawsuit with the Institute for Justice arguing that Virginia wildlife officers have a statewide policy of invading private land without a warrant. Like Rainwaters in Tennessee, Highlander argues that the federal open-fields doctrine should not apply under his state’s constitution. The case is pending.
What happened to both landowners is all too common. Wildlife officers across the country often enter private land and install spy cameras, without consent or a warrant, to snoop for potential hunting violations. Last year, in a story that went viral, officers in Connecticut even attached a camera to a bear and let it roam around private land to see what they could find.
Nor is the problem unique to hunting. Farm inspectors, environmental inspectors, tax assessors, border police, ordinary police, and even local code-enforcement officers use the open-fields doctrine to invade private land—fenced, posted, or otherwise—without a warrant.

Given the spread of surveillance technology like traffic cameras, it’s tempting to think the greatest threats to privacy arise in cities. But for rural landowners, the open-fields doctrine poses at least as grave a threat to their privacy.
What States Can Do
Short of overturning the federal open-fields doctrine, not much can be done to rein in federal officials’ vast power to invade private land. Still, a lot can be done at the state level to protect private land from state officials. That’s because each state has its own constitution and laws that bind state officials. These can provide greater protection than the Fourth Amendment, which sets only a minimum level of protection against unreasonable searches by all government officials.

One way to bolster state constitutional protections for private land is to pursue litigation, as Rainwaters and Highlander are doing. For example, some state constitutions have search provisions with language that differs from the Fourth Amendment in important ways. In Hester, the Court stressed that the Fourth Amendment protects only “persons, houses, papers, and effects.” But 15 states have search provisions that replace the word “effects” with “possessions,” a term that courts in several states—including Mississippi, Vermont, and Tennessee (in Rainwaters’s case)—have held includes land beyond the curtilage. Other state constitutions use entirely different language than the Fourth Amendment. Virginia, for example, has a provision that protects “suspected places,” and Highlander is using that language to argue that the open-fields doctrine should not apply under the Virginia Constitution.
Other state constitutions mirror the Fourth Amendment. State courts, though, are free to decide that the protection offered by that language is broader than what the U.S. Supreme Court has recognized. For example, in People v. Scott (1992), New York’s high court became the first in the country to reject the federal open-fields doctrine under a state provision that mirrors the Fourth Amendment. The court held that “where landowners fence or post ‘No Trespassing’ signs on their private property or, by some other means, indicate unmistakably that entry is not permitted, the expectation that their privacy rights will be respected and that they will be free from unwanted intrusions is reasonable.”
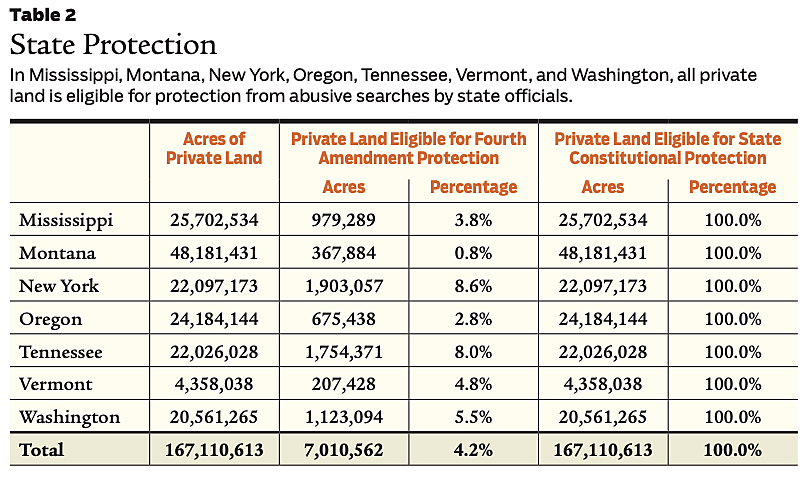
So far, courts in seven states—Mississippi, Montana, New York, Oregon, Tennessee, Vermont, and Washington—have rejected the open-fields doctrine under their state constitutions. And that makes a massive difference, at least when it comes to abusive searches by state officials. Table 2—which draws from and builds on Table 1—examines those seven states and compares the amount of private land eligible for Fourth Amendment protection with the amount of land eligible for state constitutional protection. In total, it’s a difference of 160 million acres.
Another way to protect private land is through legislative reform. State legislatures can pass laws that hold state officials to a higher standard than the federal open-fields doctrine. The Institute for Justice has a model bill, the Protecting Real Property from Warrantless Searches Act, that requires state officials to obtain a warrant based on probable cause before searching private land without consent except in a few limited circumstances like responding to a life-threatening emergency or other threats to public safety.
Both methods—litigation and legislation—can effectively flip state officials’ power to invade private land without a warrant from vast to narrow. Montana provides a stark example. Thanks to the state supreme court’s rejection of the open-fields doctrine under the Montana Constitution, 100 percent of private land in the state is eligible for protection against abusive searches by state officials. Meanwhile, just 0.8 percent of private land receives the same protection from federal officials. That’s a difference of almost 48 million acres.
Time to Reject the Open-Fields Doctrine
For the past 100 years, the open-fields doctrine has given government officials vast power to invade private land at will. Our analysis finds that, in practice, the doctrine excludes at least 96 percent of all private land in the country—nearly 1.2 billion acres—from Fourth Amendment protection. As a result, countless Americans have experienced shocking invasions of their property and privacy rights. And, as government power expands, more officials enforcing more regulations will use the doctrine to invade more private land.
But all is not lost. Despite the federal open-fields doctrine, state courts and legislatures have the power—today—to protect millions of acres of private land from warrantless intrusions by state officials. We urge state judges and lawmakers to do just that.
Readings
- “Another Victim of Illegal Narcotics: The Fourth Amendment (as Illustrated by the Open Fields Doctrine),” by Stephen A. Saltzburg. University of Pittsburgh Law Review 48: 1–25 (1986).
- “Quantifying Katz: Empirically Measuring ‘Reasonable Expectations of Privacy’ in the Fourth Amendment Context,” by Henry F. Fradella, Weston J. Morrow, Ryan G. Fischer, and Connie Ireland. American Journal of Criminal Law 38(3): 289–373 (2011).
- “Virginia Wildlife Agents Came onto His Land and Stole His Camera. Now He’s Suing,” by Joe Lancaster. Reason.com, June 8, 2023.
- “Wildlife Agents Placed a Camera on His Property Without a Warrant, Then Raided His Home After He Removed It,” by Joe Lancaster. Reason.com, December 2, 2022.

This work is licensed under a Creative Commons Attribution-NonCommercial-ShareAlike 4.0 International License.

