In a previous article (“Changing Rule Estimates” Spring 2014), Ike Brannon and I noted that the estimated aggregate burden of rules issued by some agencies tend to increase drastically from the rule’s proposed version to its final form. However, for other agencies, namely in the environmental realm, the estimated burdens tend to shrink from proposed rule to final regulation.
I examined 73 major regulations (rules with a compliance cost of $100 million or more) issued during the last six years that monetized both costs and benefits in the proposed and final versions. These data revealed which agencies saw their benefit-cost ratios change over the course of the rulemaking, as well as the aggregate change in net benefits during the life of the rulemaking.
Of the 73 rulemakings examined, 34 (46%) improved their benefit-cost ratio from the proposed to final versions. The net estimated benefits increased by $22.5 billion, or $308 million per rule.
A handful of rulemakings drove those results. The Environmental Protection Agency’s Mercury Air Toxics Standard (MATS) rule originally had estimated costs of $10.9 billion and benefits of just $118 million. But by the final rule, costs had declined to $9.6 billion and benefits increased to $57 billion, largely because they included the co-benefits of particulate matter reduction. This resulted in a gross change of $58 billion in favor of greater net benefits.
The Environmental Protection Agency’s Greenhouse Gas Standards for Heavy-Duty Trucks underwent a drastic change as well. In its proposed version, annual costs were $1.3 billion, compared to $11.5 billion in benefits. By the final rule, costs had increased to $2.5 billion, but benefits had also increased to $19.8 billion, leading to $7 billion in net benefit gains. However, the rule’s proposed benefit-cost ratio of 8.8:1 declined slightly to 7.6:1 for the final rule.
Other notable changes during the course of recent rulemakings:
- 2013 Ozone Standards: $20 billion reduction in net benefits
- 2017–2025 CAFE Standards: $4.4 billion decrease in net benefits
- 2015 Rule on Furnace Emissions: $4.4 billion increase in net benefits
In sum, while the ratio between benefits and costs might have declined for a majority of the major rules in the sample, the magnitude of some rules drove net benefits higher overall.
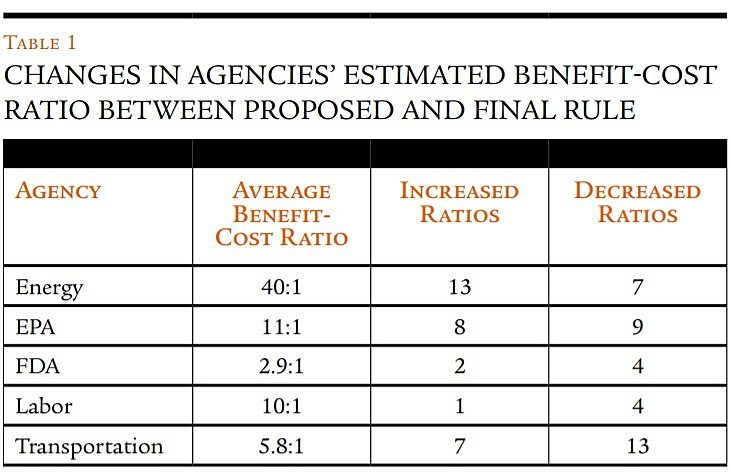
Agency results / Given the examples above, the agencies that showed the greatest “improvement” from initial rule proposal to final rule aren’t all that surprising. In the words of Washington rainmaker C. Boyden Gray, “Particulate matter and ozone seem to offer EPA an inexhaustible well of regulatory co-benefits.” This statement is evident in the data. Table 1 tracks agencies with at least five rulemakings in our sample, and presents the average benefit-cost ratio by agency and the number of rules with increased and decreased ratios.
The EPA and the Department of Energy stick out immediately. But like many issues with small sample sizes, outliers are a factor. For instance, in the Energy Department’s Pre-Rinse Spray Valves Efficiency Rule, the original benefit-cost ratio was 341:1, owing largely to the insignificant costs. The final rule further reduced costs and the ratio increased to 646:1. Despite the agency’s sterling ratio of 40:1, excluding the Pre-Rinse Spray Valve Rule reduces the average figure to a more pedestrian 8.7:1. The cumulative increase in net benefits for Energy is $5.9 billion, implying that the agency has acted to reduce costs and increase benefits during the rulemaking process.
The “inexhaustible well of regulatory co-benefits” has aided the EPA’s efforts to implement regulations as well. The agency’s benefit-cost ratio for individual rules ranged from costs exceeding benefits by 10:1, to benefits exceeding costs by 23:1. In the EPA’s 2013 Particulate Matter Rule, costs were merely $69 million, compared to $3.7 billion in benefits, good for a 54:1 ratio. The final rule drastically increased both: costs from $69 million to $350 million, and benefits from $3.7 billion to $8.2 billion. Thus, even though the benefit-cost ratio declined from the proposed to the final version, the net benefits increased by $4.1 billion.
Two agencies, the Food and Drug Administration and the Labor Department, had positive benefit-cost ratios but negative net benefit changes. The FDA only had six rules in the sample, but cumulative net benefits declined by $181 million as rulemakings progressed from the proposed to the final rule stage. In its Poultry Slaughter Inspection Rule, costs increased by only $5 million, but benefits declined by more than $340 million. Thus, the benefit-cost ratio went from 18:1 to a mere 1.2:1.
The Labor Department largely suffered because of net benefit declines to its controversial Fiduciary Rule for investment advisers, thanks to a massive increase in estimated costs. In the proposed version, costs were just $570 million; however, the final rule estimated burdens at $1.9 billion. Benefits did increase from $3 billion to $3.4 billion, but the benefit-cost ratio declined from 5.2:1 to 1.7:1. The agency gained largely from its Silica Rule, which managed to turn a proposal with $2.8 billion in net benefits into a final rule with $3.7 billion in net benefits. Despite those gains, the benefit-cost ratio declined from 5.2:1 to 4.5:1.
Explanations / This discussion largely illustrates that improvements in net benefits don’t equate to a more favorable cost-benefit ratio. The opposite is true as well. Although they are sometimes used synonymously, plenty of rulemakings can improve ratios while also narrowing the gap between benefits and costs. Likewise, agencies can drastically improve net benefits but the overall ratio can decline.
As noted, this is largely a function of rising benefits or declining costs. It appears from the data that costs are more prone to fall and benefits are more likely to rise, resulting in an increase in net benefits. Overall, regulators increased benefits in 39 rules from proposed to final stage, compared to 36 times for costs. With regard to net change, the cumulative benefits in the sample increased by more than $9 billion from proposed to final rule, but costs declined by $4.3 billion. The average rule in the sample gained $127 million in benefits, but lost $61 million in costs.
Does this mean that regulators often tap the “inexhaustible well of regulatory co-benefits” while finding ways to ease compliance burdens during the notice-and-comment period? It’s unclear. The largest rule in the sample, the proposed Ozone Rule, lost $13.6 billion in costs from the proposed to final stage, but benefits also declined by $33 billion. The MATS rule also shed $1.3 billion in costs during the process.
Improvements in net benefits do not necessarily equate to a more favorable cost-benefit ratio. The opposite is true as well.
One could assume that agencies begin a major rulemaking by proposing one of the strongest regulations possible, leaving room to remove compliance burdens to placate industry. However, if this were true, why do benefits increase more frequently and with a greater magnitude than costs? Perhaps agencies have broad discretion with benefits as well, able to appease environmentalists and special interests by touting higher health benefits with the final rule? It is notable that the FDA, one of the major agencies without access to particulate matter and ozone benefits, has one of the lowest benefit-cost ratios among the agencies studied.
Conclusion / The short answer to the title of this article is the Department of Energy, which improved the benefit-cost ratio in 65% of its rulemakings and increased net benefits by $5.9 billion. Yet that is hardly the entire story; explaining why benefits and costs vary so much within a rulemaking’s life is far more important than noticing that they fluctuate wildly.
Still, the trends across this sample are interesting. For observers who complain that public comments don’t move the needle on regulatory burdens, there is evidence that costs often decline, dropping by $4.3 billion in the sample. Benefits, on the other hand, seem to evolve and grow, gaining more than $9 billion.
With only 73 rules in my sample, additional data could inform this research. The specific answers to many of the questions posed are likely specific to individual rules and could inform federal rulemaking generally.

This work is licensed under a Creative Commons Attribution-NonCommercial-ShareAlike 4.0 International License.