This testimony will present the other factors that influence the intensity of immigration enforcement, such as unemployment, economic growth, violence, as well as the decisions made by policy makers both here and abroad. Historic changes in illegal immigrant apprehensions, intensifications of interior enforcement followed by relaxations, the ongoing drama of the Unaccompanied Alien Children (UAC), and other post-1965 shifts are all influenced by these other factors. Due to their influence, many immigration enforcement actions since 1965 have unintentionally increased the illegal immigrant population living in the United States.
ICE's Interior Immigration Enforcement
Immigration and Customs Enforcement (ICE) is the largest investigative division in the Department of Homeland Security (DHS) responsible for enforcing federal immigration laws as part of its mission.
The Numbers
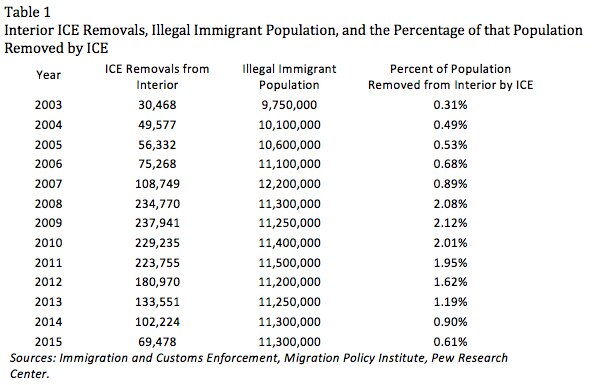
ICE's interior immigration enforcement peaked with 237,941 removals in 2009 and has subsequently dropped (see Table 1).1 From 2009 through 2015, ICE removals from the interior of the United States totaled over 1.17 million. During the years of the George W. Bush administration for which data is available, a total of 555,164 immigrants were deported from the interior of the United States Unfortunately, we do not have all of the data for interior immigration enforcement during the Bush administration, including all of the removal data for 2001 and 2002, as interior removals still does not bridge the gap .2 ICE has deported more immigrants from the interior of the United States during the Obama administration than it or similar agencies did during the Bush administration no matter how you measure it.
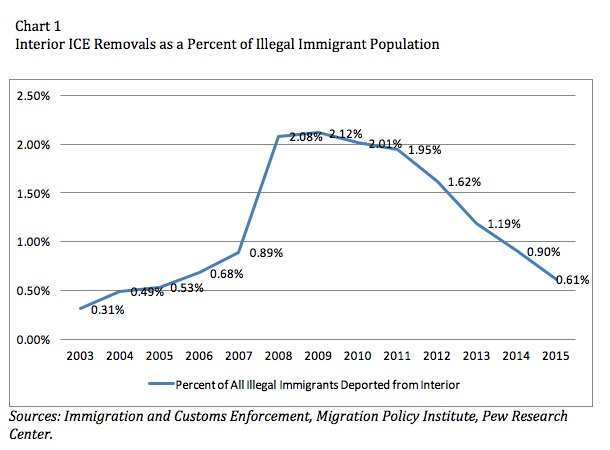
Another way of viewing the intensity of ICE removals is as a percentage of the total estimated population of illegal immigrants. ICE removals as a percentage of all illegal immigrants peaked at 2.12 percent in 2009 and average 1.48 percent during the Obama administration (see Chart 1). For the five available years of the Bush administration, an average of 0.83 percent of the illegal immigrant population were deported annually with a low point of 0.31 percent in 2003 and a high point of 2.08 percent in 2008. Even if we give credit for the 2009 removal percentage to President Bush because ICE had planned for that year's operations in 2008, his annual average rises to 1.01 percent. Restricting the credit for interior removals to President Obama's administration from 2010 onwards produces an average ICE interior removal rate of 1.38 percent. In both situations, President Obama's ICE has removed more illegal immigrants as a percentage of the entire population.
The major difference between the two administrations is the trajectory of interior removals. The number increased every year of the Bush administration while they began falling during President Obama's administration in 2010. As a result, the percentage of the illegal immigrant population removed in 2015 and the total number are similar to those of 2005 and 2006. They do not appear to be historically low figures compared to interior immigration enforcement in years prior to 2005.
Explanation for Shifting Numbers
There are several changes in policy and other actions that can potentially explain these fluctuations in interior immigration enforcement. Since 1976, several memoranda have sought to focus immigration enforcement on some classes of individuals and to deemphasize enforcement of others.3 More importantly, every Homeland Security appropriations bill since 2008 has required the DHS secretary to "prioritize the identification and removal of aliens convicted of a crime by the severity of that crime."4 The refocusing of ICE's immigration enforcement to removing convicted criminals betrays a quality over quantity approach to deportations that can explain a good portion of this decrease in enforcement.5 Another shift is the increased use of removals for illegal immigrants apprehended on the border as part of the Consequence Delivery System strategy implemented in 2005 and carried out by both ICE and Customs and Border Protection (CBP) in cooperation.6
Those are just two examples of policy shifts that affect ICE's interior enforcement. Instead of running through a litany of additional memoranda and policy changes, I will attempt to explain the underlying factors that prompted those changes in the first place.
Poor economic conditions in the United States have likely historically caused administrations and agencies to intensify immigration enforcement while improving economic conditions have caused a relaxation in such enforcement. Interior immigration enforcement ramps up when economic growth is poor and unemployment is high — as happened in the early 1950s, 1987, 1994, and 2001.7 The Great Recession of late 2007 to 2009 was preceded by a weakening economy and included a financial and housing crisis. Not coincidentally, these are the years when ICE's interior immigration enforcement efforts were most effective — adding more evidence to the theory.
Economists William F. Shughart III, Robert D. Tollison, and Mwangi S. Kimenyi found that immigration laws are more strictly enforced during times of economic contraction and less stringently enforced during times of economic expansion.8 Adding more weight to those findings, economists Michael D. Makowsky and Thomas Stratmann found that from 1990 to 2000, the number of immigration and I-9 audits and the amount of discretionary fines levied against firms for violating immigration laws increases with unemployment.9 Interior economic conditions also affect enforcement along the border. Economists Gordon H. Hanson and Antonio Spilimbergo found that when industries that employ many illegal immigrants expand rapidly then even border control relaxes to allow more in — at least from the early 1970s until the late 1990s.10 In each one of those situations, immigration enforcement decreases after the end of high unemployment and the resumption of economic growth.
Lack of Incentives
New immigration enforcement tools such as E-Verify provide an even starker lesson in incentives. Alabama, Arizona, Mississippi, and South Carolina mandate E-Verify for all new hires in order to prevent the employment of illegal immigrants and to thus turn off the jobs magnet. Employers largely ignore E-Verify in these states and officials there have little interest in enforcing it.11 In 2014, only 56 percent of the new hires in Alabama, 57 percent of the new hires in Arizona, 44 percent of the new hires in Mississippi, and 54 percent of the new hires in South Carolina were even run through E-Verify despite a universal mandate in all of those states.12 E-Verify will not be effective on its own, it must be enforced in order to achieve its goals and it is not being enforced in states where immigration enforcement is politically popular. If the governments of those states do not want to enforce E-Verify then it will be very difficult to enforce it in jurisdictions where the program is less well liked.
Turning off the jobs magnet is also very difficult and likely counter productive. According to a figure known as the place premium, the marginal Mexican worker can increase his or her wages by 253 percent by simply immigrating to the United States.13 An effective immigration enforcement tool must lower that gain enough to disincentivize him from attempting to work in the United States. From that starting point, E-Verify in Arizona lowered the wage gain for Mexican illegal immigrants from 253 percent to 240 percent.14 Although illegal immigrants already face a wage penalty relative to similarly skilled natives due to the I-9 requirements, likely the most successful illegal immigration deterrence program in effect, E-Verify's contribution barely registers.15
Interior enforcement tools like E-Verify can only have an impact if officers show up and monitor worksite compliance. The Obama administration has enforced worksite immigration laws more intensely than any other President.16 Compared to the George W. Bush administration, the Obama administration has issued 5.1 times as many final orders, 15.5 times as many administration fines, 8.3 times as many administrative arrests, and initiated 7.6 times as many cases.17 The Bush administration did ramp up interior enforcement on worksites when the economy started to slow at the beginning of the housing price decline. Enforcement increased even more rapidly during the Great Recession and then relaxed afterward as the economy improved — with the exception of administrative fines and final orders that have remained high through 2014. This pattern of enforcement and then moderate relaxation is partially consistent with the economic theories that track the intensity of enforcement on economic conditions.
If interior enforcement tools like E-Verify were to be initially effective at excluding illegal immigrants from employment in the United States then the wages in those occupations where they no long work would rise, which would then increase the wage gain from immigrating to the United States, which would then compensate immigrants who are willing to risk the illegal move. In this way, interior immigration enforcement tools could increase the power of the jobs magnet in the long run.
Border Enforcement
Two big events have happened over recent years along the Southwest border. The first is the collapse of Mexican illegal immigration and the second is the rise of apprehensions from nations Other Than Mexico (OTM) who are mostly Central Americans. Those combined facts have dramatically reduced the flow of illegal immigrants that has in turn reduced apprehensions from about 1.7 million in 2000 to 337,117 in 2015, a 79.9 percent decline.18 Apprehension figures for 2015 were a mere 60,000 below the same number apprehended in 1972.19
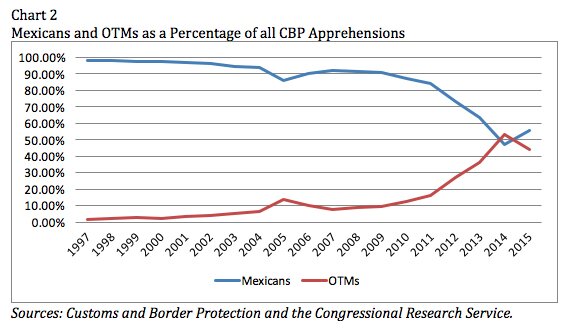
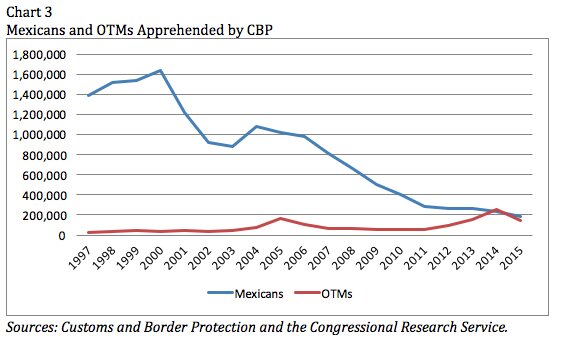
The number of Mexican apprehensions peaked in 2000 at just over 1.6 million and has since fallen by 88.5 percent to 188,122 in 2015 (Table 2).20 Over the same time period, OTMs increased from about 39,555 to about 148,995 — a 276.7 percent increase. In 2014, the number of Mexican apprehensions dipped below 50 percent and was overtaken by OTMs for the first time — although it lasted for only one year (Chart 2). The entire decline in apprehensions can be attributed to the collapse of Mexican illegal immigration. If OTM apprehensions had remained at their 2000 level while the Mexican apprehensions fell as they actually did, there would have been 110,000 fewer total apprehensions in 2015 than there actually were.
The increase in OTMs, especially those apprehended as Unaccompanied Alien Children (UAC), has caused much worry. Their numbers did increase by over 40,000 from 2010 to 2014 — a 269 percent boost.21 While that is a significant increase, they appear all the larger and take up a more significant chunk of apprehensions because of the collapse of Mexican apprehensions (Chart 3). For instance, UACs peaked at 68,631 in 2014 at 14 percent of all CBP apprehensions that year — a substantial figure (Table 3).22 If that same number of UAC had been apprehended in 2000, they would have comprised a mere 3.6 percent of all apprehensions.
Border apprehensions have historically been responsive to changes in Mexican real wages. For instance, a 10 percent relative decline in Mexican real wages is associated with a 6 to 8 percent increase in border apprehensions.23 This again reveals a paradox for U.S. immigration enforcement. If effective immigration restrictions raise U.S. wages in certain occupations then the benefits for an illegal immigrant to come here and work are higher than before, potentially wiping out the gains in enforcement.24
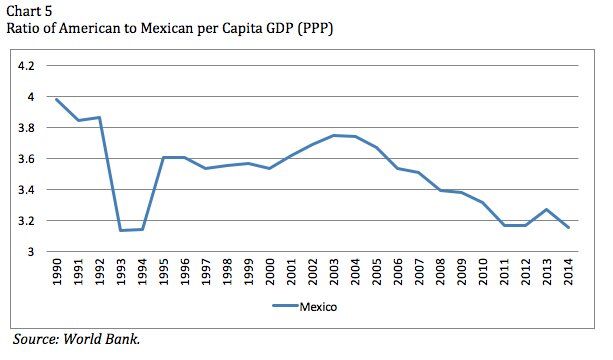
Those relative Mexican wages, however, have changed in a different direction. Mexican per capita GDP adjusted for purchasing power parity (PPP) is much higher today than it was in 1990 (Chart 4). The United States per capita GDP PPP was almost four times as high in 1990 as it was in Mexico but is now just below 3.2 times as high (Chart 5). The relatively improved Mexican economy is more attractive to would-be illegal immigrants, incentivizing more of them to stay and thus decrease Mexican apprehensions.
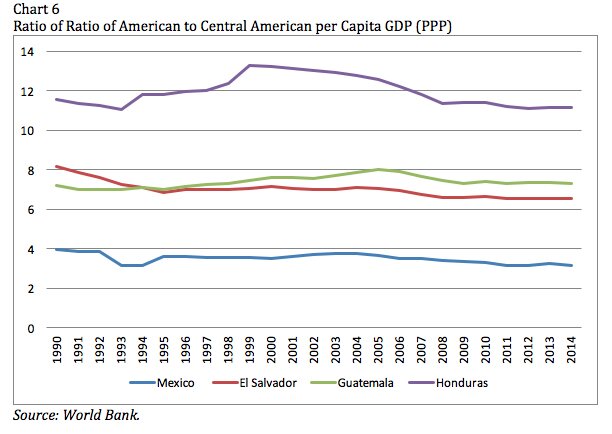
Those GDP per capita PPP ratios are far higher for Honduras, El Salvador, and Guatemala, indicating that the income gains from moving the United State are much higher in those Central American nations than in Mexico (Chart 6). We can expect more illegal immigration from those nations in the future.
Economist Michael Clemens at the Center for Global Development found that the number of emigrants drops dramatically when sending country per capita GDP PPP rises to between $7000 and $8000.25 However, that measurement takes account of all nations in the world and does not correct for transportation costs. Mexico's proximity to the United States greatly lowers the cost of immigrating here illegally, explaining the accelerated illegal immigration of Mexicans even after per capita GDP PPP there rose above $8000 in the mid-1990s.26 Central Americans can also illegally immigrate cheaply due to their proximity so we should not expect illegal immigration from those countries to halt once their income rises to the $7000 to $8000 range.
The age of mass illegal immigration from Mexico is likely over for myriad reasons other than border or interior enforcement. The most serious rebuttal to this analysis by Edward Alden, Bryan Roberts, and John Whitley attributes only one-third of the downturn in illegal immigration to increased enforcement while economic factors explain the rest.27 However, illegal immigration from Central American nations will likely continue in the future due to their relative poverty, high rates of violence, and increased family connections in the United States.
Criminal Alien Releases and Sanctuary Cities
DHS Secretary Jeh Johnson reacted to the President's executive action of November 20, 2014 by discontinuing Secure Communities (S-COMM) and replacing it with the Priority Enforcement Program (PEP). The new PEP prioritizes ICE's removal actions by allowing them to only seek a transfer from state or local custody to their own if the alien falls under Priority 1 — threats to national security, border security, and public safety.28
There is a potential tradeoff between enforcing immigration laws on the local level and the ability of local police to enforce local and state criminal laws.29 S-COMM's phased rollout from 2008 to early 2013 occurred in stages unrelated to local crime, thus providing an opportunity to use a difference-in-difference statistical approach to understand how the program affected local crime rates. S-COMM had zero effect on local crime rates one way or the other30 and it did not result in increased police brutality as some opponents feared.31 As a policy tool to increase public safety through targeted immigration enforcement, S-COMM has zero measurable effect on crime rates.
In 2015, ICE released 19,723 criminal aliens pending removal proceedings. Two-thirds of those releases were legally required rather than the result of ICE's use of discretion. ICE's custody decisions may be subject to review by the DOJ's Executive Office of Immigration Review (EOIR). Several Supreme Court cases have also placed limits on ICE's ability to detain removable individuals.32
Unaccompanied Alien Children
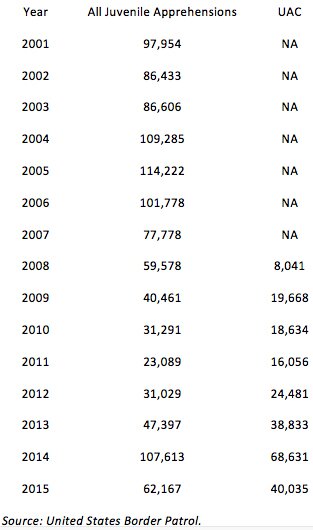
The 2014 surge in Unaccompanied Alien Children (UAC) produced fewer total juvenile apprehensions than in the years 2004 and 2005 and slightly more than the number apprehended in 2006 (Table 4).33 The subcategory of UAC has certainly surged in these years but the total number of juvenile apprehensions is not out of the ordinary. Due to the decline in all apprehensions, juvenile apprehensions are a much larger proportion of all apprehensions.
U.S. government policy did not likely cause the UAC surge. The two government policies most commonly credited with started the surge were the Trafficking Victims Protection Reauthorization Act of 2008 (TVPRA) and President Obama's June 15, 2012 announcement of Deferred Action for Childhood Arrivals (DACA) that could have signaled an amnesty that UAC could take advantage of. The TVPRA codified procedures created in the 1990s for the return of Mexican UAC without a court hearing unless they said they were trafficked or that they feared persecution. Central American UAC were granted a court hearing and, prior to the surge in 2014, were released to their families in the United States.
DACA likely didn't influence the surge of UAC in 2014 for several reasons. First, the increase in UAC was already underway by June 15th when President Obama announced DACA. Since February of that year, the monthly UAC had been above 2000 that prompted then Texas Governor Rick Perry to write a letter to President Obama complaining about the situation.34 President Obama announced DACA more than a month after received Governor Perry's letter.
Second, DACA did not set off a rush for the border.35 It took nine more months after DACA was announced for the number of UAC to rise above 4000 and another two years before it peaked in June 2014 at over 10,000 (Chart 7).36 Third, DACA would not apply to these UAC because they have not resided in the United States since June 15, 2007.37
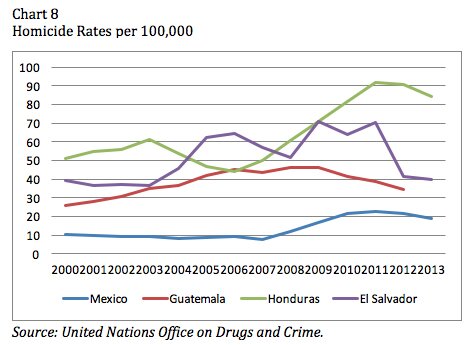
There are other explanations that help explain the surge of UAC. One is that violence in Honduras, Guatemala, and El Salvador are pushing these children out toward the United States. The homicide rates there are high and gang violence is targeting the young (Chart 8).
The second potential explanation is that the UAC surge is a result of family reunification. During the Great Recession, the stock of Central American illegal immigrants actually increased while the number of Mexicans decreased.38 The surge of UAC years later is merely the reunification part of that initial illegal immigration. Thirty-six percent of all unaccompanied children surveyed prior to 2014 had at least one parent already in the United States and many mentioned "family reunification" as a reason for coming.39 This survey likely undercounts the family ties between the UAC and their U.S.-based family because it excludes extended family connections. Aunts, uncles, and cousins also provide a bridge for UAC to live in the United States. Many of the UAC are being reunited with their family members in the United States even though many of them are currently working and living here illegally.40
The third potential explanation is that the Mexican government unintentionally caused this surge by substantially liberalizing its immigration laws. In 2011, the Mexican legislature passed the Migratory Act that went into effect on November 1, 2012. This law replaced the older and harsher General Law of Population that regulated immigration. The Migratory Act reduced the punishment for illegal entry, guaranteed the equal treatment of migrants and Mexican nationals under the law, established family unity as an important principle of Mexican immigration law, created offices to protect migrant rights and to investigate crimes committed against them, simplified entrance and residence requirements, established a points system for those who apply for residency, started a guest worker visa program for Guatemalans, and created a 3 day regional visitors visa for tourists from neighboring countries.41 The UAC were surging to record numbers within five months of the new Mexican law going into effect.
Related to the Mexican liberalization, El Salvador, Honduras, Guatemala, and Nicaragua signed a border control agreement in 2006 that created a common passport and obliterated border controls and movement restrictions between those four countries. Liberalized Mexican and Central American immigration laws and border controls likely played a large role in lowering the cost of migrating to the United States.42
Border Enforcement, Legal Migration, and Illegal Immigration
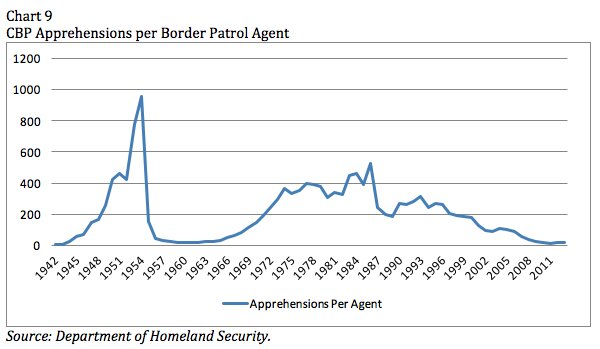
The age of modern illegal immigration began in 1965 when the federal government cancelled the Bracero guest worker visa program for Mexican farm workers and imposed numerical quotas on Western Hemisphere countries for the first time. Both actions limited the legal migration opportunities for lower-skilled Mexicans. Since then the border patrol's staff has grown over 14 fold while the size of the illegal immigrant population peaked at 12.2 million in 2007 before dropping to 11.3 million in 2014.43 The number of apprehensions per border patrol agent peaked at 953 in 1954 and has dipped to 16.6 in 2015, which approaches those seen during the heyday of the Bracero Program and during World War II (Chart 9).
The Bracero Program allowed in almost five million Mexican workers to legally work on American farms from 1942 to 1964. The program underwent several reforms during its existence so that by the mid-1950s working on a Bracero visa was easier than doing so illegally. Importantly, hiring a Bracero was also easier than hiring an illegal worker. As a result, the flow of Mexican illegal immigration reduced by upwards of 90 percent during the 1950s even as the number of border patrol officers remained about the same.
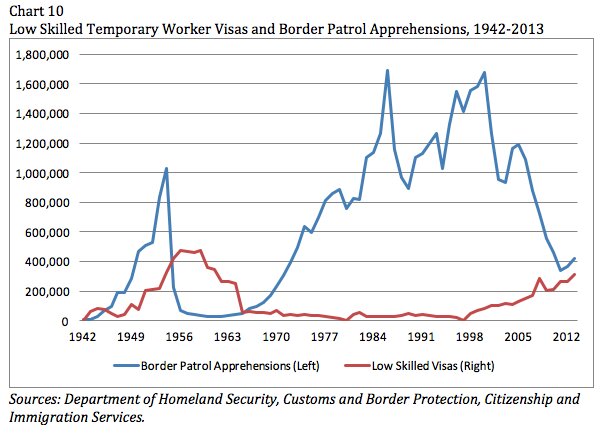
Congress ended the Bracero Program in 1964 and the Immigration Act of 1965 imposed quotas on Mexicans for the first time. Those restrictions on legal migration opportunities created a large black market that thrived after 1965. The H-2 visa program for lower-skilled workers could not legally supply American demand for Mexican laborers. After 1965, border patrol apprehensions skyrocketed as the number of legal migrant visas shrank and stayed small (Chart 10).
From 1965 to 1986, about 28 million illegal Mexican immigrants entered the United States who were then offset by 23.4 million departures, yielding a net increase of only 4.6 million.44 Like the Bracero Program, the illegal cross border flow was mostly temporary. From 1965 to 1986, the likelihood of an illegal immigrant returning to Mexico after his first trip varied between 55 to 60 percent while the likelihood of returning from a second trip was 80 percent.45
The passage of the 1986 Immigration Reform and Control Act legalized many of the unauthorized Mexicans but also interrupted the traditional temporary worker flow by boosting border security. As a result, a Mexican illegal immigrant's probability of returning to Mexico plummeted.46 Subsequent increases in border enforcement further reduced that probability as the price of smuggling into the United States likely rose in response.47 According to one estimate, a 10 percent increase in enforcement hours results in a 2.5 percent increase in the smuggling price.48 Even though smuggling prices and enforcement increased along the border, there is an emerging consensus that more security did little to reduce illegal immigration to the United States.49 High costs to enter increased the length of stay and increased the cost of leaving by limiting return options.
Even if immigration enforcement along the border did little to keep out illegal immigrants, it did produce many unanticipated consequences. The first is that it locked many unauthorized migrants inside of the United States.50 If the worker cannot move back and forth then his family will come north — and that is exactly what has happened since 1986. New border control strategies like the Consequence Delivery System and others are ineffective at deterring illegal immigration and do more to lock them inside of the United States once they are here.51 The second effect was that increased enforcement redirected the flow of illegal immigrants toward different sectors of the border, primarily Arizona, that funneled them to different parts of the United States.52 To quote Douglas Massey of Princeton University, "the unprecedented militarization of the Mexico-U.S. border not only failed in its attempt to reduce undocumented migration but backfired by increasing the rate of undocumented population growth and turning what had been a circular flow of male workers going to three states into a settled population of families living in 50 states."53
As a response to expanded border security, those who intend to immigrate illegally are increasingly overstaying their nonimmigrant visas. According to the most recent estimate by Robert Warren and Donald Kerwin, 58 percent of total illegal immigrant arrivals in 2012 were overstays up from an estimated 26 percent in the mid-1980s.54
Increased border enforcement and funding inevitably led to more apprehensions because the additional resources could always be used to apprehend more illegal migrants. This cycle was shattered by the Great Recession.55 Immigration enforcement did not end the age of Mexican illegal immigration, a financial and housing crisis did. A large migrant worker program like Bracero could channel the vast majority of future would-be illegal immigrants, likely to come from Central America, into the legal market. It worked during the early days of the Bracero Program and it could do so again.56
Conclusion
Many of the government's actions to halt illegal immigration are either ineffective or counterproductive. The economy and administrative incentives predictably drive cycles of harsh immigration enforcement and periods of relative laxity. New enforcement tools like E-Everify will be subject to these same constraints.
Illegal immigration from Mexico has collapsed due to economic changes in that country and the United States, not because of enforcement. However, illegal immigration has increased from Central American nations due to numerous factors in addition to the usual economic draw. If border enforcement was the explanation for the decline in Mexican illegal immigration then we should not also be seeing a rise in Central American illegal immigration. Illegal immigration from Central America will eventually decline when their incomes rise compared to those of Americans and violence declines.
The formidable state of current immigration enforcement, much of it expanded and more enforced by the Obama administration than any other administration, certainly deters some illegal immigrants from entering the United States but it also locks many inside who would otherwise have left.57 Instead of a large population flowing back and forth across the border based on economic cycles, the stock of illegal immigrants is more permanent and settled. According to estimates Professor Doug Massey at Princeton, there would be 5.3 million fewer illegal immigrants in the United States in 2011 if immigration enforcement was at its pre-1986 level.58
Notes:
1 Department of Homeland Security, "ICE Enforcement Removal Operations Report, Fiscal Year 2015," December 22, 2015, p. 8., https://www.ice.gov/sites/default/files/documents/Report/2016/fy2015removalStats.pdf.
2 Department of Homeland Security, "Yearbook of Immigration Statistic: 2014," Table 39, https://www.dhs.gov/yearbook-immigration-statistics-2014-enforcement-actions.
3 These listed memoranda are available, see U.S. Immigration and Customs Enforcement (ICE) Assistant Secretary John Morton, memorandum to ICE Field Office Directors, Special Agents in Charge, and Chief Counsel, "Exercising Prosecutorial Discretion Consistent with the Civil Immigration Enforcement Priorities of the Agency for the Apprehension, Detention, and Removal of Aliens," June 17, 2011, https://www.ice.gov/doclib/secure-communities/pdf/prosecutorial-discretion-memo.pdf.
4 The Consolidated Appropriations Act of 2016 (H.R. 2029) is the most recent version of this, https://www.congress.gov/bill/114th-congress/house-bill/2029/text.
5 Testimony of Marc R. Rosenblum, Deputy Director, Migration Policy Institute, before the Senate Committee on the Judiciary: "Oversight of the Administration's Criminal Alien Removal Policies," http://www.migrationpolicy.org/research/senate-judiciary-testimony-immigration-enforcement-priorities-and-use-prosecutorial.
6 Testimony of Michael J. Fisher, Chief, U.S. Border Patrol, U.S. Customs and Border Protection, before the House Committee on Homeland Security, Subcommittee on Border and Maritime Security: "Does Administrative Amnesty Harm our Efforts to Gain and Maintain Operational Control of the Border?" https://www.dhs.gov/news/2011/10/04/written-testimony-cbp-house-homeland-security-subcommittee-border-and-maritime.
7 Gordon H. Hanson, "The Governance of Migration Policy," United Nations Development Programme, Working Paper 2009/02, p. 21 http://hdr.undp.org/sites/default/files/hdrp_2009_02_rev.pdf, Gordon H. Hanson Hanson, "Illegal Migration from Mexico to the United States," Journal of Economic Literature, 44 (2006): 869-924, and William F. Shughart II, Robert D. Tollison, and Mwangi S. Kimenyi, "The Political Economic of Immigration Restrictions," Yale Journal on Regulation 4, 1 (Fall 1986): 79-97.
8 William F. Shughart II, Robert D. Tollison, and Mwangi S. Kimenyi, "The Political Economic of Immigration Restrictions," Yale Journal on Regulation 4, 1 (Fall 1986): 79-97.
9 Michael D. Makowsky and Thomas Stratmann, "Politics, Unemployment, and the Enforcement of Immigration Law," Public Choice 160, 1 (2014): 131-153.
10 Gordon H. Hanson and Antonio Spilimbergo, "Political Economy, Sectoral Shocks, and Border Enforcement," The Canadian Journal of Economics 34, 3 (2001): 612-638.
11 Alex Nowrasteh and Jim Harper, "Checking E-Verify: The Costs and Consequences of a National Worker Screening Mandate," Cato Institute Policy Analysis 775, July 7, 2015, p. 8, https://object.cato.org/sites/cato.org/files/pubs/pdf/pa775_1.pdf.
12 Alex Nowrasteh, "Employers Ignore E-Verify," Cato At Liberty, September 1, 2015, https://www.cato.org/blog/employers-ignore-e-verify.
13 Michael Clemens, Claudio Montenegro, and Lant Pritchett, "The Place Premium: Wage Difference for Identical Workers across the U.S. Border," Center for Global Development Working Paper Number 148, July 2008, p. 11, http://www.cgdev.org/sites/default/files/16352_file_CMP_place_premium_148.pdf.
14 Alex Nowrasteh and Jim Harper, "Checking E-Verify: The Costs and Consequences of a National Worker Screening Mandate," Cato Institute Policy Analysis 775, July 7, 2015, p. 11, https://object.cato.org/sites/cato.org/files/pubs/pdf/pa775_1.pdf.
15 Douglas S. Massey, Jorge Durand, and Nolan J. Malone, Beyond Smoke and Mirrors: Mexican Immigration in an Era of Economic Integration (New York: Russell Sage Foundation, 2002): 118-121.
16 Andorra Bruno, "Immigration-Related Worksite Enforcement: Performance Measures," Congressional Research Service, June 23, 2015.
17Ibid.
18 United States Border Patrol Apprehensions Data by Fiscal Year, https://www.cbp.gov/sites/default/files/documents/BP%20Total%20Apps,%20Mexico,%20OTM%20FY2000-FY2015.pdf.
19Ibid.
20Ibid.
21 United States Border Patrol, Total Unaccompanied Alien Children, https://www.cbp.gov/sites/default/files/documents/BP%20Total%20Monthly%20UACs%20by%20Sector.%2C%20FY10-FY16TD-Jan.pdf
22Ibid.
23 Gordon H. Hanson and Antonio Spilimbergo, "Illegal Immigration, Border Enforcement, and Relative Wages: Evidence from Apprehensions at the U.S.-Mexico Border," American Economic Review 89, 5 (1999): 1337-57.
24 For viewing the employment rate for illegal immigrant men at 85 percent in 2014 compared to 74 percent for native-born men, see George J. Borjas, "The Labor Supply of Undocumented Immigrants," NBER Working Paper No. 22102, March 2016, http://www.nber.org/papers/w22102.pdf.
25 Michael Clemens, "Does Development Reduce Migration," Center for Global Development Working Paper 359, March 2014, p. 35, http://www.cgdev.org/sites/default/files/does-development-reduce-migration_final_0.pdf.
26 Havocscope, "Prices Charged by Human Smugglers," http://www.havocscope.com/black-market-prices/human-smuggling-fees/.
27 Bryan Roberts. Edward Alden, and John Whitely, “Managing Illegal Immigration to the United States: How Effective is Enforcement?” Council on Foreign Relations (2013): 3, 38.
28 William A. Kandel and Lisa Seghetti, “Sanctuary Jurisdictions and Criminal Aliens: In Brief,” Congressional Research Service, October 20, 2015, p. 4, https://www.fas.org/sgp/crs/homesec/R44118.pdf
29 David S. Kirk, Andrew V. Papachristos, Jeffrey Fagan, and Tom R. Tyler, “The Paradox of Law Enforcement in Immigrant Communities: Does Tough Immigration Enforcement Undermine Public Safety?” The Annals of the American Academy of Political and Social Science 641, 1 (2012): 79-98.
30 Thomas J. Miles and Adam B. Cox, “Does Immigration Enforcement Reduce Crime? Evidence from Secure Communities,” Journal of Law and Economics 57, 4 (2014): 937-973.
31 Elina Treyger, Aaron Chalfin, and Charles Loeffler, “Immigration Enforcement, Policing, and Crime: Evidence from the Secure Communities Program,” Criminology and Public Policy 13, 2 (2014): 285-322.
32 Written Testimony of ICE Director Sarah Saldana for a House Committee on Oversight and Government reform hearing titled “Criminal Aliens Released by the Department of Homeland Security,” https://www.dhs.gov/news/2016/04/28/written-testimony-ice-director-house-committee-oversight-and-government-reform.
33 United States Border Patrol, Sector Profile 2015, https://www.cbp.gov/sites/default/files/documents/USBP%20Stats%20FY2015%20sector%20profile.pdf and
34 Sean Collins Walsh, “Perry Blasts Obama Over Rise in Illegal Immigrant Children Entering U.S. on Their Own,” The Dallas Morning News, May 7, 2012, http://www.dallasnews.com/news/politics/headlines/20120507-perry-blasts-obama-over-rise-in-illegal-immigrant-children-entering-u.s.-on-their-own.ece.
35David Bier, “Examining the UAC-DACA Link: New Data Show Child Migrant Crisis Began Before DACA,” Niskanen Center, February 9, 2015, http://niskanencenter.org/wp-content/uploads/2015/02/Examining-the-UAC-DACA-Link2.pdf.
36 United States Border Patrol, Total Unaccompanied Alien Children, https://www.cbp.gov/sites/default/files/documents/BP%20Total%20Monthly%20UACs%20by%20Sector.%2C%20FY10-FY16TD-Jan.pdf and David Bier, “Examining the UAC-DACA Link: New Data Show Child Migrant Crisis Began Before DACA,” Niskanen Center, February 9, 2015, http://niskanencenter.org/wp-content/uploads/2015/02/Examining-the-UAC-DACA-Link2.pdf.
37 United States Citizenship and Immigration Services, Consideration of Deferred Action for Childhood Arrival (DACA), https://www.uscis.gov/humanitarian/consideration-deferred-action-childhood-arrivals-daca#guidelines.
38 Bryan Baker and Nancy Rytina, “Estimates of the Unauthorized Immigrant Population Residing in the United States: January 2012,” Department of Homeland Security Population Estimates, March 2013, https://www.dhs.gov/sites/default/files/publications/ois_ill_pe_2012_2.pdf and Michael Hoefer, Nancy Rytina, and Bryan C. Baker, “Estimates of the Unauthorized Immigrant Population Residing in the United States: January 2007,” Department of Homeland Security Population Estimates, September 2008, https://www.dhs.gov/sites/default/files/publications/ois_ill_pe_2007.pdf.
39 United Nations High Commissioner for Refugees, “Children on the Run,” http://www.unhcrwashington.org/sites/default/files/1_UAC_Children%20on%20the%20Run_Full%20Report.pdf.
40Amy Taxin, “Immigrant Kids Sent to Adults Lacking Status,” Associated Press, April 19, 2016, http://bigstory.ap.org/article/40acc163f5d245ce940e7571d0f54bd4/immigrant-kids-placed-adults-who-are-us-illegally.
41 Alex Nowrasteh, “Mexican Immigration Policy Lowers the Cost of Central American Migration to the US,” Cato At Liberty, July 17, 2014, https://www.cato.org/blog/mexican-immigration-policy-lowers-cost-central-american-migration-us.
42Ibid.
43 “U.S. Unauthorized Immigrant Population, 1990-2014,” Pew Research Center, http://www.pewhispanic.org/2016/04/19/statistical-portrait-of-the-foreign-born-population-in-the-united-states-key-charts/#2013-fb-unauthorized-line.
44 Douglas S. Massey and Audrey Singer, “New Estimates of Undocumented Mexican Migration and the Probability of Apprehension,” Demography 32, 2 (1995): 203-213.
45 Doulas S. Massey, “Chain Reaction: The Causes and Consequences of America’s War on Immigrants,” IZA Julian Simon Lecture Series, (2011): 17, http://www.iza.org/conference_files/amm2011/massey_d1244.pdf.
46 Ibid. 29.
47Christina Gathmann, “Effects of Enforcement on Illegal Markets: Evidence from Migrant Smuggling along the Southwestern Border,” Journal of Public Economics 92, 10-11 (2008): 1926-1941.
48 Bryan Roberts, Gordon Hanson, Derekh Cornwell, and Scott Borger, “An Analysis of Migrant Smuggling Costs along the Southwest Border,” Office of Immigration Statistics, Department of Homeland Security Working Paper, November 2010, https://www.dhs.gov/xlibrary/assets/statistics/publications/ois-smuggling-wp.pdf.
49 Manuela Angelucci, “U.S. Border Enforcement and the Net Flow of Mexican Illegal Migration,” Economic Development and Cultural Change 60 (2012): 311-57, Gordon H. Hanson, Raymond Roberston, and Antonio Spilimbergo, “Does Border Enforcement Protect U.S. Workers from Illegal Immigration?” Review of Economics and Statistics, 84, 1 (2002): 73-92, Gordon H. Hanson and Antonio Spilimbergo, “Illegal Immigration, Border Enforcement, and Relative Wages: Evidence from Apprehensions at the U.S.-Mexico Border,” American Economic Review 89, 5 (1999): 1337-57, Gordon H. Hanson and Craig McIntosh, “The Demography of Mexican Migration to the United States,” American Economic Review, 99, 2 (2009): 22-27, Alberto Davila, Jose A. Pagan, and Gokce Soldemir, “The Short-Term and Long Term Deterrence Effects of INS Border and Interior Enforcement on Undocumented Immigration,” Journal of Economic Behavior and Organization 49, 2 (2002): 459-72, Douglas S. Massey and Fernando Riosema, “Undocumented Migration from Latin America in an Era of Rising U.S. Enforcement,” Annals of the American Academy of Political and Social Science 630 (2010): 137-61, Douglas S. Massey, Jorge Durand, and Karen A. Pren, “Explaining Undocumented Migration,” International Migration Review 48 (2014): 1028-61.
50 Doulas S. Massey, “Chain Reaction: The Causes and Consequences of America’s War on Immigrants,” IZA Julian Simon Lecture Series, (2011), http://www.iza.org/conference_files/amm2011/massey_d1244.pdf.
51 Jeremy Slack, Daniel E. Martinez, Scott Whiteford, Emily Peiffer, “In Harm’s Way: Family Separation, Immigration Enforcement Programs and Security on the U.S.-Mexico Border,” Journal on Migration and Human Security 3, 2 (2015): 109-128.
52 Douglas S. Massey, Jorge Durand, and Karen A. Pren, "Why Border Enforcement Backfired," American Journal of Sociology 121, 5 (2016): 1558.
53Ibid.
54 Robert Warren and Donald Kerwin, "Beyond DAPA and DACA: Revisiting Legislative Reform in Light of Long-Term Trends in Unauthorized Immigration to the United States," Journal on Migration and Human Security 3, 1 (2015): 93.
55 Douglas S. Massey, Jorge Durand, and Karen A. Pren, "Why Border Enforcement Backfired," American Journal of Sociology 121, 5 (2016): 1562-63.
56 Alex Nowrasteh, "Enforcement Didn't End Unlawful Immigration in 1950s, More Visas Did," Cato At Liberty, November 11, 2015, "https://www.cato.org/blog/enforcement-didnt-end-unlawful-immigration-1950s-more-visas-did.
57 Doris Meissner, Donald M. Kerwin, Muzaffar Chisti, and Claire Bergeron, "Immigration Enforcement in the United States: The Rise of a Formidable Machinery," Migration Policy Institute Report, January 2013, p. 19, http://www.migrationpolicy.org/research/immigration-enforcement-united-states-rise-formidable-machinery
58 Doulas S. Massey, “Chain Reaction: The Causes and Consequences of America’s War on Immigrants,” IZA Julian Simon Lecture Series, (2011): 19, http://www.iza.org/conference_files/amm2011/massey_d1244.pdf.
