The expansion of private school choice programs has been accompanied by a growing call for regulation of those programs. Individual private schools decide whether to participate in voucher programs based on expected benefits (additional voucher revenues) and expected costs (additional red tape). An unintended consequence of attaching heavy government regulation to voucher programs is that it raises the costs of participation, which could reduce the number of private schools available to the children who need them the most. Moreover, we hypothesize that lower-quality schools are more likely to participate in regulated voucher programs because they are the most desperate for additional enrollment and funding.
We use probit regression analysis to examine the quality of schools that elected to participate in voucher programs in Ohio and Milwaukee. Using tuition and enrollment levels—proxies for price and quantity demanded — we find evidence suggesting that lower-quality schools are more likely to participate in voucher programs. Specifically, a $1,000 increase in tuition is associated with 3 percent lower likelihood of participation in the Milwaukee voucher program and a 3.8 percent lower likelihood of participation in the Ohio Educational Choice voucher program. We also find that a one-point increase in a GreatSchools review score is associated with a 14.8 percent reduction in the likelihood of voucher program participation in Milwaukee. (GreatSchools is an online nonprofit that provides educational information and reviews for private, public, and charter schools.) Ironically, while regulators hope to prevent disadvantaged families from choosing bad schools, voucher program regulations appear to limit the quality of educational options available to low-income families in both Milwaukee and Ohio.
Introduction
“To act on the belief that we possess the knowledge and the power which enable us to shape the processes of society entirely to our liking, knowledge which in fact we do not possess, is likely to make us do much harm.”
— F. A. Hayek, “The Pretence of Knowledge”
Not all school choice programs are created equal. Policy design differs greatly across states. Because voucher-using families use public education dollars that would have otherwise gone to government schools, taxpayers and government officials are often highly concerned about the quality of private schools these families choose for their children. Government regulations are largely the result of these concerns.
Most regulators of private school choice programs have good intentions. They want children to get the education they need to be successful in the long run. Voucher program regulations can be thought of as attempts by regulators to prevent families that qualify for voucher funding from making poor educational decisions for their children. These regulations can also be efforts to push private schools to operate more effectively and equitably. Either way, it is pretty clear that the experts want what they think is best for kids.
Some of these regulations include requirements that teachers and administrators have bachelor’s degrees or teaching licenses, mandates that all students take the state standardized tests, and requirements that private schools admit students at random. As with many other uses of government force, these types of voucher program regulations may come with some unintended consequences.
Increasing the costs for private schools to participate in voucher programs may decrease the likelihood that private-school leaders decide to participate in the programs. Put differently, higher regulatory costs lead to fewer options for the students who need them the most. And we shouldn’t expect that raising program entry costs will equally deter private schools from participating in voucher programs, regardless of quality. In theory, lower-quality private schools may be less likely to turn down the voucher offer, regardless of the strings attached, since they are the most desperate for cash. On the other hand, highly specialized private schools that are already working well for their students may be less likely to accept government regulations that could change their successful educational models. In other words, voucher regulations could inadvertently reduce the average quality level of private schools that agree to participate in choice programs.
We empirically examine this hypothesis using school-level data from two of the most highly regulated voucher programs in the United States: the Milwaukee Parental Choice Program (MPCP) and the Ohio Educational Choice Scholarship Program (EdChoice). Using tuition, enrollment, and customer review scores as proxies for school quality, we find strong evidence suggesting that lower-quality private schools are more likely to participate in voucher programs in both locations. This result is a big problem if our aim is to provide high-quality educational options for children who are currently in government schools that are failing them. Maybe instead of trying so hard to prevent low-income families from making the wrong decisions, regulators ought to realize that their interference may exacerbate the very problems they wish to solve.
Theory
When a school voucher program is enacted in a given location, each private-school leader in the area must make a participation decision. The decision is based on the expected benefits and costs of program participation. The major benefit of participating in a school voucher program is, of course, the voucher revenue. Because private schools must compete with schools that are “free” — traditional public schools and public charter schools — some private schools may have a difficult time staying in business. Voucher funding makes private schooling more affordable, so private schools participating in voucher programs will have less difficulty filling empty seats and remaining financially stable, all else being equal.
On the other side of the equation is the bureaucratic red tape. Whenever private schools accept voucher funding, the government is given an avenue to exert additional control over those schools’ operations. For example, to participate in the MPCP, private schools must allow students to opt out of religious programs, submit annual financial audits, be accredited by the state, admit students on a random basis, take the voucher amount as full payment, require all teachers and administrators to hold a teaching license or a bachelor’s degree, and require all their students to take state standardized tests.1 If a given private school expects that additional costs will exceed additional benefits, it will not participate in the voucher program.
We expect that lower-quality schools — those schools likely to be more strapped for revenue — will have stronger incentives to accept voucher program regulations. On the other hand, we expect that high-quality private schools — as measured by tuition, enrollment, and customer reviews — will be more likely to turn down the voucher offer, especially if they already have an educational model that is working for their customers and do not need additional revenue to remain financially sound.
Literature Review
The evidence linking private school choice programs to standardized test scores is abundant. The preponderance of the most rigorous evidence suggests that private school choice programs improve test scores for children in the United States and abroad. A meta-analytic review of 19 experimental evaluations of voucher programs around the globe finds small improvements in math and reading test scores.2 These evaluations employ random assignment, considered to be the “gold standard” of empirical testing because it is intended to isolate the effects of the variable of interest from the effects of other factors. In other words, random-assignment evaluations allow us to confidently conclude that observed differences in student outcomes are the result of the types of schools the students attend. A majority of the 17 evaluations of voucher programs in the United States found statistically significant positive effects on test scores for some or all students.3 Only two of the studies — one in Louisiana and one in Washington, D.C. — found negative effects on student test scores.4
What led to the negative results in D.C. and Louisiana? Authors of the Louisiana study theorize that the high participation rates of low-quality private schools could explain the results.5 The schools that were most desperate for funding — the ones facing declining enrollment — were more likely to participate in the program and accept its heavy package of regulations.
Yujie Sude, Corey A. DeAngelis, and Patrick J. Wolf found evidence supporting this idea in the Louisiana program.6 Specifically, the authors found that a $1,000 increase in tuition was associated with a 3.5 percentage-point reduction in the likelihood of participating in the Louisiana Scholarship Program.7 Of course, tuition is not a perfect measure of school quality. However, tuition may be the best measure of quality available because school quality is subjective; tuition represents the price that customers are willing to pay for each given school’s educational product, and price, as in other industries, should at least be positively correlated with quality. Sude, DeAngelis, and Wolf also found that a one-point increase in review scores from the website GreatSchools was associated with around a 12 percentage-point reduction in the likelihood of participation in the Louisiana voucher program; however, the difference was not statistically significant.8 Recent empirical evidence also suggests that burdensome voucher regulations led to homogenization of the supply of private schools in Louisiana and other states.9
Only a third of private schools elected to participate in the highly regulated voucher program in Louisiana, while private-school participation in less heavily regulated programs tends to be more than double that proportion.10 These patterns likely have to do with high regulatory costs. Indeed, Brian Kisida, Patrick J. Wolf, and Evan Rhinesmith found that 100 percent of leaders of private schools participating in the Louisiana program stated that future regulations were a concern in general, and 64 percent reported that program regulations were a “major concern.”11 David Stuit and Sy Doan found that private schools are less likely to participate in voucher programs that have heavier packages of regulations.12
We follow the methodology employed by Sude, DeAngelis, and Wolf to examine the types of schools that choose to participate in voucher programs in Ohio and Milwaukee.13 We expect to find similar results, suggesting that lower-quality schools are more likely to participate in school choice programs in those two locations.
The Programs
Milwaukee Parental Choice Program
The MPCP, launched in 1990, is considered the nation’s first modern-day private school choice program.14 Children are eligible for the program if their family’s income does not exceed 300 percent of the federal poverty level ($73,800 for a family of four in 2017–2018.) Milwaukee has 126 schools participating in the voucher program, serving 28,702 students. Indeed, around 63 percent of the eligible children in Milwaukee participate in the MPCP.15 The MPCP is the largest of the four private school choice programs in Wisconsin, and the average voucher funding amount is $7,503 per student each year. The other three programs are the Racine Parental Choice Program, the Wisconsin Parental Choice Program, and the Special Needs Scholarship Program. Our analysis focuses on the MPCP because it has the highest participation levels for both schools and students. Indeed, the MPCP has almost 10 times more participating students than the Racine Parental Choice Program, which is the second-largest voucher system in the state.
Schools that participate in the MPCP are required to abide by many rules and regulations. Participating private schools must administer state standardized tests, undergo annual financial audits, require that each administrator and teacher have either a teaching license or a bachelor’s degree, require all administrators to go through financial training, admit students on a random basis, take the voucher amount as payment-in-full, and allow their students to opt out of religious activities. Participating schools are also graded by the Wisconsin Department of Public Instruction, and the results are published on its website every year.
Ohio Educational Choice Scholarship Program
Ohio’s EdChoice was enacted in 2005 and launched in 2006. It has 482 participating schools serving 22,846 students, and the average voucher value is $4,705. There are four other voucher programs in the state: the Cleveland Scholarship Program, the Autism Scholarship Program, the Income-Based Scholarship Program, and the Jon Peterson Special Needs Scholarship Program. We examine the EdChoice program because it is the largest in the state of Ohio in terms of participating schools and students. In addition, the regulatory burden for participation in the EdChoice program is higher than for participation in the other four programs in the state. In the second-largest voucher program in the state, the Cleveland Scholarship Program, private schools only need to administer state tests, meet state standards, and comply with nondiscriminatory codes.
Private schools participating in EdChoice are bound by extensive rules and regulations. The program targets kids in “low-performing” public schools and participating private schools must accept the voucher funding as full payment for students from families with incomes at or below 200 percent of the federal poverty level. Participating private schools are required to administer state standardized tests to voucher students and the aggregate results are publicized on Ohio’s Department of Education website. If more than 65 percent of a participating private school’s student body uses voucher funding, the school is required to administer state standardized tests to all of its students.16 However, nonvoucher families may opt out of the tests.
As shown in Table 1, the MPCP is more heavily regulated overall than the EdChoice voucher program. The Milwaukee voucher program requires private schools to use random-based admissions, mandates that students are allowed to opt out of religious activities, prohibits parental copayment for all students, and places more restrictive requirements on teachers and administrators than the Ohio EdChoice program. Stuit and Doan ranked both of these voucher programs in the top three in the United States for highest regulatory burdens, but they also concluded that the MPCP was more heavily regulated than the EdChoice program.17 Does this mean that the MPCP is more likely to deter high-quality schools from participating than the EdChoice program?
Table 1: Regulatory burdens, Milwaukee Parental Choice Program and Ohio Educational Choice Scholarship Program
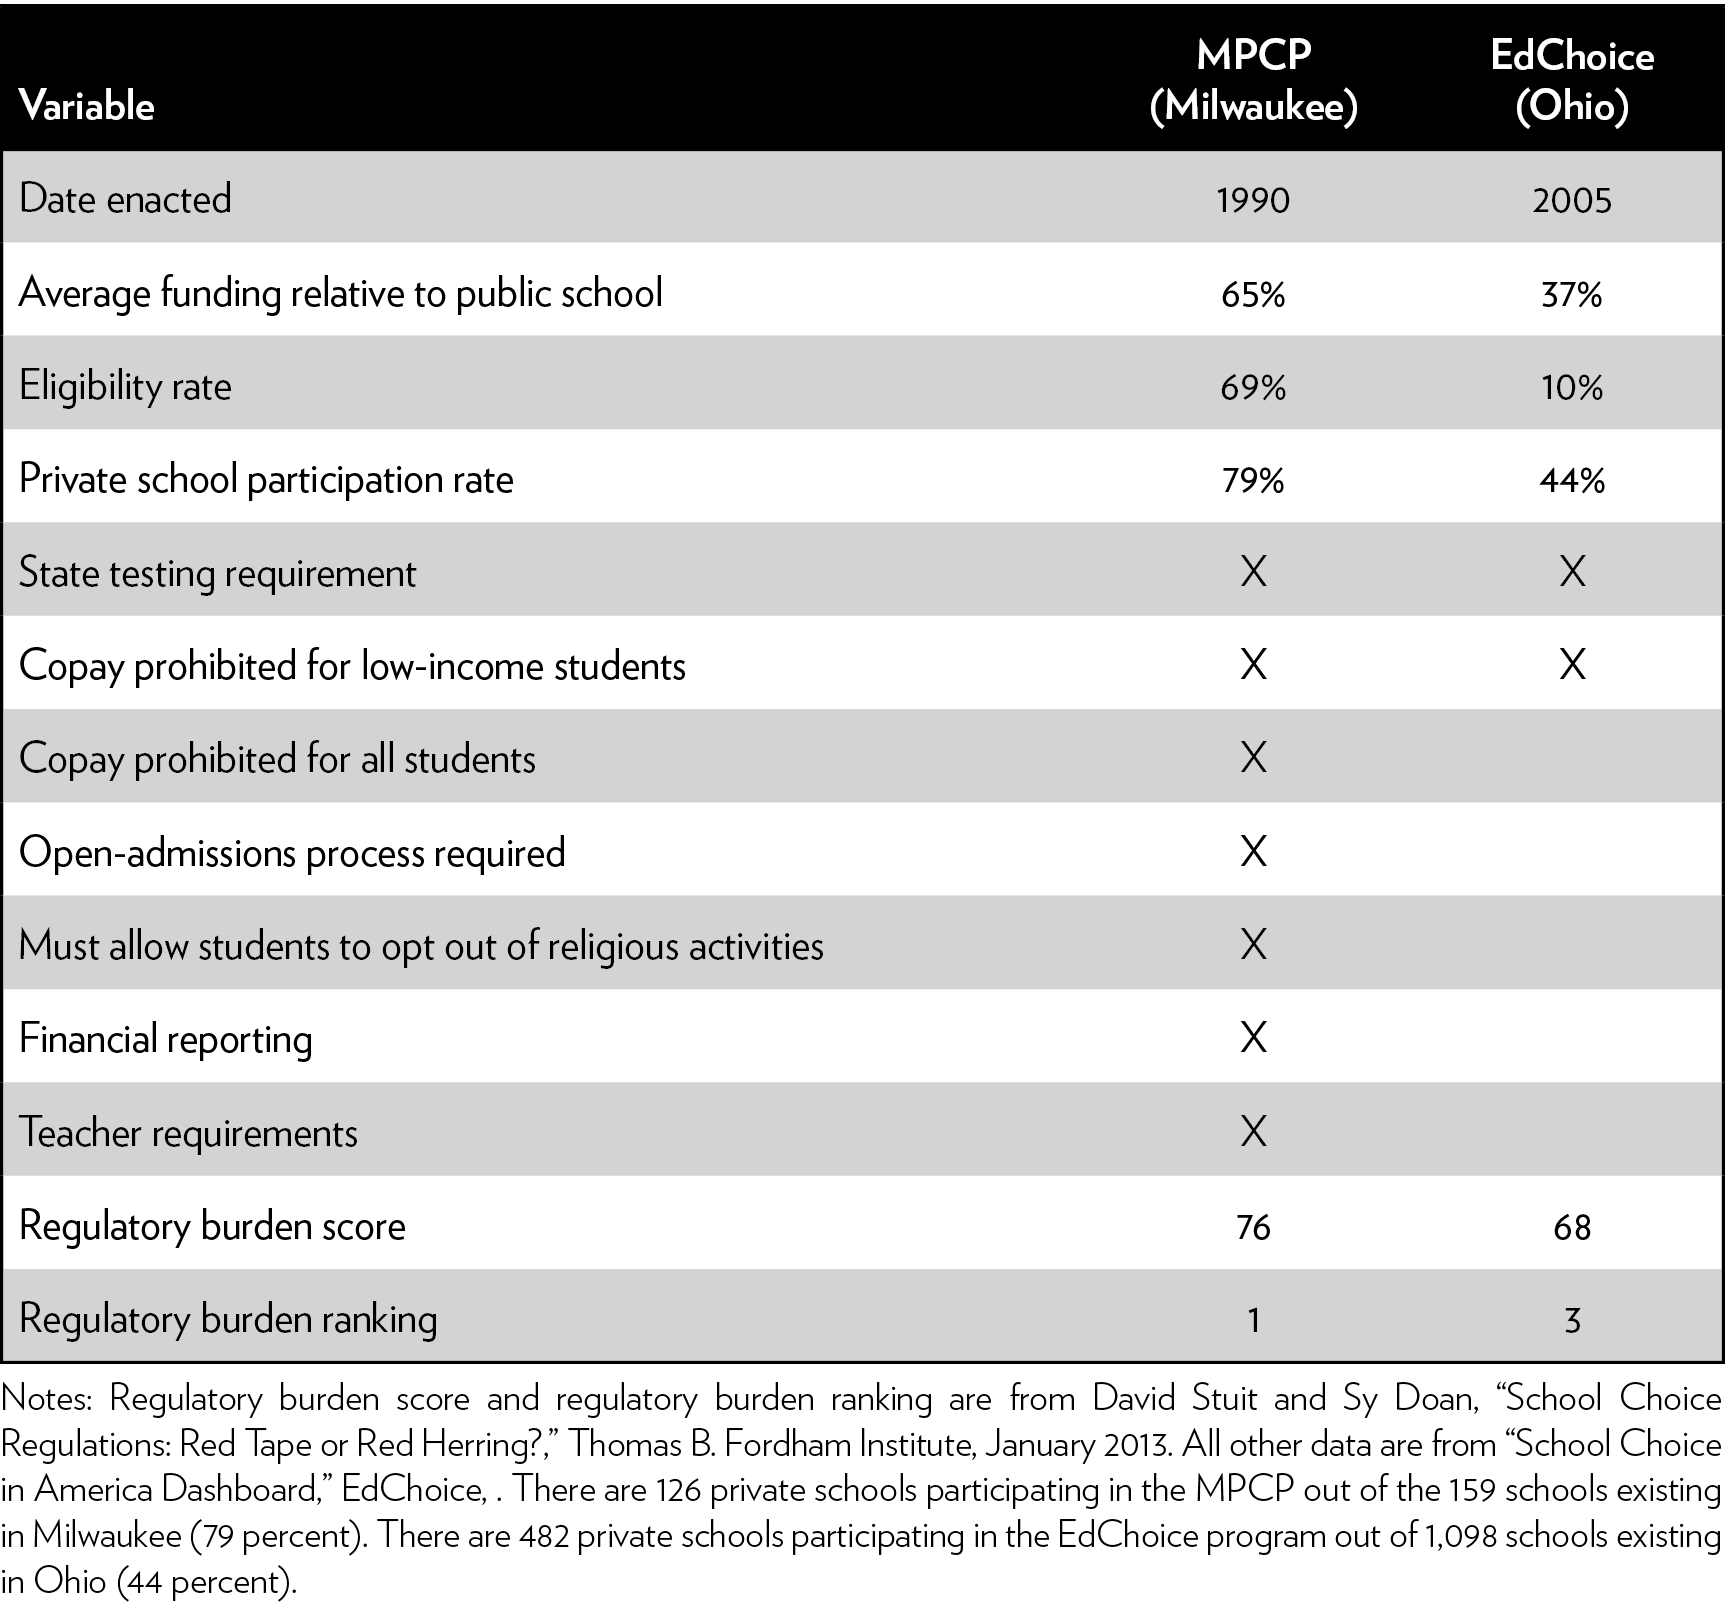
Not necessarily. Of course, program regulation is only one side of the participation decisionmaking model. The other side of the equation — voucher funding and the eligible student pool — provides more benefits to the MPCP participants than those opting into the EdChoice program. Specifically, only 10 percent of the students in Ohio are eligible for the EdChoice voucher funding, while 69 percent of the students in Milwaukee are eligible for MPCP funding. Similarly, the EdChoice voucher amount is only 37 percent of the public school per pupil funding level in Ohio, while the MPCP voucher amount is 65 percent of the public school per pupil funding level in Milwaukee. Put differently, the Milwaukee voucher program provides participating private schools with a larger share of the education market than the EdChoice program.
Because the MPCP offers more potential financial benefits to private schools, while the EdChoice program allows for more private school autonomy, it is unclear where we will detect the strongest negative relationship between school quality and participation. However, as Table 1 shows, only 44 percent of Ohio private schools participate in the EdChoice program, while 79 percent of Milwaukee’s private schools participate in the MPCP, indicating that the overall voucher offer is more enticing in Milwaukee than in Ohio. This divergence in private school participation rates suggests that lower-quality schools should be more likely to participate in Ohio than in Milwaukee.
Data
Schools participating in the MPCP were identified through Wisconsin’s Department of Public Instruction website.18 The department also provided enrollment numbers and type of school for participating schools in the program for the 2017–2018 school year.19 We gathered tuition data from individual school websites for participating and nonparticipating schools. If schools did not have their tuition data available online, we called school leaders to obtain the information. Because the department did not provide enrollment numbers for nonparticipating schools, we used the U.S. Department of Education’s National Center for Education Statistics (NCES) website to gather their enrollment numbers.20 The NCES only provided enrollment numbers for the year 2015–2016, the most recent year of data available. There are 126 schools participating in the MPCP, and we found 50 schools in the city of Milwaukee that were not participating in the program. Our analytic sample — with complete data for tuition, enrollment, and school type — for the MPCP analyses is 126 schools. Because there are 159 open private schools in Milwaukee, the analytic sample represents 79 percent of all schools in the city.21
For Ohio’s EdChoice program, we found enrollment numbers on the Ohio’s Department of Education website for both participating and nonparticipating schools.22 If the website did not have enrollment information for a given school, we used the NCES database. The Ohio website provided tuition levels for participating private schools. We found tuition data for nonparticipating schools using institutions’ websites. According to data from NCES and the Ohio Department of Education, there are more than 500 private schools in the state that do not participate in the EdChoice program. At the same time, according to NCES, there are 278 Amish schools in the state of Ohio. Because these schools generally do not have websites or phone numbers needed to find relevant information, we removed them from our analysis. We found 482 participating private schools and 229 nonparticipating private schools in Ohio. Our analytic sample — with complete data for tuition, enrollment, and school type — for the Ohio EdChoice analysis is 549 schools. Because there are 1,098 open private schools in Ohio, the analytic sample represents 50 percent of all schools in the state.23
Because private schools may charge different tuitions for different grades, we calculated the average tuition level for each school. In addition, many Christian schools provide a discount to members of the parish. Because the Ohio Department of Education did not account for these types of discounts in its tuition data, we used tuition levels for nonmembers for both the participating and nonparticipating schools.24 For the MPCP, we averaged the tuition levels for members and nonmembers for both participating and nonparticipating schools. We did not include daycare programs or other prekindergarten institutions in this study. Private school customer reviews were found through GreatSchools, an online nonprofit that provides educational information and reviews for private, public, and charter schools.25 We also used each private school’s average Google review score as a proxy for quality.
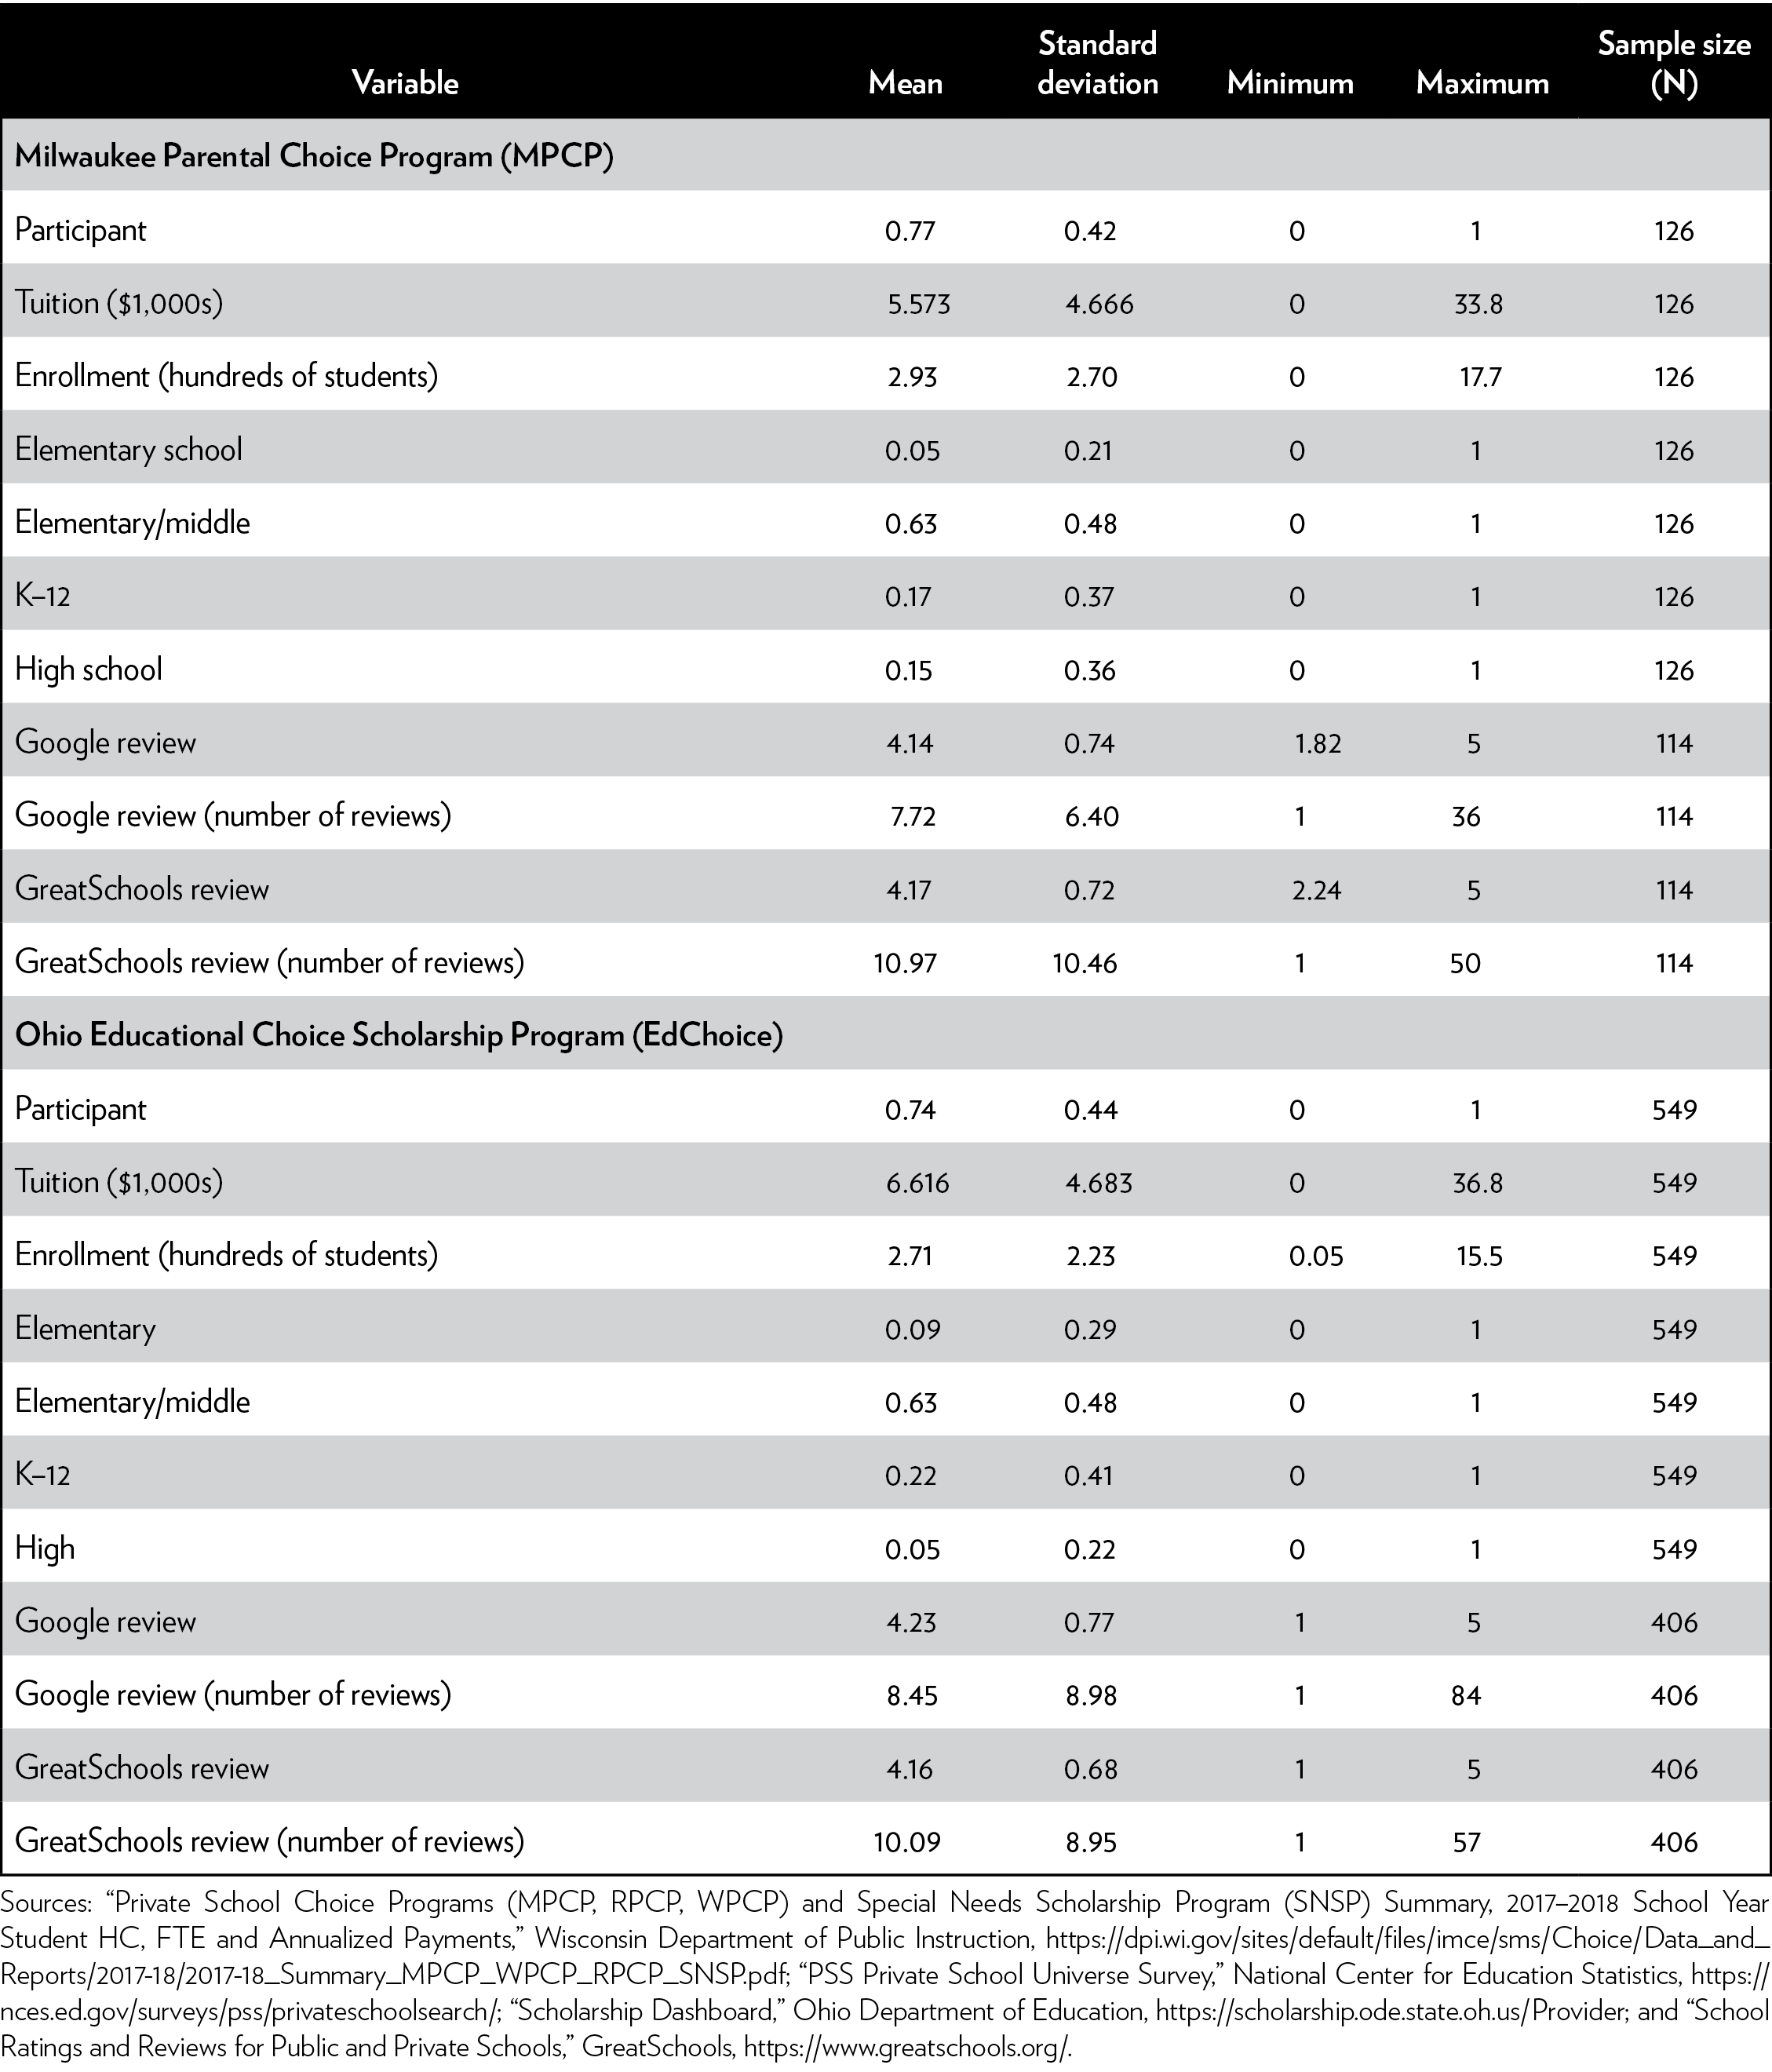
Descriptive statistics of school-level data used for all analyses can be found in Table 2. The composition of schools in Milwaukee and Ohio are similar on observable characteristics. GreatSchools review scores are nearly identical across locations: on the five-point scale, the average private school in our sample has a score of 4.17 points in Milwaukee and 4.16 points in Ohio. The average private school Google review score is 4.14 points in Milwaukee and 4.23 points in Ohio. Tuition levels are $1,043 higher per student in Ohio, while total student enrollment is 22 students higher per private school in Milwaukee.
Table 2: Descriptive statistics by program
Methods
We employ a probit regression approach of the form:
Prob (Participanti2016) = β0 + β1 Tuitioni2016 + β2Enrollment i2016 + β3Xi2016 + εit
where the binary dependent variable, Participant, takes on the value of 1 if a given private school i participates in the location’s voucher program in the 2016–2017 school year and takes on the value of 0 otherwise. The two independent variables of interest are Tuition and Enrollment. The first, Tuition, is the reported tuition level (in thousands of U.S. dollars) for private school i in the 2016–2017 school year. The second, Enrollment, is the total number of students attending private school i in the 2016–2017 school year. From an economist’s perspective, tuition and enrollment are proxies for price and quantity demanded, respectively. Of course, these are not perfect measures of school quality, but they should at least be positively correlated with school quality. Because all families’ individual choices regarding where to educate their children are reflected in schools’ tuitions and enrollments, these are the best measures we have available to gauge quality.26 Because the lower-quality schools are more likely to be desperate for voucher funding, we expect β₁ and β₂ to be negative, indicating that schools with higher tuition and enrollments are less likely to participate. We control for vector X, which includes indicator variables for whether the school is classified as elementary, elementary/middle, high, or K–12.
In an alternative model, we use Google and GreatSchools review scores, ranging from 1 to 5, as measures of quality for the subset of private schools that have review information available.27 Because schools with fewer ratings could be largely influenced by outliers, and because schools with a larger number of ratings might actively nudge families to post positive scores, this model also controls for the number of ratings recorded for each type of review. Of course, customer review measures still have limitations: these scores are based on customer’s subjective perceptions of quality; reviews can be completed by noncustomers; and not all customers complete reviews. However, these limitations should not bias our results because they apply to both participating and nonparticipating private schools. In addition to probit regression, we employ logistic regression and linear probability models to check the robustness of our results. Epsilon (ε) is the random-error term.
Results
Milwaukee Parental Choice Program
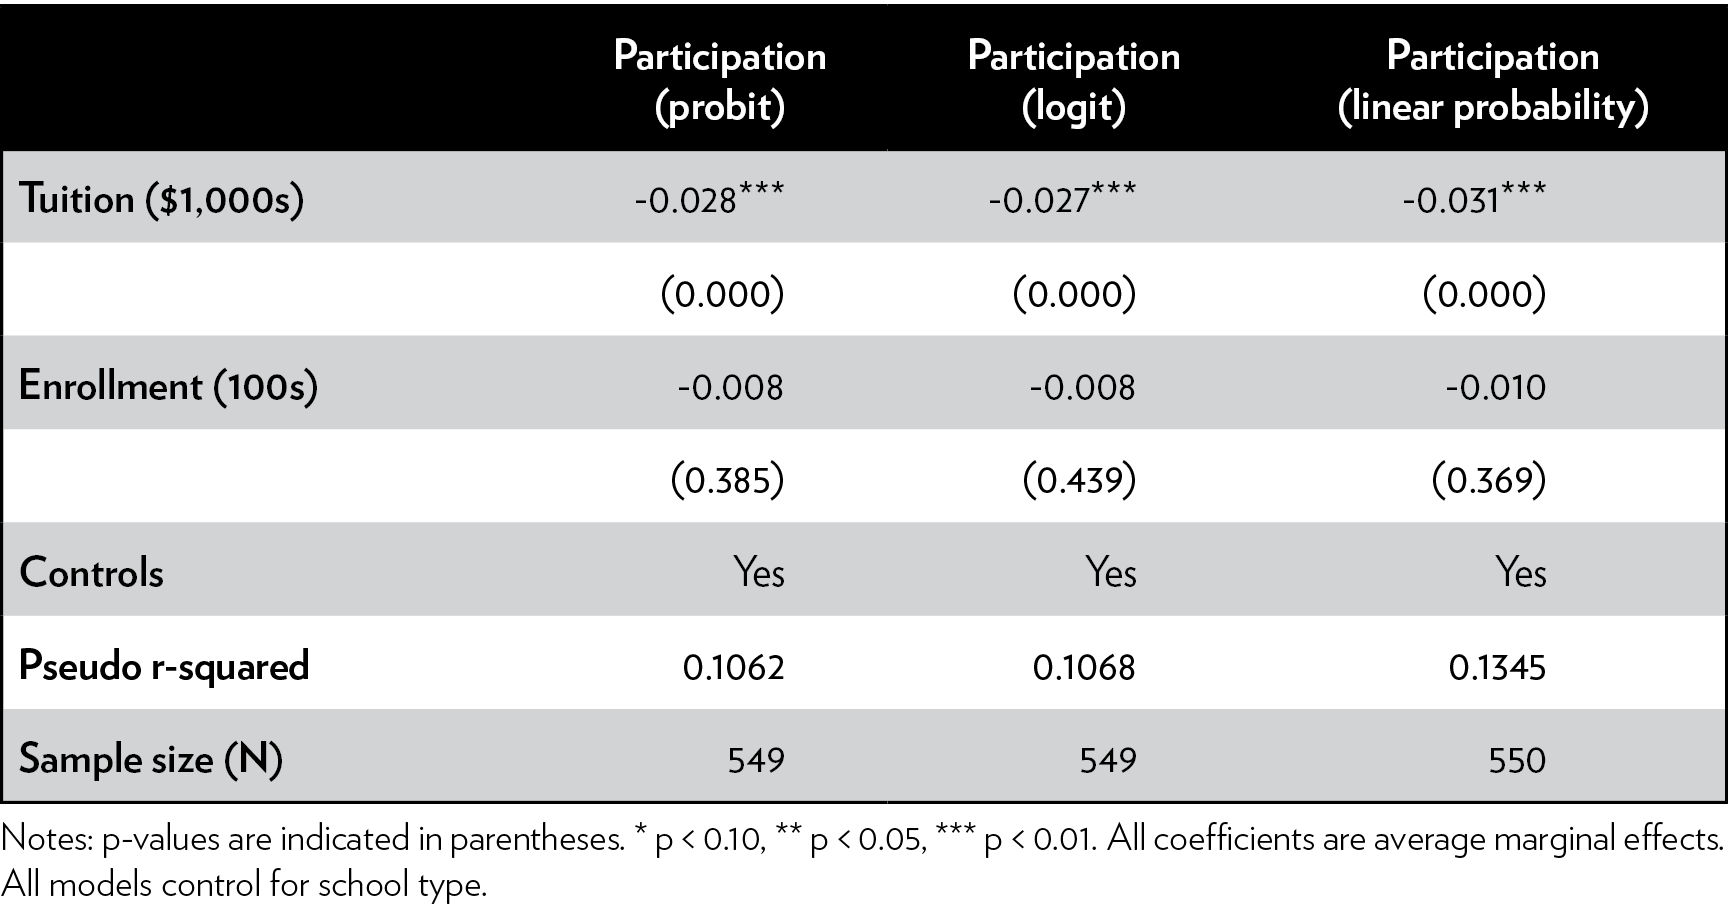
As shown in Table 3, schools with higher tuition levels are significantly less likely to participate in the MPCP. Our preferred model illustrates that a $1,000 increase in private school tuition is associated with a 2.3 percentage-point (3 percent) lower likelihood of participation. Put differently, a one-standard-deviation increase in private school tuition ($4,666) is associated with a 10.7 percentage-point (13.9 percent) reduction in the likelihood of participation in the MPCP.
Table 3: School quality and participation, Milwaukee Parental Choice Program
(tuition and enrollment)
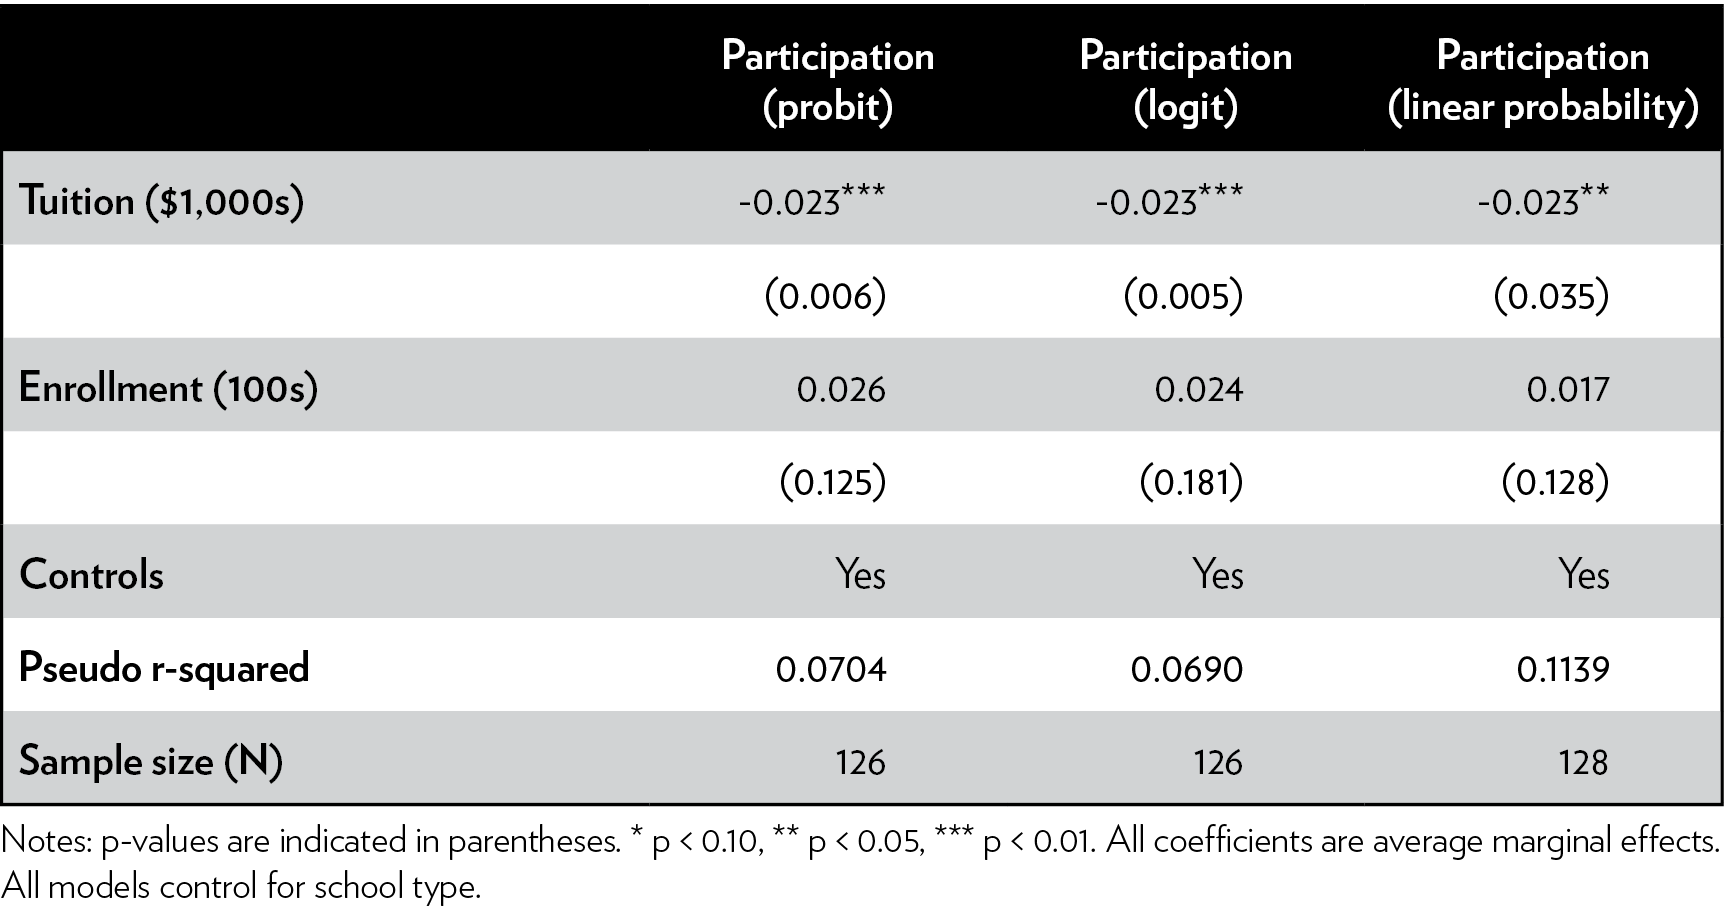
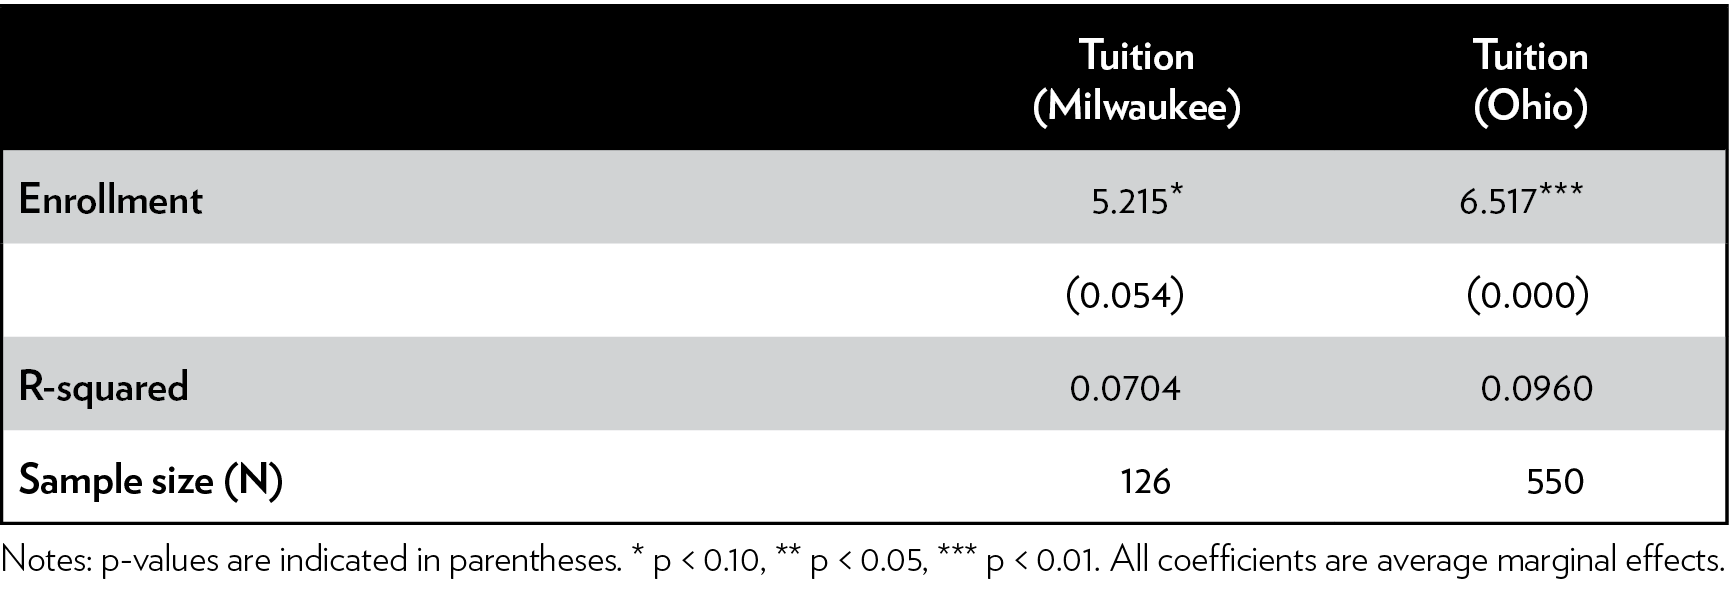
We do not find any evidence that student enrollment is associated with the program participation decision. This may be because the price (tuition) of the school is a function of its quantity demanded (enrollment). Indeed, as shown in Table 4, a 100-student increase in enrollment is associated with a tuition that is about $520 higher, on average.
Table 4: Relationship between tuition and enrollment
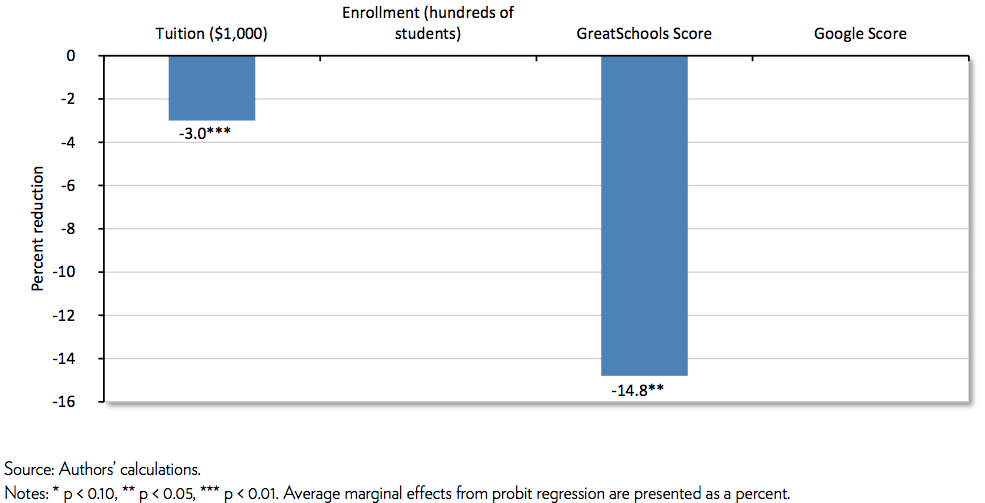
As shown in Table 5, we find additional evidence using customer review scores that lower-quality schools are more likely to participate in the MPCP. In particular, we find that a one-point increase in a GreatSchools review score is associated with an 11.4 percentage-point (14.8 percent) reduction in the likelihood of program participation. We do not find any evidence to suggest that Google review ratings are associated with participation in the MPCP. This may be explained by the fact that Google reviews are more accessible to noncustomers. A higher level of public accessibility could lead to additional measurement error and therefore statistically insignificant results. Statistically significant results can also be found in Figure 1.
Table 5: School quality and participation, Milwaukee Parental Choice Program
(online reviews)
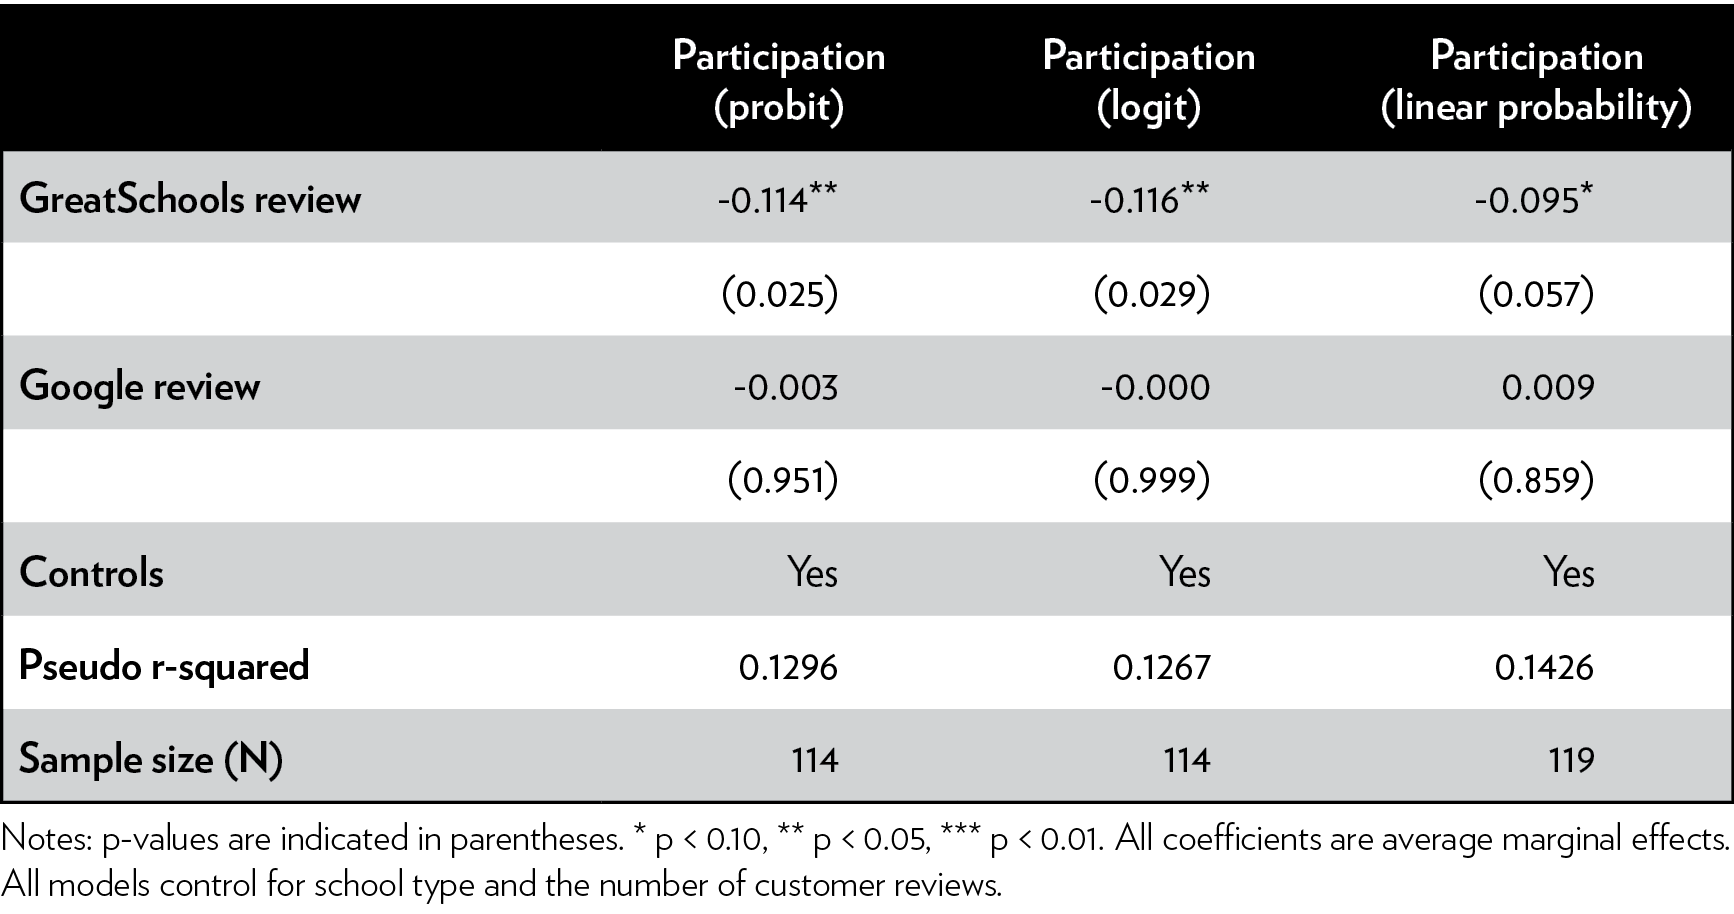
Figure 1: Statistically significant effects of school quality on participation,
Milwaukee Parental Choice Program
Ohio Educational Choice Scholarship Program
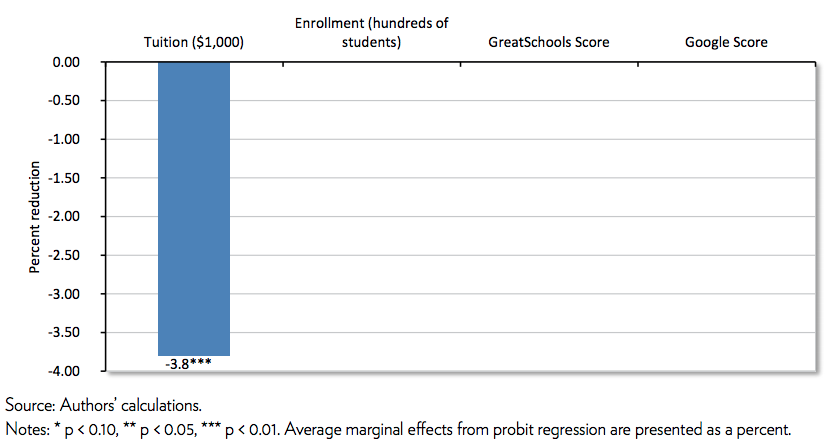
The results for EdChoice are similar to the results from Milwaukee. Table 6 shows that schools with higher tuition are significantly less likely to participate in the Ohio program. Our preferred model illustrates that a $1,000 increase in private school tuition is associated with a 2.8 percentage-point (3.8 percent) lower likelihood of participating in the Ohio voucher program. Put differently, a one-standard-deviation increase in private school tuition ($4,683) is associated with a 13.1 percentage-point (17.8 percent) reduction in the likelihood of participation in the Ohio program. Similar to Milwaukee, we do not find any evidence that student enrollment is associated with the program participation decision in Ohio.
Table 6: School quality and participation, Ohio Educational Choice Scholarship Program (tuition and enrollment)
As shown in Table 7, we do not find any statistically significant evidence that customer review scores are associated with voucher program participation. As shown in the preferred specification, a one-point increase in a Google review score is associated with a 4.5 percentage-point (6.1 percent) lower likelihood of program participation; however, this result is not statistically significant at the p < 0.10 level. Statistically significant results can be found in Figure 2.
Table 7: School quality and participation, Ohio Educational Choice Scholarship Program (online reviews)
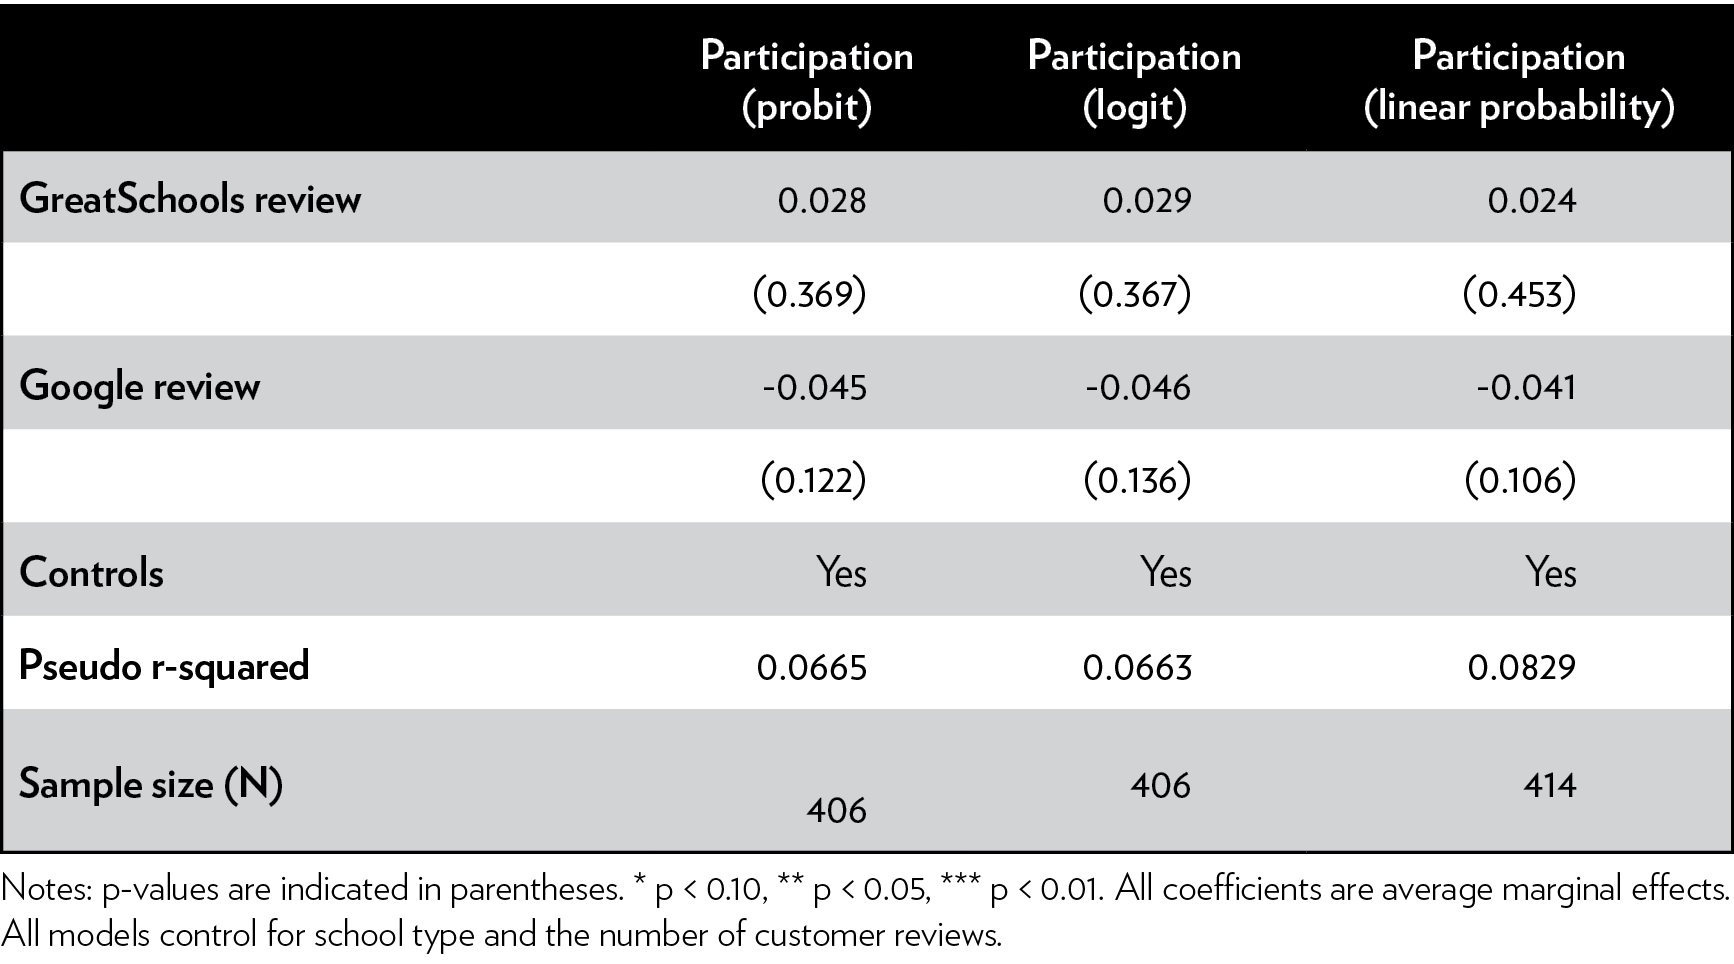
Figure 2: Statistically significant effects of school quality on participation,
Ohio Educational Choice Scholarship Program
Limitations
These results can only be interpreted as correlational because of the descriptive nature of the analysis. This study tells us that lower-quality schools — as measured by tuition and customer reviews — are more likely to participate in voucher programs in Milwaukee and Ohio, but we cannot conclude why this is the case with certainty. However, we believe our explanation — that lower-quality schools might be more desperate for financial resources and therefore may be more willing to put up with program regulations — is the strongest theory currently available.
The dependent variables are the most important limitations to the study. We use tuition, enrollment, and customer reviews as proxies for school quality. These are not perfect measures, but they should be positively correlated with school quality. We believe that they are the best measures of school quality available because school quality is highly subjective; tuition and enrollment are proxies for price and quantity demanded, that is, they are measures that capture the willingness and abilities of customers to pay for given products; and customer review scores are usually good indicators of quality in other industries — a restaurant with a four-star average rating is generally better than a restaurant with a two-star average rating. In addition, our statistically significant results for tuition and customer reviews point in the same expected direction, suggesting that lower-quality schools are more likely to participate in voucher programs. While these results mirror the work of Sude, DeAngelis, and Wolf, more research examining other locations and using alternative measures of school quality would be especially welcome.
Conclusion and Policy Recommendations
Similar to the previous evaluation by Sude, DeAngelis, and Wolf, in which they find that lower-quality private schools are more likely to participate in voucher programs in D.C., Indiana, and Louisiana, we find significant evidence to suggest that regulations deter high-quality private schools from participating in voucher programs in Ohio and Milwaukee. Specifically, a $1,000 increase in tuition is associated with a 3 percent lower likelihood of participation in the Milwaukee voucher program and a 3.8 percent lower likelihood of participation in Ohio. We also find that a one-point increase in a GreatSchools review score is associated with a 14.8 percent reduction in the likelihood of participation in the Milwaukee Parental Choice Program. Ironically, while regulators hope to prevent disadvantaged families from choosing bad schools, voucher program regulations appear to have limited the quality of educational options available to low-income families in Milwaukee and Ohio.
It would be wise for decisionmakers to reduce the costs of private school participation by deregulating these two programs. Both programs require all participating private schools to administer the state standardized assessment and mandate that private schools accept the voucher funding as full payment, even if the amount is well below tuition levels. Officials in Milwaukee should consider allowing private schools to control their own admissions standards and should not mandate that all teachers and administrators have teaching licenses or bachelor’s degrees. Instead of trying to control the decisions that low-income families make regarding their children’s schools, we ought to empower these families with the freedom to make educational decisions for their own kids. This additional freedom would lead to more options for the families that need them the most and a more educated society for all of us.
Notes
1. EdChoice, “Wisconsin—Milwaukee Parental Choice Program,” https://www.edchoice.org/school-choice/programs/wisconsin-milwaukee-parental-choice-program/.
2. M. Danish Shakeel, Kaitlin P. Anderson, and Patrick J. Wolf, “The Participant Effects of Private School Vouchers Across the Globe: A Meta-Analytic and Systematic Review,” working paper no. 2016-07, Department of Education Reform, University of Arkansas, May 2016.
3. Kaitlin P. Anderson and Patrick J. Wolf, “Evaluating School Vouchers: Evidence from a Within-Study Comparison,” working paper no. 2017-10, Department of Education Reform, University of Arkansas, April 2017; John Barnard, Constantine E. Frangakis, Jennifer L. Hill, et al., “Principal Stratification Approach to Broken Randomized Experiments: A Case Study of School Choice Vouchers in New York City,” Journal of the American Statistical Association 98, no. 462 (2003): 299–323; Marianne Bitler, Thurston Domina, Emily Penner, et al., “Distributional Analysis in Educational Evaluation: A Case Study from the New York City Voucher Program,” Journal of Research on Educational Effectiveness 8, no. 3 (2015): 419–50; Joshua M. Cowen, “School Choice as a Latent Variable: Estimating the ‘Compiler Average Causal Effect’ of Vouchers in Charlotte,” Policy Studies Journal 36, no. 2 (2008): 301–15; Jay P. Greene, Paul E. Peterson, and Jiangtao Du, “Effectiveness of School Choice: The Milwaukee Experiment,” Education and Urban Society 31, no. 2 (1999): 190–213; Jay P. Greene, “The Effect of School Choice: An Evaluation of the Charlotte Children’s Scholarship Fund Program,” Manhattan Institute for Policy Research, Civic Report no. 12, August 2000, https://www.manhattan-institute.org/pdf/cr_12.pdf; William G. Howell, Patrick J. Wolf, and David E. Campbell, “School Vouchers and Academic Performance: Results from Three Randomized Field Trials,” Journal of Policy Analysis and Management 21, no. 2 (2002): 191–217; Hui Jin, John Barnard, and Donald B. Rubin, “A Modified General Location Model for Noncompliance with Missing Data: Revisiting the New York City School Choice Scholarship Program Using Principal Stratification,” Journal of Educational and Behavioral Statistics 35, no. 2 (2010): 154–73; and Cecilia E. Rouse, “Private School Vouchers and Student Achievement: An Evaluation of the Milwaukee Parental Choice Program,” Quarterly Journal of Economics 113, no. 2 (1998): 553–602.
4. Atila Abdulkadiroğlu, Parag A. Pathak, and Christopher R. Walters, “Free to Choose: Can School Choice Reduce Student Achievement?,” American Economic Journal: Applied Economics 10, no. 1 (2018): 175–206; and Mark Dynarski, Ning Rui, Ann Webber, et al., “Evaluation of the DC Opportunity Program: Impacts Two Years after Students Applied,” National Center for Education Evaluation and Regional Assistance (Washington: U.S. Department of Education, 2018).
5. Abdulkadiroğlu, Pathak, and Walters, “Free to Choose,” pp. 175–206; Jonathan N. Mills and Patrick J. Wolf, “Vouchers in the Bayou: The Effects of the Louisiana Scholarship Program on Student Achievement after 2 Years,” Educational Evaluation and Policy Analysis 39, no. 3 (2017): 464–84; and Jonathan N. Mills and Patrick J. Wolf, “The Effects of the Louisiana Scholarship Program on Student Achievement after Three Years,” Louisiana Scholarship Program Evaluation Report no. 7, June 2017.
6. Yujie Sude, Corey A. DeAngelis, and Patrick J. Wolf, “Supplying Choice: An Analysis of School Participation Decisions in Voucher Programs in Washington, D.C., Indiana, and Louisiana,” Journal of School Choice: International Research and Reform 12, no. 1 (2018): 8–33.
7. Corey A. DeAngelis, “Unintended Impacts of Regulations on the Quality of Schooling Options,” Education Next, July 2017, http://educationnext.org/unintended-impacts-quality-control-quality-schooling-options/.
8. Sude, DeAngelis, and Wolf, “Supplying Choice,” pp. 8–33.
9. Corey A. DeAngelis and Lindsey Burke, “Does Regulation Induce Homogenisation? An Analysis of Three Voucher Programmes in the United States,” Educational Research and Evaluation 23, no. 7-8 (2017): 311–27, https://www.tandfonline.com/doi/abs/10.1080/13803611.2018.1475242; and Corey A. DeAngelis and Lindsey M. Burke, “Does Regulation Reduce Specialization? Examining the Impact of Regulations on Private Schools of Choice in Four Locations,” EdChoice, forthcoming.
10. Sude, DeAngelis, and Wolf, “Supplying Choice,” pp. 8–33.
11. Brian Kisida, Patrick J. Wolf, and Evan Rhinesmith, “Views from Private Schools: Attitudes about School Choice Programs in Three States,” American Enterprise Institute, January 2015.
12. David Stuit and Sy Doan, “School Choice Regulations: Red Tape or Red Herring?” Thomas B. Fordham Institute, January 2013.
13. Sude, DeAngelis, and Wolf, “Supplying Choice,” pp. 8–33.
14. The longest-standing private school choice programs in the United States, launched in the late 19th century, are “Town Tuitioning Programs,” located in Maine and Vermont. These two programs allow families in towns without public schools to use public education dollars to send their children to private or public schools of their choosing.
15. EdChoice, “Wisconsin–Milwaukee Parental Choice Program.”
16. EdChoice, “Ohio–Educational Choice Scholarship Program,” https://www.edchoice.org/school-choice/programs/ohio-educational-choice-scholarship-program/.
17. Stuit and Doan, “School Choice Regulations: Red Tape or Red Herring?”
18. “Private School Choice Programs: 2018–2019 Student Applications,” Wisconsin Department of Public Instruction, https://dpi.wi.gov/sms/choice-programs/student-applications.
19. “Private School Choice Programs (MPCP, RPCP, WPCP) and Special Needs Scholarship Program (SNSP) Summary, 2017–2018 School Year Student HC, FTE and Annualized Payments,” Wisconsin Department of Public Instruction, https://dpi.wi.gov/sites/default/files/imce/sms/Choice/Data_and_Reports/2017-18/2017-18_Summary_MPCP_WPCP_RPCP_SNSP.pdf.
20. “PSS Private School Universe Survey,” National Center for Education Statistics, https://nces.ed.gov/surveys/pss/private schoolsearch/.
21. “Milwaukee Private Schools,” Private School Review, https://www.privateschoolreview.com/wisconsin/milwaukee.
22. “Scholarship Dashboard,” Ohio Department of Education, https://scholarship.ode.state.oh.us/Provider. Once at the website, select “Educational Choice Scholarship.”
23. “Ohio Private Schools,” Private School Review, https://www.privateschoolreview.com/ohio.
24. Several private schools have tuition discounts for parish members, meaning that tuition levels in our data are likely higher than what the schools actually charge. However, this will not bias our overall estimates because tuition levels for both participating and nonparticipating schools are biased upward.
25. “School Ratings and Reviews for Public and Private Schools,” GreatSchools, https://www.greatschools.org/.
26. F. A. Hayek, “The Use of Knowledge in Society,” American Economic Review 35, no. 4 (1945): 519–30.
27. We have review information for 114 of the 126 schools examined in the main analysis of the MPCP (90.5 percent), and 406 of the 549 schools examined in the main analysis of the Ohio EdChoice program (74.0 percent).


This work is licensed under a Creative Commons Attribution-NonCommercial-ShareAlike 4.0 International License.