Are we running out of resources? That’s been a hotly debated question since the publication of Paul Ehrlich’s The Population Bomb in 1968. The Stanford University biologist warned that population growth would result in the exhaustion of resources and a global catastrophe. University of Maryland economist Julian Simon, in contrast, argued that humans would innovate their way out of resource shortages. He believed that people were the “ultimate resource” that would make other resources more plentiful.
In this paper, we revisit the main points of contention in the debate regarding availability of resources and their relationship with population growth. Using the latest price data for 50 foundational commodities covering energy, food, materials, and metals, we propose a new way of measuring resource availability based on four concepts.
First, the time-price of commodities allows us to measure the cost of resources in terms of human labor. We find that, in terms of global average hourly income, commodity prices fell by 64.7 percent between 1980 and 2017. Second, the price elasticity of population (PEP) allows us to measure sensitivity of resource availability to population growth. We find that the time-price of commodities declined by 0.934 percent for every 1 percent increase in the world’s population over the same time period. Third, we develop the Simon Abundance Framework, which uses the PEP values to distinguish between different degrees of resource abundance, from decreasing abundance at one end to superabundance at the other end. Considering that the time-price of commodities decreased at a faster proportional rate than population increased, we find that humanity is experiencing superabundance. Fourth, we create the Simon Abundance Index, which uses the timeprice of commodities and change in global population to estimate overall resource abundance. We find that the planet’s resources became 379.6 percent more abundant between 1980 and 2017.
On the basis of our analysis of the relationship between resource availability and population growth, we forecast that the time-price of commodities could fall by a further 29 percent over the next 37 years. Much will depend on policies and institutions that nations pursue. For the time-price of commodities to decline and resource abundance to increase, it is necessary for market incentives and the price mechanism to endure. When prices of commodities temporarily increase, people have an incentive to use resources more efficiently, increase their supply, and develop cheaper substitutes.
Introduction
Humanity, the latest estimates suggest, is roughly 300,000 years old.1 For the first 99.9 percent of our time on Earth, Homo sapiens lived a short and difficult life that ended, all too often, in violent death. We roamed the world afraid, cold, hungry, and sick. Remedies to ease our suffering were few. In the past 250 years or so, however, human fortunes dramatically improved. An accumulation of incremental technological, scientific, and ideological advances led to the Industrial Revolution, which ushered in an age of abundance.2
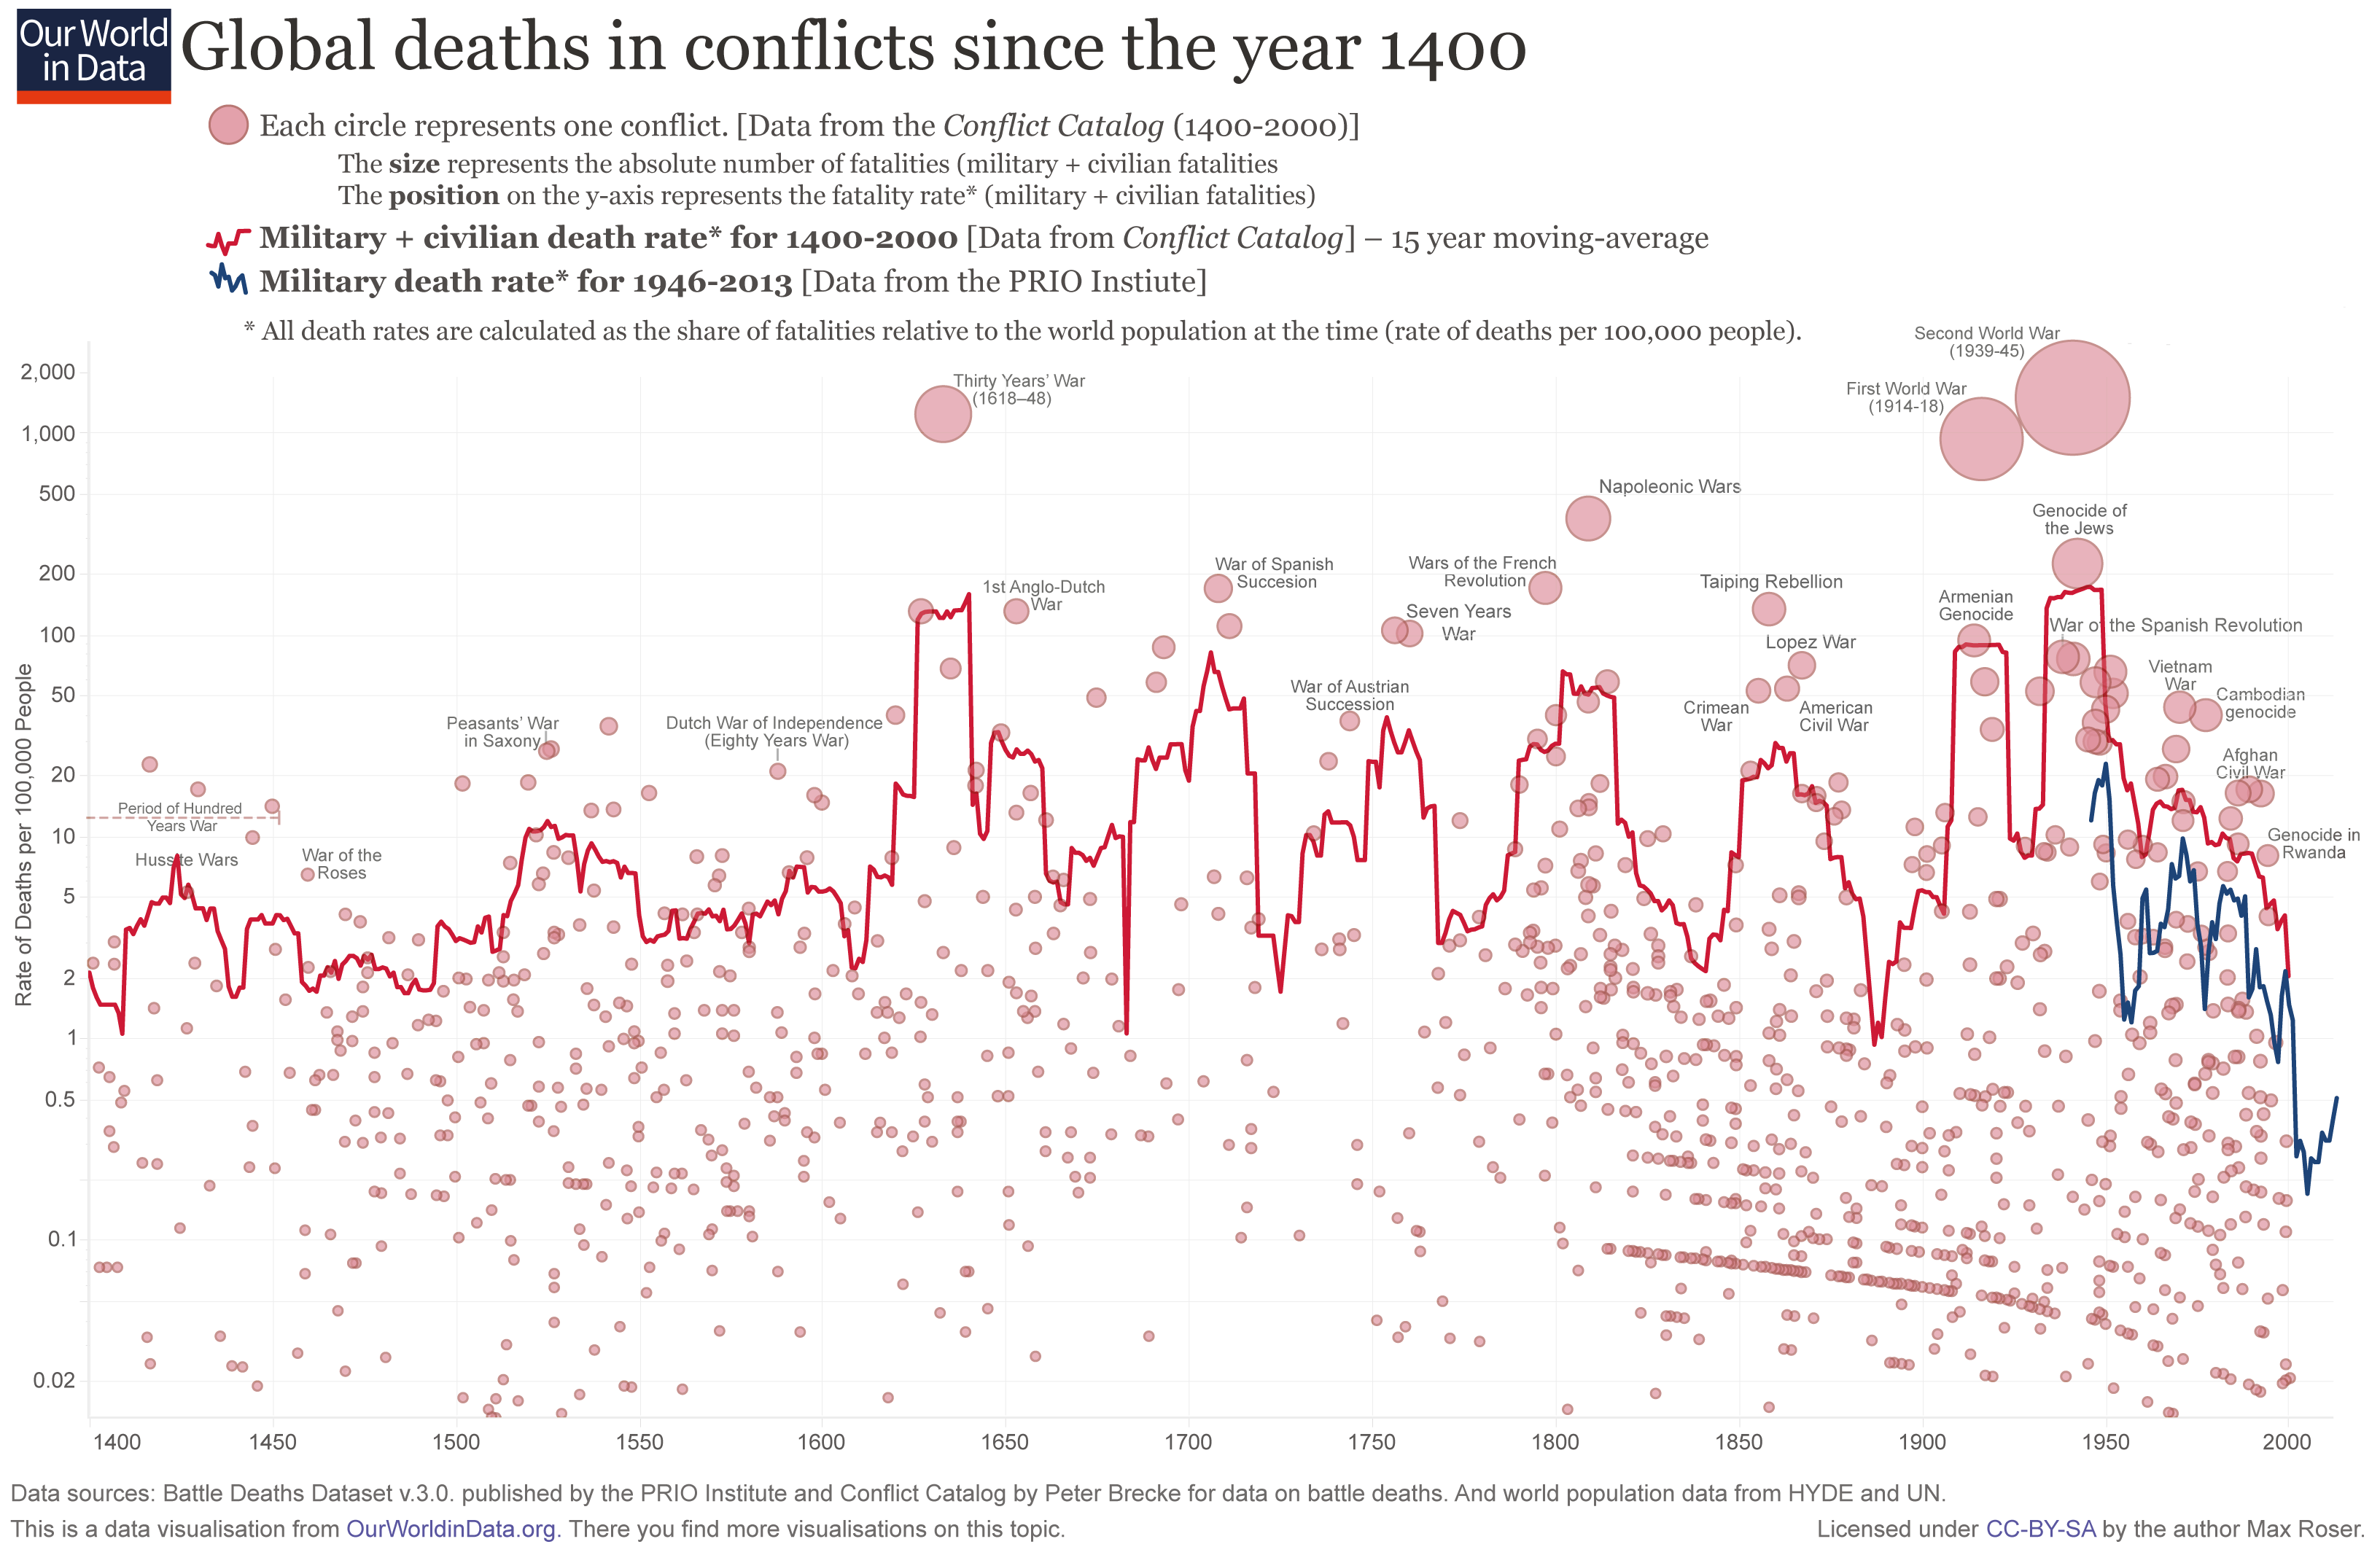
To get a sense of how far we have come, consider global life expectancy, which is a good proxy measure for health and nutrition. In 1820, people could expect to live a paltry 29 years. People today can expect to live 72 years—2.5 times longer than they used to.3 Between 1820 and 2010, average global real income per capita rose from $605 to $7,890.4 That’s an implied 12-fold increase in the standard of living. The world has also become less violent.5 In the early 1800s, the combined military and civilian death rate from conflicts was about 65 per 100,000 people. By 2000 that rate fell to about 2 per 100,000.6 Those improvements contributed to increasing the human population from 990 million in 1800 to 7.63 billion in 2018.7
Population growth and abundance seem to be connected. The Scottish philosopher Adam Smith noted that division of labor, or separation of the work process into distinct tasks, leads to faster growth. As workers “specialize,” they become more efficient at what they do. Productivity and wealth increase.8 Specialization, however, requires more workers. The population explosion and the globalization of production supplied plenty of those.9 The late University of Maryland economist Julian Simon noted that in addition to more labor, a growing population produces more ideas.10 More ideas lead to more innovations, and more innovations improve productivity.11 Finally, higher productivity translates to better standards of living.
Abundance requires the use of resources. Is that use of resources worth it? It would seem so. Most people prefer wealth to poverty and incur costs in the pursuit of a better life. Can the current state of abundance be sustained and even be improved on? We think it can. In this paper we show that population growth has not led to a shortage of resources. As Simon predicted, humanity has made resources more plentiful through greater efficiency of use, increased supply, and the development of substitutes.
Ehrlich and Simon: A Clash of Visions
Fifty years ago, Stanford University biology professor Paul R. Ehrlich published a highly influential book, The Population Bomb. The book went through a number of editions, sold millions of copies, and was translated into many languages. The early editions included the now-infamous statement:
The battle to feed all of humanity is over. In the 1970s hundreds of millions of people will starve to death in spite of any crash programs embarked upon now. At this late date nothing can prevent a substantial increase in the world death rate.12
Ehrlich believed that population growth and the concomitant rise in consumption would lead to an environmental collapse, exhaustion of natural resources, food shortages, and mass starvation. He claimed that population control—including coerced sterilization and financial penalties for excessive fecundity—and consumption limits in rich countries would be needed to prevent catastrophe.
Simon rejected Ehrlich’s thesis. In his 1981 book The Ultimate Resource, Simon argued that humans were intelligent beings, capable of innovating their way out of shortages through greater efficiency, increased supply, and the development of substitutes. He wrote:
There is no physical or economic reason why human resourcefulness and enterprise cannot forever continue to respond to impending shortages and existing problems with new expedients that, after an adjustment period, leave us better off than before the problem arose.… Adding more people will cause [short-run] problems, but at the same time there will be more people to solve these problems and leave us with the bonus of lower costs and less scarcity in the long run.… The ultimate resource is people—skilled, spirited, and hopeful people who will exert their wills and imaginations for their own benefit, and so, inevitably, for the benefit of us all.13
These were, to put it mildly, two very different visions of humanity’s future. Ehrlich’s gloomy view of humanity’s prospects, it should be noted here, was shared by other influential biologists. They included Garrett Hardin of the University of California, Santa Barbara, who developed the “tragedy of the commons” theory, and Jared Diamond of the University of California, Los Angeles, who penned such bestsellers as Guns, Germs, and Steel and Collapse.14
Their analyses of human societies, noted Lester R. Brown of the Worldwatch Institute in Washington, D.C., were influenced by the notion of “the carrying capacity of natural systems.”15 In the animal world, a sudden increase in the availability of resources, such as grass after unusually plentiful rain, leads to an animal population explosion. The population explosion then leads to the exhaustion of resources. Finally, the exhaustion of resources leads to population collapse. Economists, as Brown explained, tend to be much more sanguine about humanity’s future prospects.16 Unlike other animals, humans have developed sophisticated forms of cooperation that increase their wealth and chances of survival. Consider, for example, trade and exchange. As the British writer Matt Ridley observed:
There is strikingly little use of barter in any other animal species. There is sharing within families, and there is food-for-sex exchange in many animals including insects and apes, but there are no cases in which one animal gives an unrelated animal one thing in exchange for a different thing.17
Trade is particularly important during famines, such as those feared by Ehrlich and other biologists. A country stricken by drought, for example, can purchase food from abroad. This is not an option available to other animals.
After intellectually sparring with one another in print for most of the 1970s, Simon finally challenged Ehrlich to a wager on resource depletion. Ehrlich would choose a “basket” of raw materials that he expected would become less abundant in the coming years and choose a time period of more than a year, during which those raw materials would become more expensive. At the end of that period, the inflation-adjusted price of those materials would be calculated. If the “real” price of the basket was higher at the end of the period than at the beginning, that would indicate the materials had become more precious and Ehrlich would win the wager; if the price was lower, Simon would win. The stakes would be the ultimate price difference of the basket at the beginning and end of the time period.
Ehrlich chose copper, chromium, nickel, tin, and tungsten. The bet was agreed to on September 29, 1980, with September 29, 1990, being the payoff date. In spite of a population increase of 873 million over those 10 years, Ehrlich lost the wager. All five commodities that he had selected declined in price by an average of 57.6 percent. Ehrlich mailed Simon a check for $576.07.18
Since the conclusion of the bet, Ehrlich’s supporters have argued that Simon got lucky: had the bet taken place over a different decade, the outcome might have been different.19 The debate continues to this day.20 In 2016, Southern Methodist University economists Michael Cox and Richard Alm revisited the Simon–Ehrlich wager and found that Ehrlich’s metals were 22.4 percent cheaper in 2015 than they had been in 1980.21
In an essay titled, “Onward and Upward! Bet on Capitalism—It Works,” Cox and Alm proposed a new methodology to evaluate Simon’s thesis. “The real price of everything,” as Adam Smith pointed out, “is the toil and trouble of acquiring it.… What is bought with money … is purchased by labour.”22 The cost of human labor, Cox and Alm note, tends to increase faster than inflation. From the perspective of average hourly wages in the United States, therefore, the real price of Ehrlich’s minerals fell by 41.8 percent between 1980 and 2015. According to Cox and Alm, in “work-hour terms, Simon wins The Bet [with Ehrlich] in every year from 1980 to 2015.”23
Human Appetite for Disaster
The outcome of the Simon–Ehrlich bet and subsequent developments—instead of a global catastrophe, the world has become unambiguously more prosperous—did not diminish the world’s appetite for apocalyptic predictions. That should not come as a surprise. As Harvard University psychology professor Steven Pinker points out, humanity suffers from a negativity bias, or “vigilance for bad things around us.”24
This bias may well be an innate trait, which came about as a result of natural selection. The Environment of Evolutionary Adeptness—a name that psychologists gave to a period of tens of thousands of years during which human brains developed—was much less hospitable to human beings than is the case today. “Our modern skulls house a stone age mind,” as University of California, Santa Barbara, anthropology professor John Tooby and psychology professor Leda Cosmides put it.25 Consequently, there will always be a market for purveyors of bad news, be they doomsayers who claim that overpopulation will cause mass starvation or scaremongers who claim that we are running out of natural resources.26
Thus, Ehrlich’s message continues to resonate. In 2013, he and his wife, Anne, revisited The Population Bomb in an article titled “Can a Collapse of Global Civilization Be Avoided?” The pair warned that human civilization
is threatened with collapse by an array of environmental problems.… The human predicament is driven by overpopulation, overconsumption of natural resources … and socio-economic-political arrangements to service Homo sapiens’ aggregate consumption.27
In 2017, Ehrlich was invited to address a Vatican workshop on “Biological Extinction.” “You can’t go on growing forever on a finite planet. The biggest problem we face is the continued expansion of the human enterprise,” he said. “Perpetual growth is the creed of a cancer cell.… It’s the aggregate consumption that ruins the environment,” Ehrlich continued.28
Ehrlich was not the first thinker to worry about population growth. Confucius and his Chinese disciples wondered about the size of “optimum population,” thought that government should move people from “overpopulated to under-populated areas,” and identified food shortages as a source of population decline.29 The Greek philosopher Aristotle held that an “excessive number of inhabitants would breed poverty and social ills.” To “prevent an excessive population he mentioned child exposure and abortion.”30
Modern discourse concerning the interaction between population growth and resource depletion dates to the British cleric Thomas Malthus, whose immensely influential 1798 Essay on the Principle of Population argued that unchecked population growth would result in widespread famine.31
Nor was Ehrlich alone in generating widespread panic over population growth. Consider, for example, the Club of Rome. Established in the same year that The Population Bomb came out, the club “is an organisation of individuals who share a common concern for the future of humanity and strive to make a difference.… [Its] mission is to promote understanding of the global challenges facing humanity and to propose solutions through scientific analysis, communication and advocacy.”32
The club’s first major publication was its 1972 report The Limits to Growth. The report looked at the interplay between industrial development, population growth, malnutrition, the availability of nonrenewable resources, and the quality of the environment. It concluded,
If present growth trends in world population, industrialization, pollution, food production, and resource depletion continue unchanged, the limits to growth on this planet will be reached sometime within the next one hundred years.… The most probable result will be a rather sudden and uncontrollable decline in both population and industrial capacity.… Given present resource consumption rates and the projected increase in these rates, the great majority of currently nonrenewable resources will be extremely expensive 100 years from now.33
The Club of Rome has revisited The Limits to Growth on numerous occasions. In 2017, to give just one example, it published a new report titled, Come On! Capitalism, Short-Termism, Population and the Destruction of the Planet, which insisted that “the Club of Rome’s warnings published in the book Limits to Growth are still valid” and warned that the “current worldwide trends are not sustainable.”34
It was in this gloomy intellectual environment that Earth Day was born. As the New York Times recalled on April 22, 2014:
When environmentalists proclaimed the first Earth Day, on this date in 1970, the air was filled with doomsday predictions. At the initial rallies to mark the day, people warned of overpopulation, a denuded planet, hundreds of millions of people starving to death, a new Ice Age or the greenhouse effect. Many—though not all, obviously—of those forecasts were off.35
The initial event was the brainchild of American peace activist John McConnell, who “proposed a global holiday to celebrate Earth’s life and beauty” at the United Nations Educational, Scientific and Cultural Organization conference in San Francisco in October 1969.36 Like McConnell, we fully support sensible measures to protect the environment and join in celebration of the beauty of our planet. What we object to is the notion that human flourishing and well-being of the planet are incompatible.
Measuring the Availability of Resources
In this paper, we look at the prices of commodities from a global perspective. Building on Cox and Alm’s methodology, we introduce a concept of “time-price,” which is the amount of time that an average human has to work in order to earn enough money to buy a commodity. The time-price then allows us to take a new look at Simon’s thesis, which states that population growth will result in “less scarcity in the long run.”37
Our Resources Are Neither Fully Known nor Fixed in a Meaningful Way
The Earth is a closed system. One day, we might be able to replenish our resources from outer space by, for example, dragging a mineral-rich asteroid down to Earth. In the meantime, we have to make do with the resources we have. But what exactly do we have? We cannot be sure, for the full extent of our resources is not known. Consider the last crisis over the availability of natural resources and note the ingenious ways in which humanity tackled that particular problem.
In September 2010, a Chinese fishing trawler and a Japanese coast guard vessel collided in waters disputed by the two countries. The Japanese detained the captain of the Chinese vessel, and China responded by halting all shipments of rare earth minerals to Japan. The latter used the imported metals in a number of high-tech industries, including production of magnets and Toyota Priuses. At the time of the embargo, China accounted for 97 percent of the production of these rare earths and a large part of the processing business. Predictably, global panic ensued.
In the United States, where these rare elements are used in defense systems, wind turbines, and electric cars, the great and the good rang the alarm bells. Writing in the New York Times, the Nobel Prize–winning economist Paul Krugman opined:
You really have to wonder why nobody raised an alarm while this was happening, if only on national security grounds. But policymakers simply stood by as the U.S. rare earth industry shut down.… The result was a monopoly position exceeding the wildest dreams of Middle Eastern oil-fueled tyrants. Couple the rare earth story with China’s behavior on other fronts—the state subsidies that help firms gain key contracts, the pressure on foreign companies to move production to China and, above all, that exchange-rate policy—and what you have is a portrait of a rogue economic superpower, unwilling to play by the rules. And the question is what the rest of us are going to do about it.38
In a 2014 Council on Foreign Relations report, Eugene Gholz, an associate professor of political science at the University of Notre Dame, revisited the crisis and found that the Chinese embargo proved to be a bit of a dud. Some Chinese exporters got around the embargo by using legal loopholes, such as selling rare earths after combining them with other alloys. Others simply smuggled the elements out of China. Some companies found ways to make their products using smaller amounts of the elements, while others “remembered that they did not need the high performance of specialized rare earth[s].… [T]hey were merely using them because, at least until the 2010 episode, they were relatively inexpensive and convenient.”39
Another effect of the embargo was that companies around the world started raising money for new mining projects, ramped up existing plant capacities, and accelerated plans to recycle rare earths. The market response, then, diffused the immediate crisis. Prices of rare earths, which spiked in 2011, came down again.40 In the long run, the future looks brighter still.
In 2018, a team of 21 Japanese scientists discovered a 16-million-ton patch of mineral-rich deep-sea mud near Minami-Tori Island, which lies 790 miles off the coast of Japan. The patch appears to contain a wealth of rare earth elements, including 780 years’ worth of yttrium, 620 years’ worth of europium, 420 years’ worth of terbium, and 730 years’ worth of dysprosium. This find, the scientists concluded, “has the potential to supply these materials on a semi-infinite basis to the world.”41 It turns out that rare earths may not be so “rare” after all.42
Moreover, our resources are not fixed. Freshwater reserves, for example, have been declining for decades, leading many a writer to warn about future water shortages.43 But 71 percent of the Earth’s surface is covered by water, mostly salty sea water. What’s needed in the areas most affected by drought, such as North Africa and the Middle East, is an affordable process of desalination that separates salt particles from water molecules. Israel has pioneered a desalination method that makes freshwater consumed by Israeli households 48 percent cheaper than that consumed by the people of Los Angeles. As Rowan Jacobsen wrote in Scientific American:
Desal [desalinization] works by pushing saltwater into membranes containing microscopic pores. The water gets through, while the larger salt molecules are left behind. But microorganisms in seawater quickly colonize the membranes and block the pores, and controlling them requires periodic costly and chemical-intensive cleaning. But [Israeli scientist] Bar-Zeev and colleagues developed a chemical-free system using porous lava stone to capture the microorganisms before they reach the membranes. It’s just one of many breakthroughs in membrane technology that have made desalination much more efficient. Israel now gets 55 percent of its domestic water from desalination, and that has helped to turn one of the world’s driest countries into the unlikeliest of water giants.44
Similar stories can be told of all kinds of human endeavors. That’s because what matters is not the total number of atoms on Earth, but the infinite number of ways in which those atoms can be combined and recombined. As the Nobel Prize–winning New York University economics professor Paul Romer writes,
Every generation has perceived the limits to growth that finite resources and undesirable side effects would pose if no new recipes or ideas were discovered. And every generation has underestimated the potential for finding new recipes and ideas. We consistently fail to grasp how many ideas remain to be discovered. The difficulty is the same one we have with compounding. Possibilities do not add up. They multiply.… To get some sense of how much scope there is for more such discoveries, we can calculate as follows. The periodic table contains about a hundred different types of atoms. If a recipe is simply an indication of whether an element is included or not, there will be 100 × 99 recipes like the one for bronze or steel that involve only two elements. For recipes that can have four elements, there are 100 × 99 × 98 × 97 recipes, which is more [than] 94 million. With up to 5 elements, more than 9 billion. Mathematicians call this increase in the number of combinations “combinatorial explosion.” Once you get to 10 elements, there are more recipes than seconds since the big bang created the universe. As you keep going, it becomes obvious that there have been too few people on earth and too little time since we showed up, for us to have tried more than a minuscule fraction of the all the possibilities.45
Figuring out the availability of resources, therefore, is not about measuring the quantity of resources, as engineers do. It is about looking at the prices of resources, as economists do. In a competitive economy, humanity’s knowledge about the value of something tends to be reflected in its price. As new knowledge emerges, prices change accordingly.
The Nominal Price of Resources
Markets, then, generate nominal or current prices of commodities, and those prices are the best proxies we have for understanding resource availability at any given time. There are a number of organizations that collect commodity prices. In this paper, we rely on data from the World Bank and the International Monetary Fund (IMF) in Washington, D.C. The two institutions track nominal prices of an array of commodities, with some data going as far back as 1960.46
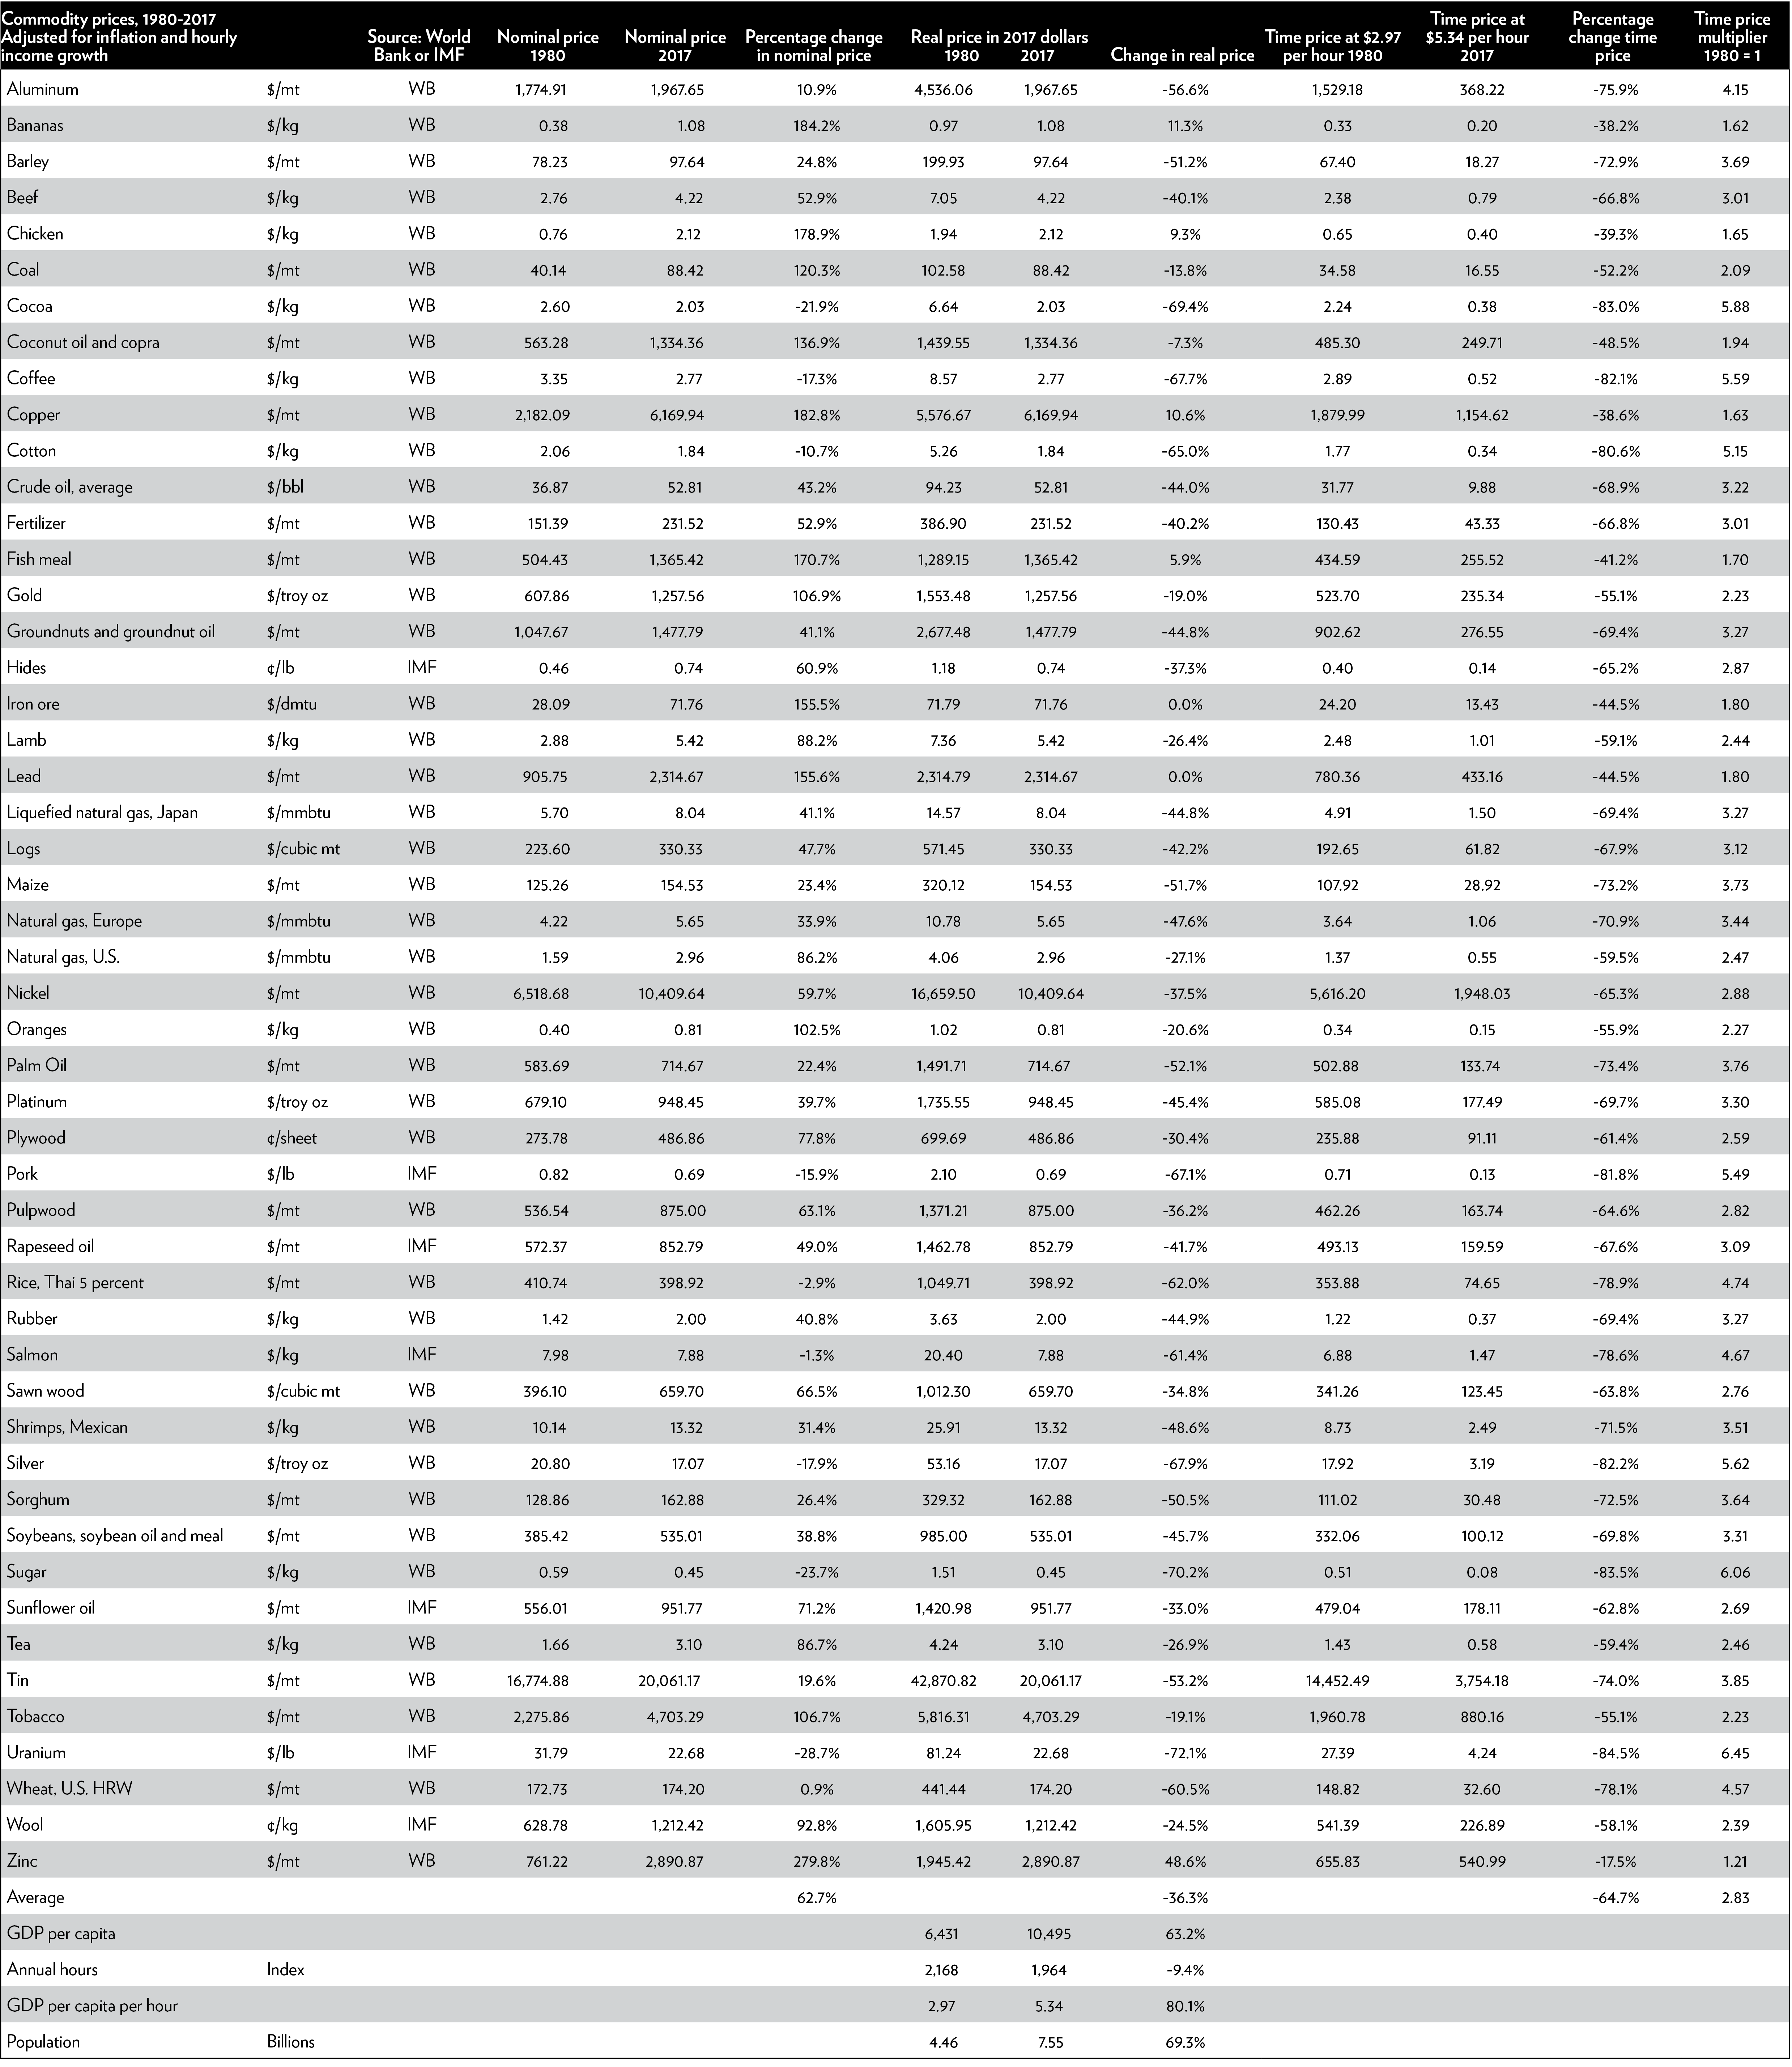
After some consolidation of the available data, a process that we describe at length in Appendix 1, we ended up with a basket of 50 commodities. All the items in the basket are weighted equally (i.e., 2 percent each) and can be divided into five categories. Food and beverages account for 48 percent of the overall composition of the basket, metals account for 20 percent, energy for 12 percent, raw materials for 14 percent, and precious metals for 6 percent (see Figure 1).
Figure 1: Commodity weighting and distribution
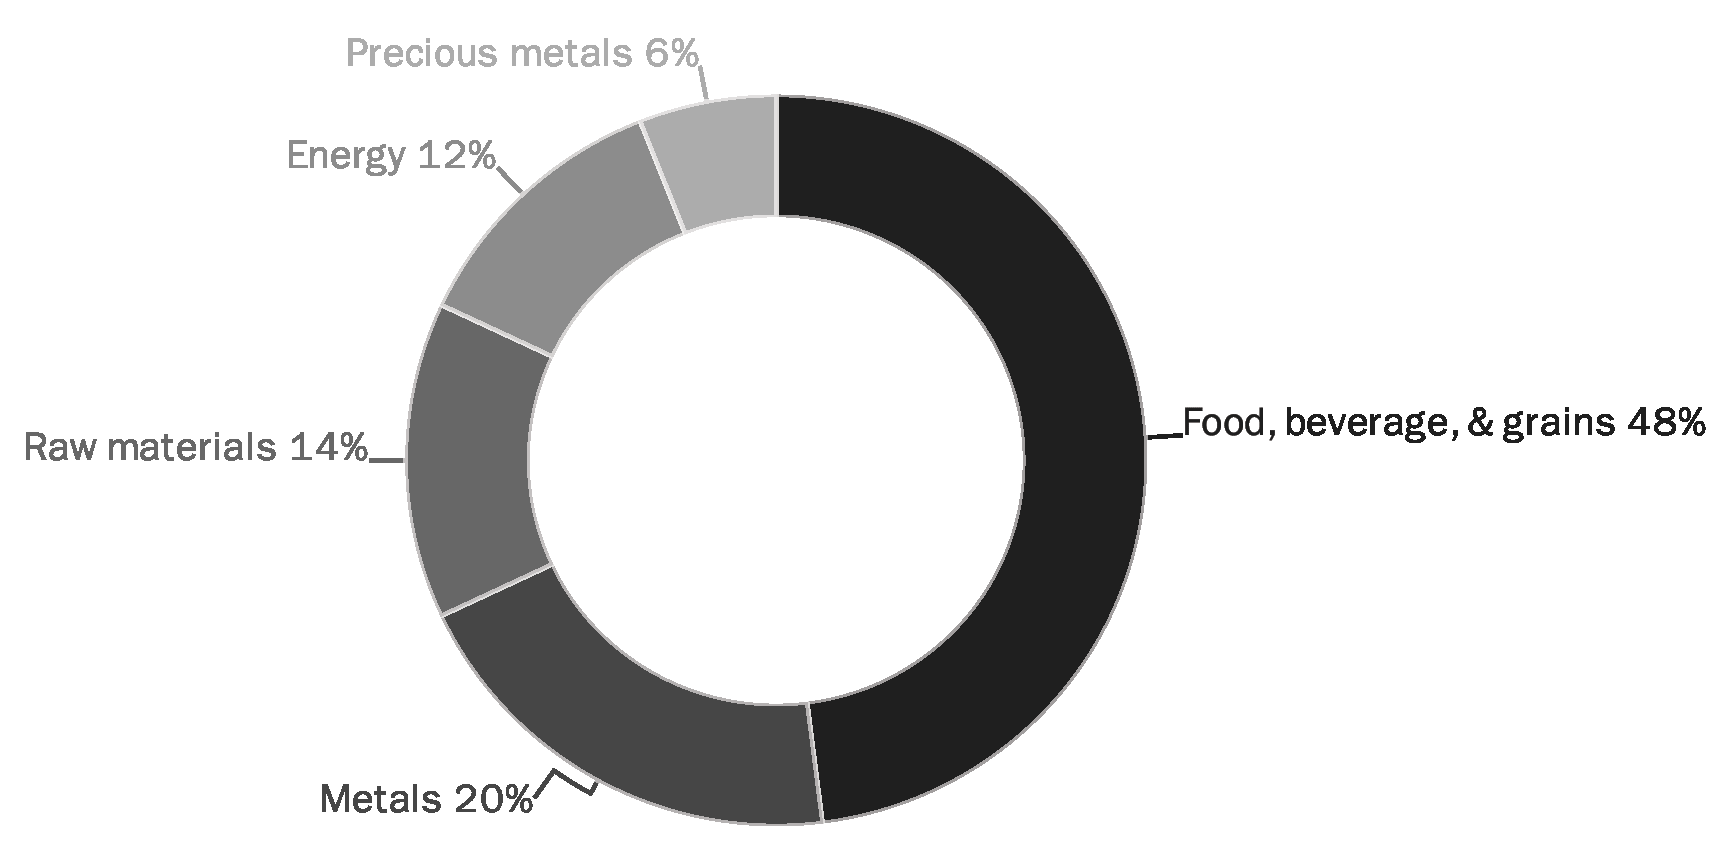
Source: Authors' calculations, based on World Bank and IMF databases.
We started our analysis in 1980 because data for many of the commodities tracked by the World Bank and the IMF do not go back further than that. Coincidentally, 1980 also coincides with the launch date of the Simon–Ehrlich wager.
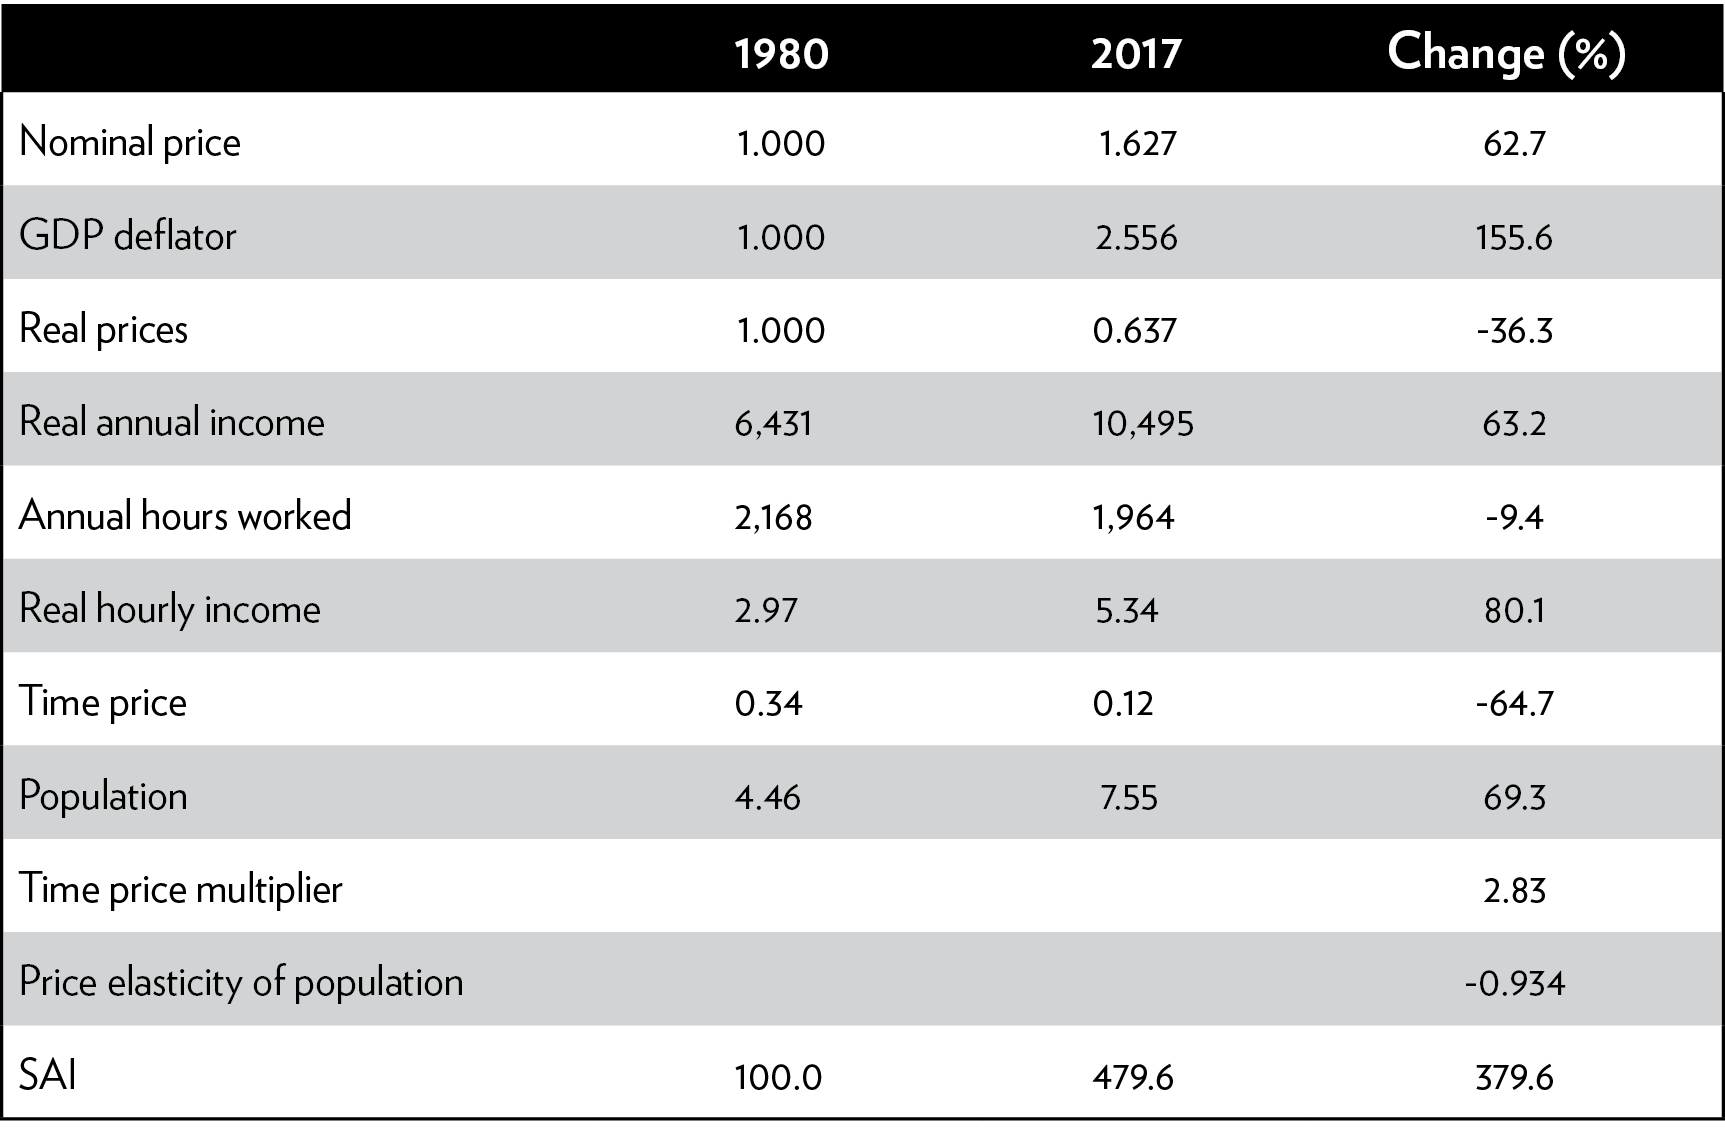
What did we find? Between 1980 and 2017, the nominal prices of 9 commodities fell, while the nominal prices of 41 commodities increased. The average nominal price of our basket of commodities rose by 62.7 percent (see Appendix 2).
The Real Price of Resources
To understand long-term trends in the availability of resources, which is what both Simon and Ehrlich were interested in, one must start by adjusting the nominal prices of commodities for inflation. The value of fiat money tends to decline every year, so it is possible for a commodity to “seem” to become more expensive even though its “real” price has declined or remained the same. To adjust our basket of commodities for inflation, we used the “Gross Domestic Product: Implicit Price Deflator,” which is published by the U.S. Department of Commerce’s Bureau of Economic Analysis.47
Between 1980 and 2017, the price level rose by 156 percent. Adjusted for inflation, 43 commodities declined in real price, two remained equally valuable, and five increased in real price. On average, the real price of our basket of commodities fell by 36.3 percent between 1980 and 2017 (see Appendix 2).
The Real Hourly Rate of Income
Income is a key variable in measurement of the availability of resources. When real commodity prices rise faster than real or inflation-adjusted income, the commodities become more expensive relative to income. All else being equal, when a commodity, such as gas, becomes dearer, people have less money left for other purchases, such as clothing. As a consequence, people are left worse off.
Conversely, when real commodity prices rise at a slower rate than real income, the commodities become cheaper relative to income. All else being equal, when a commodity, such as gas, becomes cheaper, people have more money left for other purchases, such as clothing. As a consequence, people are left better off. If real commodity prices fall while real incomes increase, people benefit to an even greater degree.
Thankfully, incomes tend to rise at a faster rate than inflation because humanity tends to become more productive over time. That’s true of our species as a whole (i.e., we are more productive than our Stone Age ancestors) and it’s true for individuals in their prime working age (i.e., up to a certain point, people tend to become more productive with age).
The rise in incomes, however, does not tell us everything we need to know about availability of resources because the average number of hours worked per worker changes over time. If, for example, people’s annual incomes remain the same but they work fewer hours, their hourly incomes actually increase. If people’s annual incomes increase even though they work fewer hours, their hourly incomes are greater still. Looking at annual income divided by annual hours worked, therefore, gives us a more precise hourly income rate.
The World Bank collects gross domestic product (GDP) per capita in current U.S. dollars.48 As was the case when we calculated the real price of commodities, we deflated world average GDP per capita in current U.S. dollars with the GDP deflator. We found that between 1980 and 2017, real average annual per capita income in the world rose from $6,431 to $10,495 (in 2017 U.S. dollars).49 That’s a 63.2 percent increase.
Over the same time period, the population-adjusted average annual hours worked per worker declined from 2,168 hours to 1,964 hours.50 That’s a 9.4 percent reduction.51 In other words, the real average hourly income in the world grew from $2.97 in 1980 to $5.34 in 2017.52 That’s an 80.1 percent increase. It is this average hourly rate that underpins the “time-price of resources” (see below).
The Time-Price of Resources
Dividing the change in the real price of a commodity by the change in the real hourly rate of income per capita allows us to arrive at the time-price of a commodity, which is time that an average human has to work in order to earn enough money to buy a commodity. According to our methodology, if the real price of a commodity increases by 10 percent but the real hourly income rate increases by 20 percent, the time-price of a commodity falls by 8.3 percent.53
What did we find? As previously shown, the real price of our basket of commodities decreased by an average of 36.3 percent between 1980 and 2017. During the same time period, the global real hourly income rate per capita grew by 80.1 percent. The time-price of our basket of commodities has, therefore, fallen by 64.7 percent (see Figure 2).54
Figure 2: Percentage change in nominal, real, and time-price of a basket of commodities, 1980–2017
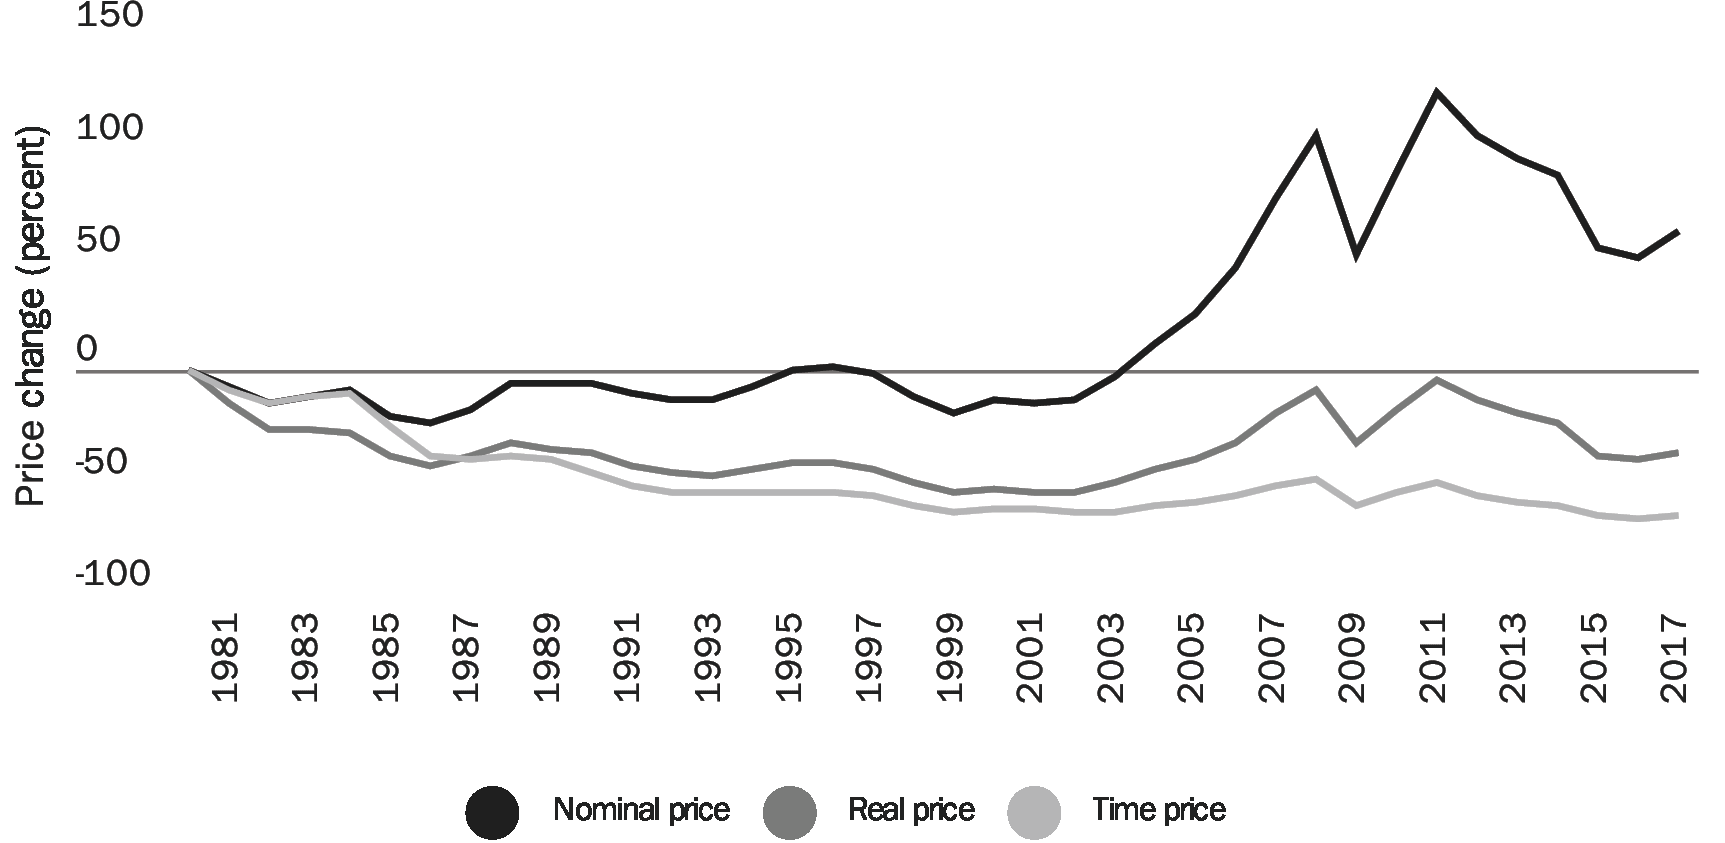
Sources: “Commodity Price Data,” World Bank, http://www.worldbank.org/en/research/commodity-markets; International Monetary Fund, http://www.imf.org/external/np/res/commod/External_Data.xls; “Gross Domestic Product: Implicit Price Deflator,” FRED Economic Data, https://fred.stlouisfed.org/series/GDPDEF#0; “GDP per capita (current US$),” World Bank, https://data.worldbank.org/indicator/NY.GDP.PCAP.CD; “Total Economy Database,” The Conference Board, https://www.conference-board.org/data/economydatabase/.
A 64.7 percent drop in the time-price of commodities between 1980 and 2017 translates to an annual compounded rate of decline of 2.77 percent. That means that, should the current trend continue, commodities will become 50 percent cheaper every 26 years.
When it comes to the availability of resources, percentage changes are interesting, but multipliers can be even more illuminating. Saying that something has dropped in time-price by 50 percent is the same as saying that a person can now purchase two items for the same amount of time that it used to take to earn the money to purchase just one item. We call that the “time-price multiplier.”55
Before proceeding, note that declining prices result in exponential, not linear, gains. Thus, a 75 percent decline in price allows a person to purchase four items; a 90 percent decline results in 10 items; a 95 percent decline in 20 items; and a 96 percent decline in 25 items. A 1 percentage point change from 95 percent to 96 percent, in other words, enhances the gain by 25 percent.
Now, back to our time-price multiplier. The time it took to earn enough money to buy one unit in our basket of commodities in 1980 bought 2.83 units in 2017.56 Put differently, commodities that took 60 minutes of work to buy in 1980 took only 21 minutes of work to buy in 2017. Thus, whether one looks at percentages or multipliers, it is clear that Simon’s thesis holds. Commodities really did become less costly over time.
The Price Elasticity of Population
In Simon’s telling, commodities grow more plentiful not in spite of population growth, but because of it. With every hungry mouth comes a brain capable of reason and innovation. Was he correct? The price elasticity of population (PEP) can help us answer that question.
In economics, elasticity is a measure of a variable’s sensitivity to a change in another variable. Consider, for example, the relationship between price and demand. If the price of a product increases by 50 percent and the purchases of that product fall by 25 percent, then we can say that for every percentage point increase in the price of a product, the demand for that product decreased by half a percentage point.57
Why is this concept important? If the PEP value ends up being positive, we will be able to infer that time-price of commodities increased in response to population growth. If the PEP value ends up being negative, we will be able to infer that time-price of commodities declined in response to population growth.58
Between 1980 and 2017, the time-price of our basket of commodities declined by 64.7 percent. Over the same time period, the world’s population increased from 4.46 billion to 7.55 billion.59 That’s a 69.3 percent increase. The PEP indicates that the time-price of our basket of commodities declined by 0.934 percent for every 1 percent increase in population.60
As noted, people often assume that population growth leads to resource depletion. We found the opposite. Over the past 37 years, every additional human being born on our planet appears to have made resources proportionately more plentiful for the rest of us.61
From Relative Scarcity to Abundance
So far, we have avoided using the term “scarcity” except when quoting from Simon’s works. Simon, however, was responding to Ehrlich, who predicted scarcity of natural resources. In 1974, for example, Ehrlich wrote “that before 1985 mankind will enter a genuine age of scarcity in which many things besides energy will be in short supply.”62 In Ehrlich’s telling, scarcity equals depletion of resources. As he noted in 1997:
Since natural resources are finite, increasing consumption obviously must “inevitably lead to depletion and scarcity.” Currently there are very large supplies of many mineral resources, including iron and coal. But when they become “depleted” or “scarce” will depend not simply on how much is in the ground but also on the rate at which they can be produced and the amount societies can afford to pay, in standard economic or environmental terms, for their extraction and use. For most resources, economic and environmental constraints will limit consumption while substantial quantities remain.… For others, however, global “depletion”—that is, decline to a point where worldwide demand can no longer be met economically—is already on the horizon. Petroleum is a textbook example of such a resource.63
In economics, in contrast, scarcity “is a relative rather than an absolute concept—water is scarcer in the desert and less scarce in the rainforest.”64 Economists, Simon included, see resource scarcity as a temporary challenge that can be solved through greater efficiency, increased supply, development of substitutes, and so on.
The relationship between prices and innovation is dynamic. Relative scarcity leads to higher prices, higher prices create incentives for innovations, and innovations lead to abundance. Scarcity gets converted to abundance through the price system. The price system functions as long as the economy is based on property rights, rule of law, and free exchange.
In relatively free economies, resources do not get depleted in the way that Ehrlich feared they would. In fact, resources tend to become more abundant. That is why, in recent years, scholars have started to write about the age of abundance, a state of affairs in which “technology has the potential to significantly raise the basic standards of living for every man, woman, and child on the planet.”65
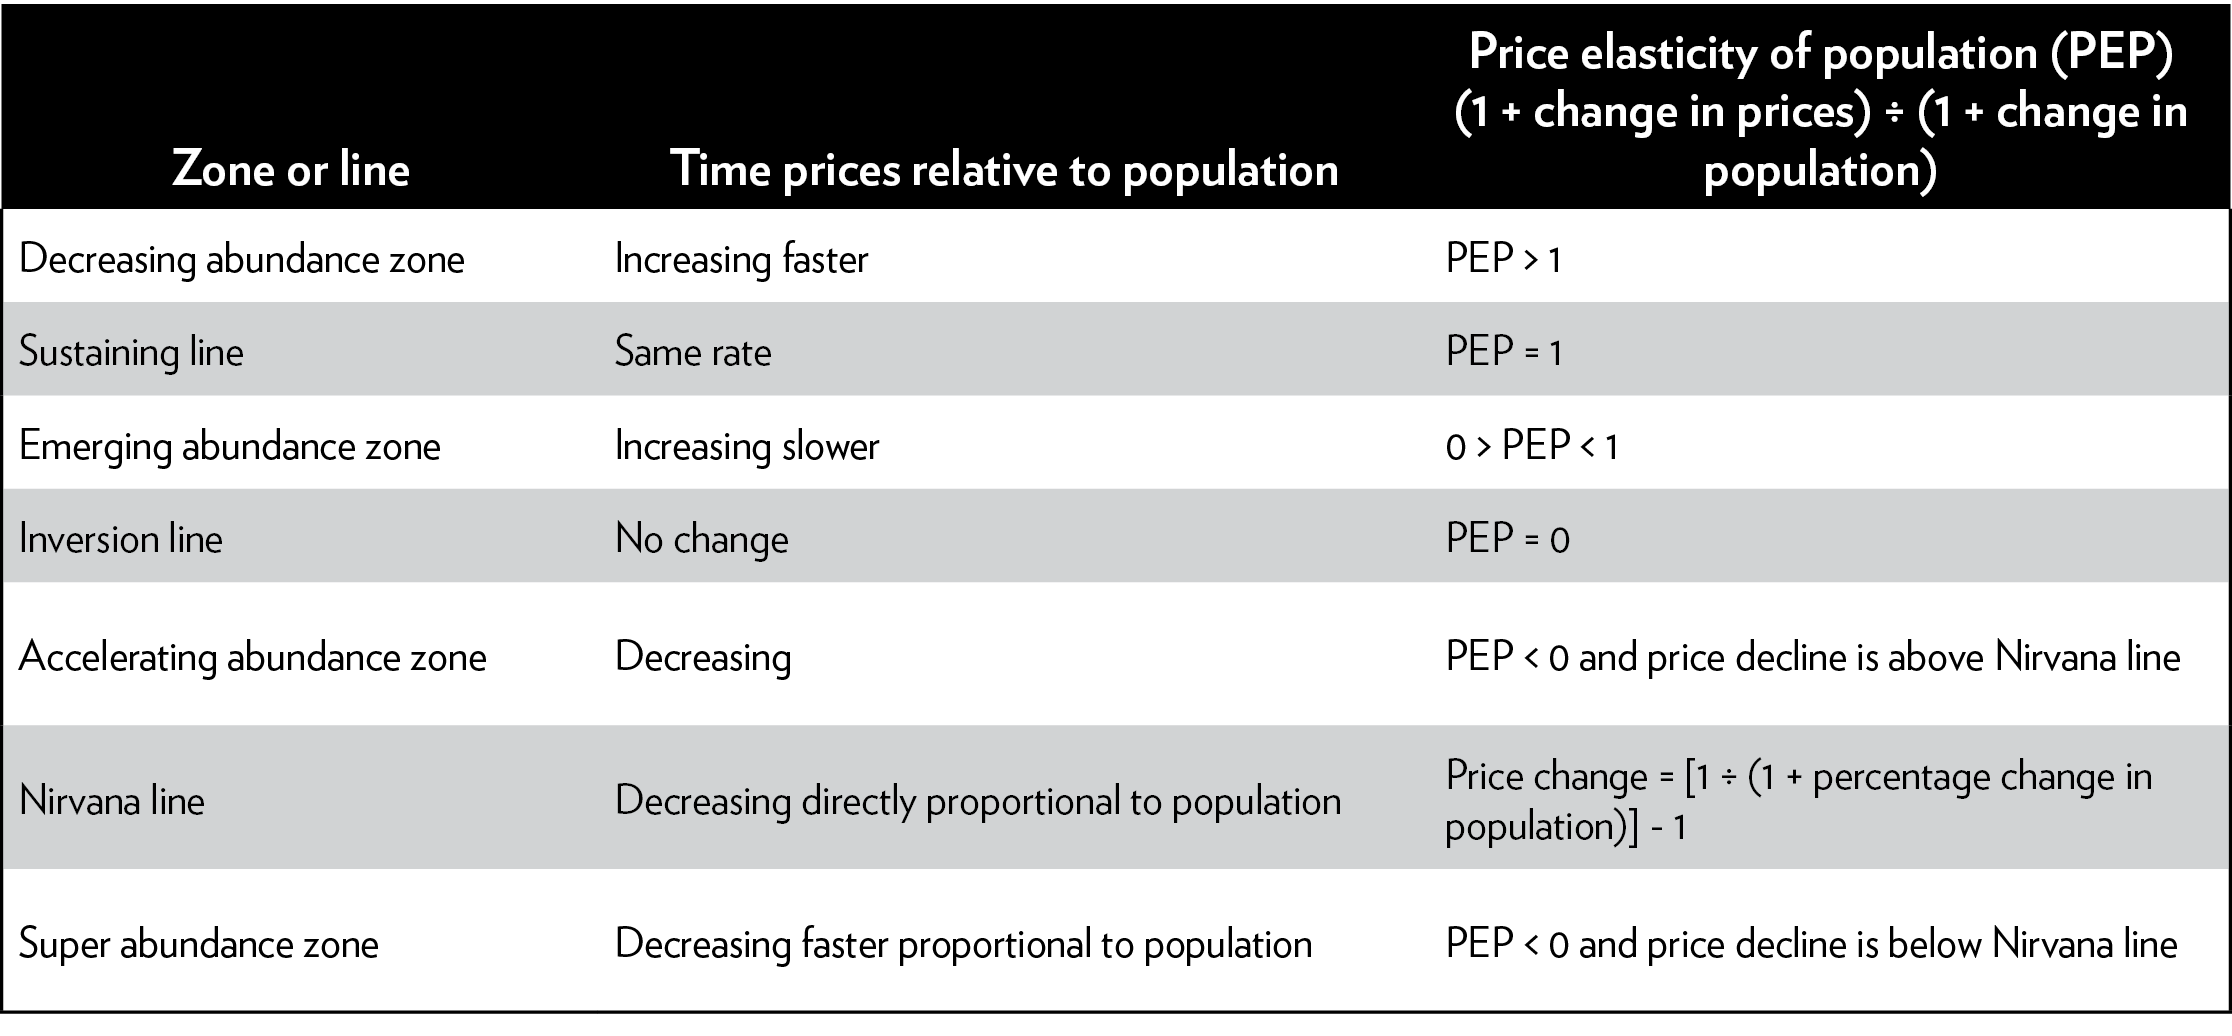
The Simon Abundance Framework
In this section, we use PEP values to propose four zones of resource abundance. These zones are demarcated by lines, which reflect the magnitude of the change in the time-price of commodities relative to population growth or PEP.66 We call this progression from scarcity to greater abundance the Simon Abundance Framework (see Table 1).
- When the PEP is greater than 1, the time-price of commodities increases faster than population. PEP > 1 can be referred to as the decreasing abundance zone.
- When the PEP equals 1, the time-price of commodities and population change at the same rate. PEP = 1 can be referred to as the sustaining line.
- When the PEP is smaller than 1 but greater than 0, the time-price of commodities increases at a slower rate than does population. PEP < 1 and > 0 can be referred to as the emerging abundance zone.
- When the PEP equals 0, the time-price of commodities does not change as population increases. PEP = 0 can be referred to as the inversion line.
- When the PEP is less than 0, the time-price of commodities decreases while population increases. Note that PEP < 0 can denote two additional zones of abundance: the accelerating abundance zone or the superabundance zone. These two zones are divided by the Nirvana line (see the next section).
Table 1: The Simon Abundance Framework
Source: Authors’ analysis.
Note: The Simon Abundance Framework assumes that population change is always positive.
Nirvana Line
The Nirvana Line separates accelerating abundance (i.e., time-price decreases as population increases) from superabundance (i.e., time-price decreases at a faster proportional rate than population increases). The Nirvana Line Equation (NLE) specifies the exact amount past which time-price must decline for abundance to increase at a faster rate than population growth.
Note that the relationship between time-price decline and population growth is nonlinear (see Figure 3). For example, if population increases by 50 percent, time-price must decline by 33 percent for abundance to continue to increase at a faster rate than population growth.67
Figure 3: Nirvana line
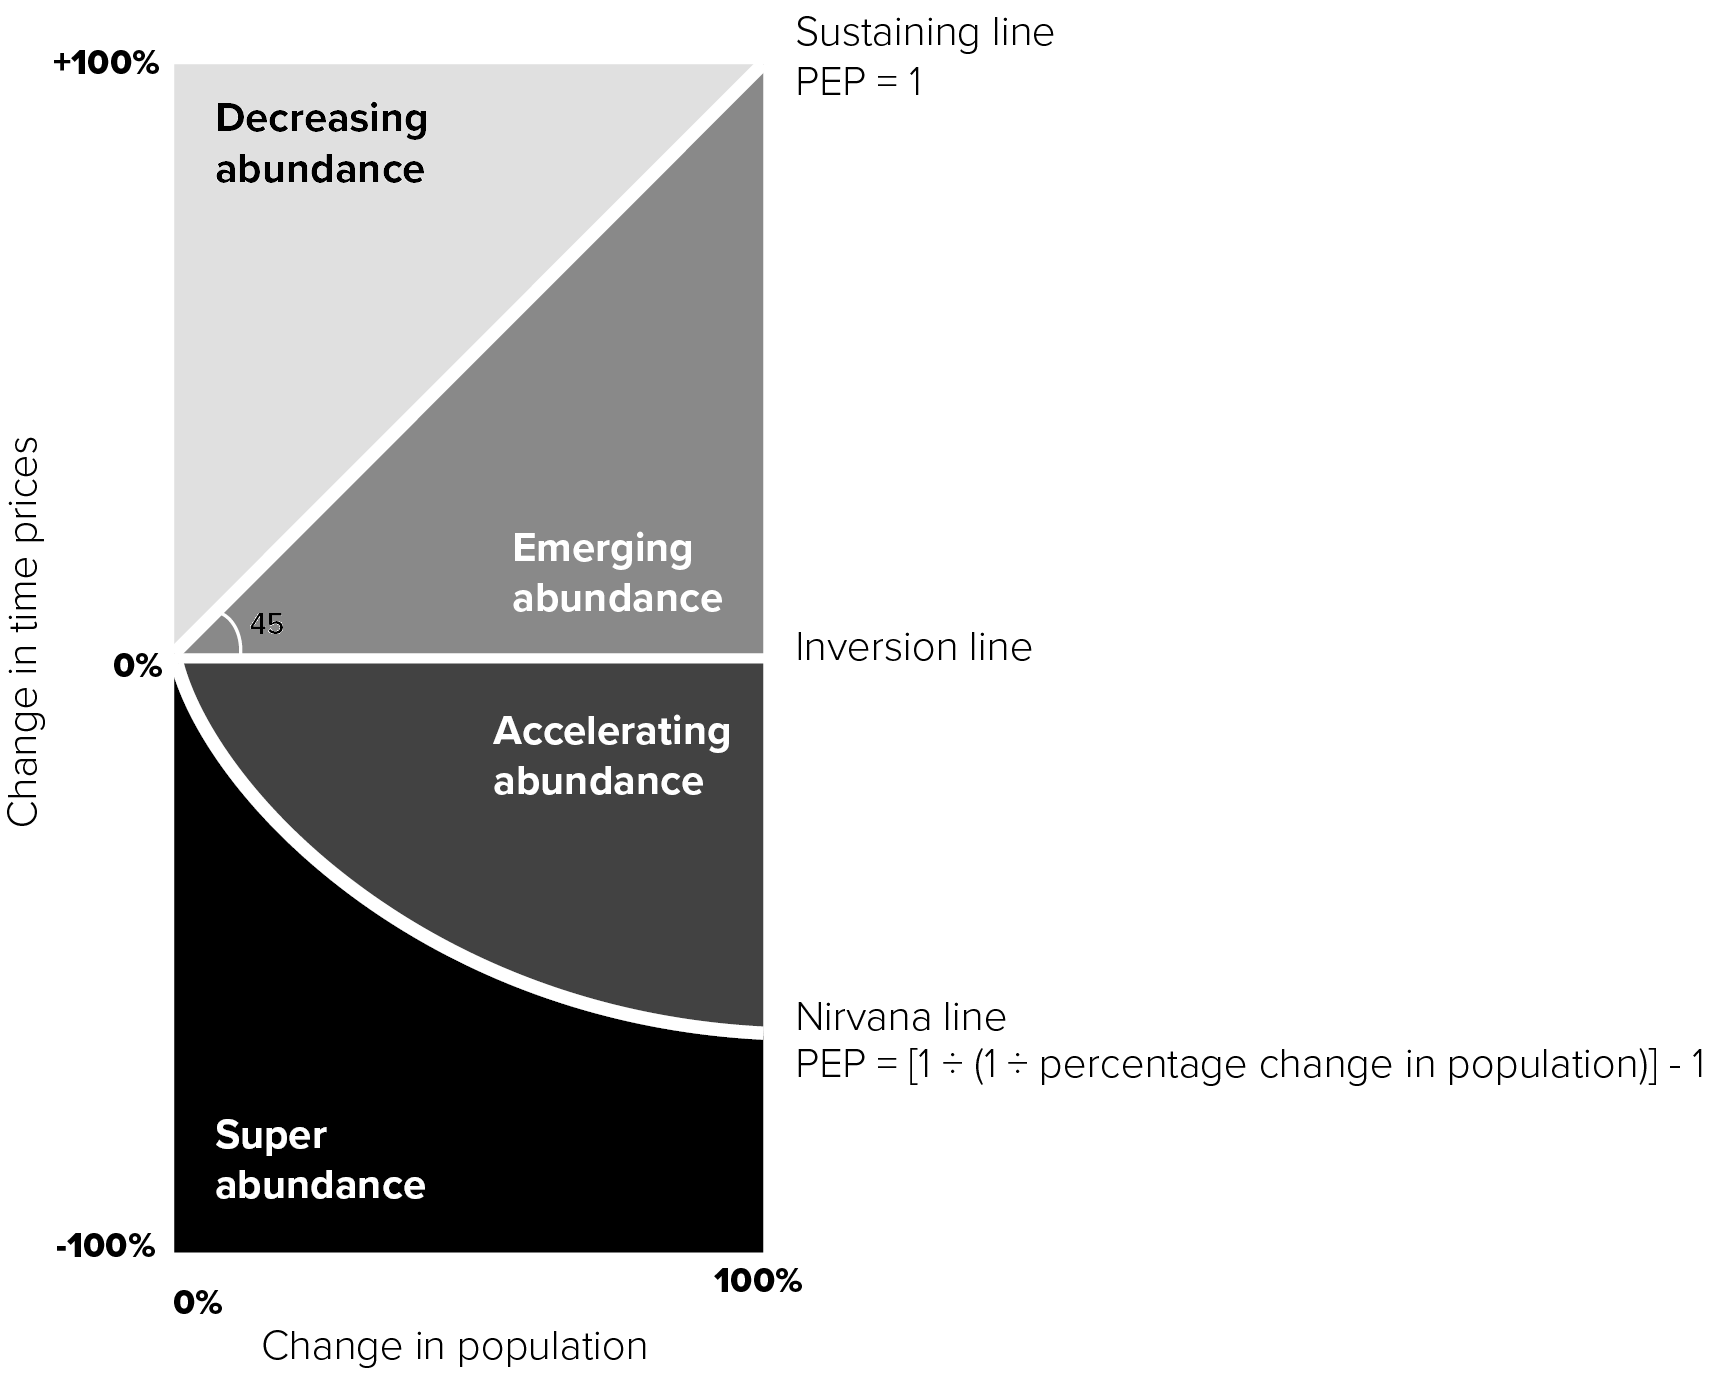
Source: Authors’ calculations.
Note: PEP = price elasticity of population.
As noted, population increased by 69.3 percent between 1980 and 2017. To qualify for superabundance, therefore, the time-price of our basket of commodities has to fall by at least 40 percent.68
Considering that the time-price of our basket of commodities declined by 64.7 percent, we can conclude that the world is experiencing superabundance. Should the time-price of our basket of commodities fall at a somewhat slower rate than the NLE determines in the future, the economy will revert to accelerating abundance.69
Simon Abundance Index
The Simon Abundance Index (SAI) measures the change in abundance of resources over a period of time. The SAI represents the ratio of the change in population over the change in the time-price, times 100. It has a base year of 1980 and a base value of 100. Between 1980 and 2017, resource availability increased at a compounded annual growth rate of 4.32 percent. That means that the Earth was 379.6 percent more abundant in 2017 than it was in 1980.70 In 2018, the value of the SAI stands at 479.6. Put differently, the Earth was 4.796 times as plentiful last year as it was when Ehrlich and Simon commenced their famous wager (see Figure 4).71
Figure 4: Simon Abundance Index 1980–2017
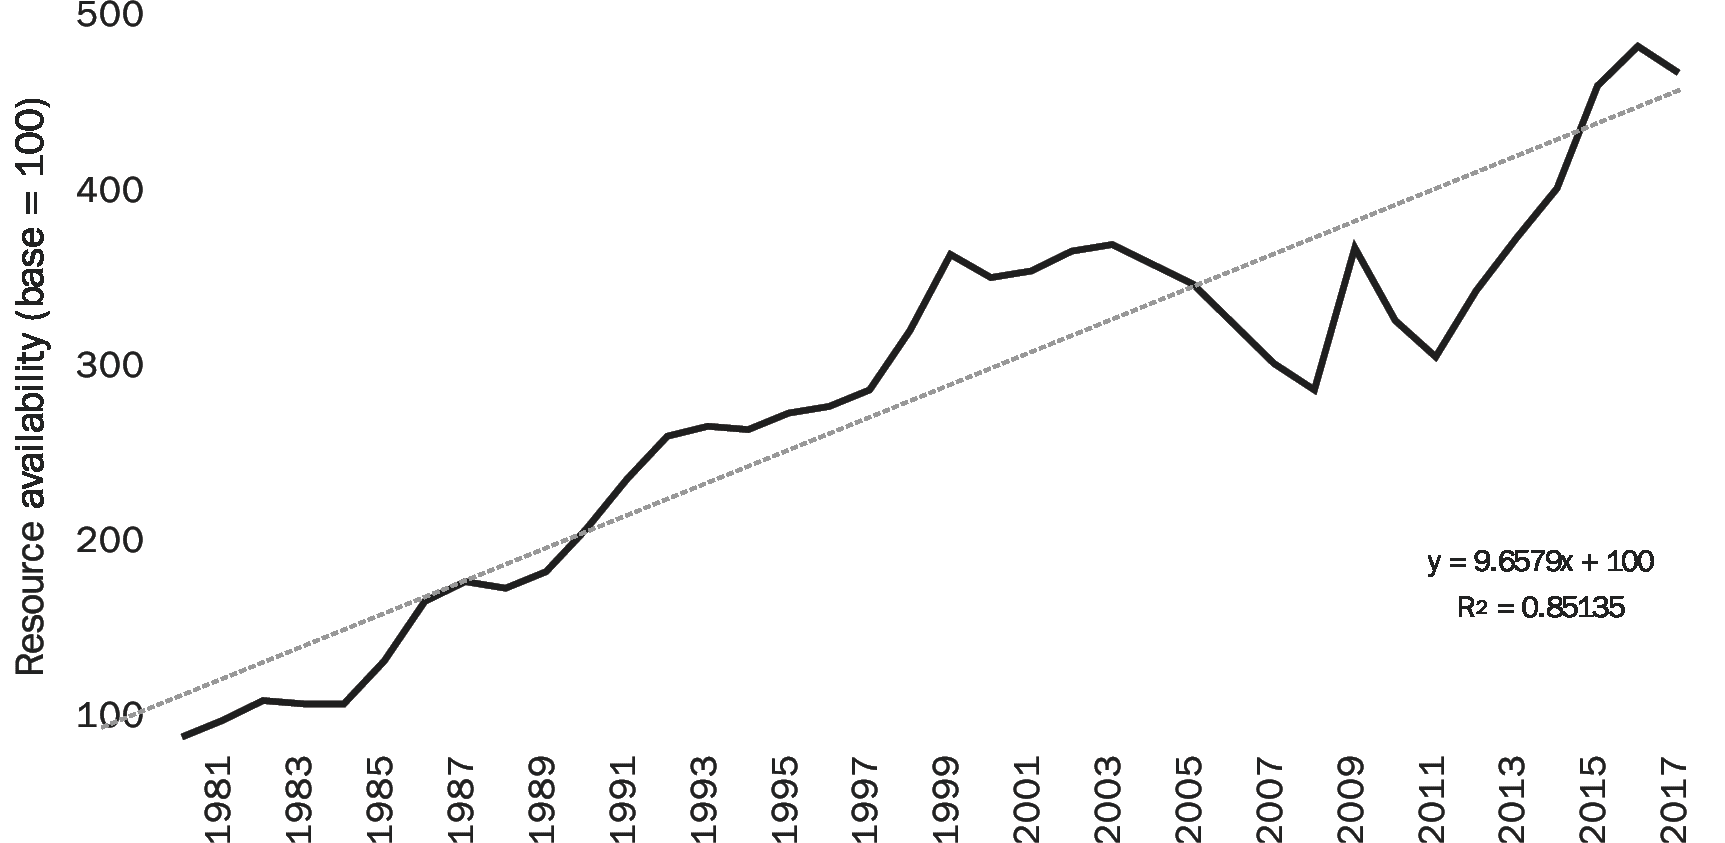
Source: Authors’ analysis.
Simon’s Rule
Simon foresaw greater resource abundance and predicted that cheaper commodities would translate into higher living standards.72 Indeed, incomes grew and commodities became cheaper between 1980 and 2017. But Simon also assumed that many people would remain oblivious to the positive changes around them. As he noted in an interview a year before he died, “This is my long-run forecast in brief: The material conditions of life will continue to get better for most people, in most countries, most of the time, indefinitely. . . . I also speculate, however, that many people will continue to think and say that the conditions of life are getting worse.”73
Again, Simon was correct. Earlier this year, for example, a survey found that “American high school students are very worried about overpopulation.” The students answered a number of questions, including “How worried are you that an ever-increasing population will continue to use up the Earth’s limited reserves of freshwater, fertile soil, forests and fisheries?” In response to that question, 29 percent of students replied that they were very worried, and 38 percent replied that they were somewhat worried. Only 20 percent were not too worried, while 13 percent expressed no opinion.74 Such views are common.
Consequently, we propose Simon’s Rule, which states that “As population increases, the time-price of most commodities will get cheaper for most people, most of the time. Unfortunately, most people will assume the opposite.”
Forecasts
Our analysis covered 37 years, from 1980 to 2017. Population increased by 69.3 percent from 4.46 billion to 7.55 billion and the time-price of our basket of commodities decreased by 64.7 percent, suggesting that our planet has become 379.6 percent more abundant. According to the United Nations’ medium fertility variant estimates, the world’s population will increase by a further 32 percent over the next 37 years, rising from 7.55 billion in 2017 to 9.97 billion in 2054.75 What should we expect to happen to commodity prices?
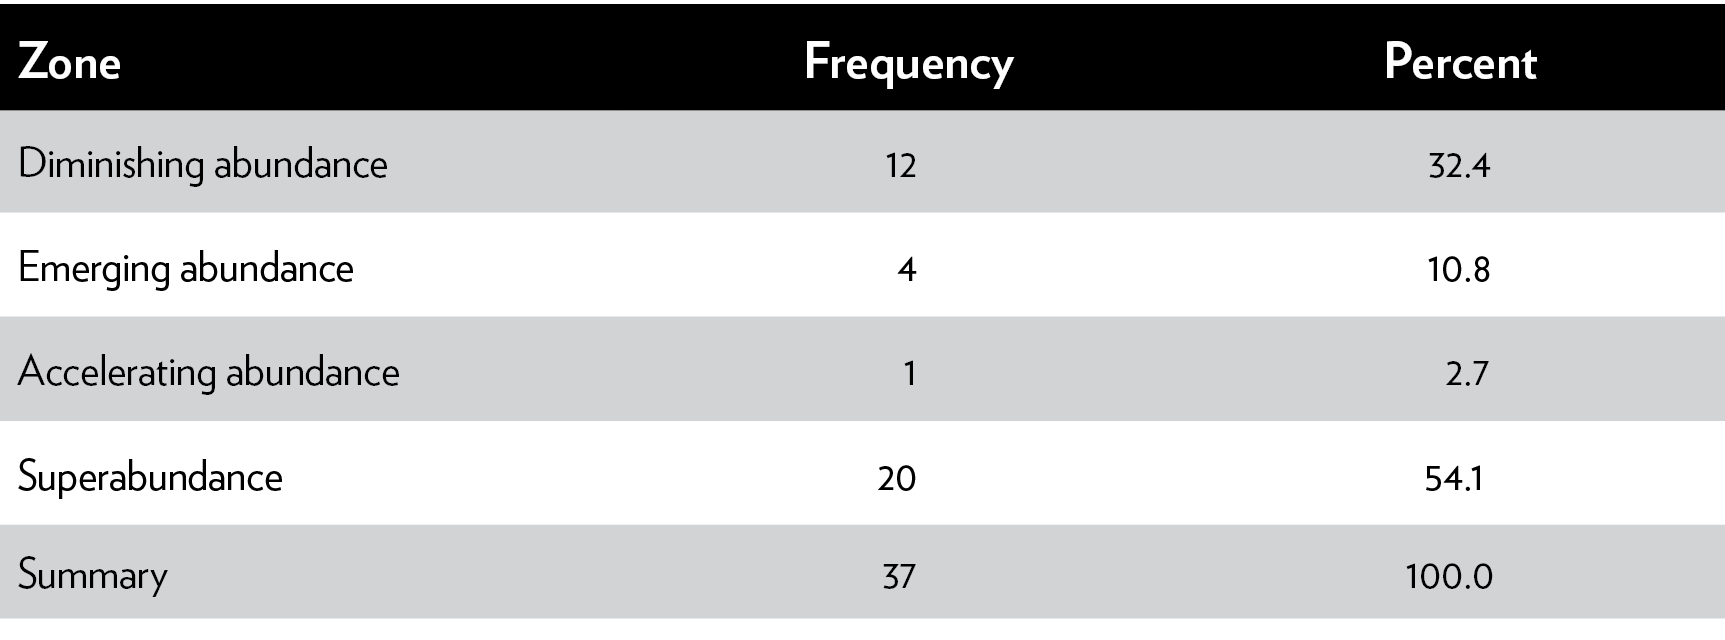
We have calculated the PEP values for each year between 1980 and 2017. Our analysis indicates a mean PEP value of -1.530, with a minimum of -16.76 and a maximum of 11.00.76 The range between the two PEP values was 27.76.77 According to our analysis, over the past 37 years humanity experienced decreasing abundance 32 percent of the time and superabundance 54 percent of the time (see Table 2).
Table 2: Frequency of PEP values based on the Simon Abundance Framework zones, 1980–2017
Source: Authors’ analysis.
Note: PEP = price elasticity of population.
We expect the annual PEP to be around−0.90 going forward.78 If population increases by 32 percent and the PEP coefficient remains around−0.90, then the time-price of our basket of commodities should decline by around 29 percent. Moreover, our planet will be 83 percent more abundant in 2054 than it was in 2017.
The NLE for a population increase of 32 percent indicates that the time-price of our basket of commodities will have to fall by at least 24 percent. Only then will abundance continue to increase at a faster rate than population growth. Considering that we estimate a further 29 percent decrease in the time-price of our basket of commodities, the world should continue to experience superabundance.
However, we do recognize the large variation in the PEP values. Thus, we expect to see a decreasing abundance indicator around 32.4 percent of the time. Simon, it should be remembered, predicted periods of higher commodity prices. But he expected that higher commodity prices would create incentives for innovation that would, ultimately, lead to greater resource abundance.
Summary of Findings
In this paper, we have revisited and updated the decades-long debate between Paul Ehrlich and Julian Simon. The main point of contention between the biologist and the economist was the effect of population growth on the availability of natural resources. Ehrlich argued that humanity would deplete Earth’s resources, while Simon argued that humanity would make them more plentiful. The famous bet between the two resulted in Simon’s victory, although some researchers subsequently found that the win was partly the result of good luck. The Simon-Ehrlich wager lasted from 1980 to 1990. Our paper, which looked at data between 1980 and 2017, found that the real price of our basket of commodities decreased by 36.3 percent, while the time-price declined by 64.7 percent.
To arrive at the last number, we have developed a new price measure that we call time-price. Unlike resources, which can be made more abundant through greater efficiency, increased supply, and development of substitutes, time is finite. The more time we spend at work, the less time we have for other pursuits such as leisure. Time-price denotes the amount of time that people must spend working to earn enough money to buy something.
Considering that the real average hourly income per capita rose by 80.1 percent, the time it took to earn enough money to buy one unit in our basket of commodities in 1980 bought 2.83 units in 2017. Moreover, the 2.77 percent annual compounded rate of decline in the time-price of commodities suggests that commodities become 50 percent cheaper every 26 years. Finally, our data show that, using the time-price decline measure, Simon would have won his wager with Ehrlich each year between 1980 and 2017.
Furthermore, we have developed the concept of price elasticity of population, which allows us to estimate the effect of population growth on availability of resources. On the basis of a population increase of 69.3 percent and a time-price decline of 64.7 percent, we found that the time-price of our basket of commodities declined by 0.934 percent for every 1 percent increase in population. That means that every additional human being born on our planet seems to be making resources proportionately more plentiful for the rest of us.
The PEP also allowed us to develop the Simon Abundance Framework, which describes progression from decreasing abundance at the one end to superabundance at the other end. The Nirvana Line Equation allowed us to conclude that humanity is experiencing superabundance with the time-price of commodities decreasing at a faster proportional rate than the population is increasing.
Finally, we have developed the Simon Abundance Index, which measures the overall change in the abundance of resources over a period of time. The 2017 SAI of 479.6 suggests that our planet was 379.6 percent more abundant in resources in 2017 than it was in 1980. Put differently, resources were 4.796 times as plentiful in 2017 as they were in 1980.
Conclusion
While few people would go as far as to compare population growth and the concomitant increase in consumption to “the creed of a cancer cell,” as Ehrlich did, many people continue to feel uneasy about overpopulation and overconsumption. These concerns have deep historical roots and may have been justified at a time when human and animal worlds were more similar than they are today. Back then, a sudden increase in population really could lead to overconsumption of resources, starvation, and death.79
Today’s world, however, is very different from that analyzed by Aristotle or Malthus. As American writer Jonah Goldberg put it in a recent book chronicling human progress, “Almost everything about modernity, progress, and enlightened society emerged in the last 300 years. If the last 200,000 years of humanity were one year, nearly all material progress came in the last 14 hours.”80
It is, in fact, much more difficult to compile a list of measures by which the world is worse off today than it was before science, reason, and humanism made us all healthier, better fed, safer, richer, and even happier.81 We are also much better educated, though old habits, such as our propensity toward pessimism, refuse to go away. Hence Simon’s Rule, which states that “As population increases, the time-price of most commodities will get cheaper for most people, most of the time. Unfortunately, most people will assume the opposite.”
Simon’s revolutionary insights with regard to the mutually beneficial interaction between population growth and availability of natural resources are counterintuitive, but they are real. The world is a closed system in the way that a piano is a closed system. The instrument has only 88 notes, but those notes can be played in a nearly infinite variety of ways. The same applies to our planet. The Earth’s atoms may be fixed, but the possible combinations of those atoms are infinite. What matters, then, is not the physical limits of our planet, but human freedom to experiment and reimagine the use of resources that we have.
Appendix 1
To see what has been happening to world commodity prices, we looked at the World Bank’s commodity price data and the IMF primary commodity prices going back to 1980. Most commodities were tracked by both organizations, but a few commodities were tracked by only one or the other organization. The World Bank has been tracking data for a longer period of time and so, when both organizations tracked the same commodity, we relied on the World Bank data as our primary source. Overall, we ended up with 50 items. Forty-three came from the World Bank, and seven came from the IMF.
- We eliminated three crude oil data sets (Brent, Dubai, and West Texas Intermediate) because the data contained therein were already reflected in “Crude oil, average.”
- There were three categories for coal. Only Australian coal was tracked back to 1980, so we did not include the other two.
- There were four types of natural gas: United States, Europe, Japan, and an average. We dropped the average and included the three individual markets. We did so because the three markets are largely independent, and international prices of natural gas can vary considerably.82
- We created a single average for the prices of coffee (combining Arabica and Robusta).
- We retained just one measure of the price of tea, which is the average of the prices in Colombo, Kolkata, and Mombasa.
- We also combined coconut oil and copra (from which coconut oil is derived).
- We combined ground nuts and groundnut oil.
- We included palm oil, but not palm kernel oil, which was not tracked until 1996.
- We combined soybeans, soybean oil, and soybean meal into one category.
- “Rice, Thai 5 percent” had the most complete price history, and so we included it.
- Similarly, “Wheat, U.S. HRW” had the most complete price history, and so we used it.
- We eliminated “Banana, Europe” because it didn’t start until 1997.
- There were three sugar indexes, U.S., Europe, and World. We combined these into one average category.
- We combined Cameroon and Malaysian logs into an average category.
- We combined Cameroon and Malaysian sawn wood into an average as well.
- There were two rubber categories, but we eliminated Rubber, TSR20, because it has been tracked only since 1999.
- We combined diammonium phosphate, phosphate rock, triple superphosphate, urea, and potassium chloride into one price measure called “Fertilizer.”
- The two wool grades were combined into an average.
Gold and Silver
Our basket of commodities includes gold and silver. That’s not something that Simon would have been comfortable with. Simon was concerned with commodities that are used or consumed and for which relative scarcity is a concern. His analysis did not apply to commodities that moonlight as stores of value. One of us addressed that problem in a previous publication:
In addition to their commercial uses, such as serving as conductors of electricity in switches and cell phones, gold and silver are also stores of value or assets that can be saved, retrieved, and exchanged at a later time. Historically, people of all income groups used gold and silver to hide their wealth from rapacious government officials and in the time of war. More recently, both metals rose in price during the inflationary 1970s, when many of the world’s most important currencies, including the U.S. dollar, were rapidly losing their value because of monetary mismanagement. They spiked again after the outbreak of the Great Recession and the subsequent uncertainty about the soundness of the financial system.83
In the end, we have decided to keep gold and silver in our basket of commodities for the following reasons. First, prices of many commodities, not just gold and silver, do not perfectly reflect global supply and demand. “For many decades, the oil market was partly shielded from competitive forces by the Organization of Petroleum Exporting Countries (OPEC), a cartel of oil-producing countries. The OPEC nations frequently colluded to restrict production of oil in order to keep its price artificially high. The extent to which OPEC was able to achieve its goal in the past is subject to much debate, but many experts have come to believe that OPEC’s ability to affect the future price of oil is in decline.”84 Prices of other commodities, including sugar and corn, may be artificially inflated by tariffs and subsidies.
Second, our aim is to be completely transparent with regard to our methodology and to avoid the charge of cherry-picking. Since gold and silver constitute parts of the World Bank’s database of commodities, we decided to include them. That said, we hope that this section will remind the readers that the prices of gold and silver are subjected to influences that most other commodities are not subject to. Finally, gold and silver together represent a mere 4 percent of the weight in our basket of commodities. Researchers are free to build their own indexes and reduce the weight of gold and silver to zero if they like.
Table 3: Summary of findings
Source: Authors’ analysis.
Notes: Real prices = nominal prices ÷ GDP deflator; Time Price = real price ÷ real hourly income; Time Price Multiplier = 1 ÷ (1 + rate of change in time price); Price Elasticty of Population = percentage change in time price ÷ percentage change in population; Simon Abundance Index (SAI) = [(1 + percentage change in population) ÷ (1 + percentage change in time price)] x 100 base year 1980 = 100
NOTES
The authors wish to thank the following for their kind help with this paper: Mark Perry, University of Michigan–Flint; Jeffrey Miron, Andrei Illarionov, Peter Van Doren, Chelsea Follett, Ian Vásquez, and Tyler Sutton, Cato Institute; David M. Simon, Eimer Stahl LLP; Daniel Simon, Indiana University; and Pierre Desrochers, University of Toronto Mississauga.
1 Daniel Richter et al., “The Age of the Hominin Fossils from Jebel Irhoud, Morocco, and the Origins of the Middle Stone Age,” Nature 546, no. 7657 (2017): 293–96, https://www.nature.com/articles/nature22335.
2 “Mass Production,” The Economist, October 20, 2009, https://www.economist.com/node/14299820.
3 Max Roser, “Life Expectancy,” Our World in Data, https://ourworldindata.org/life-expectancy.
4 These figures are in 1990 U.S. dollars adjusted for purchasing power parity (PPP). Note that in our analysis we do not use figures adjusted for PPP. That’s because we look at global prices of commodities, which theoretically reflect the influences of all local conditions. A Big Mac costs much less in Ukraine, where labor and other inputs are cheaper, than in Switzerland, where labor and other inputs are more expensive. But the price of imported zinc will be very similar in both countries. For income data, see Jutta Bolt, Marcel Timmer, and Jan Luiten van Zanden, “GDP per Capita since 1820,” in How Was Life? Global Well-Being since 1820, ed. Jan Luiten van Zanden, et al. (Paris: OECD Publishing, 2014), http://dx.doi.org/10.1787/9789264214262-7-en.
5 We do not have a global homicide rate going back to the 1800s, but consider the following examples. In 1800, homicide rates in Italy, Switzerland, and Germany were 8.0, 4.7, and 2.4 per 100,000, respectively. By the early 2000s, those rates fell to 2.30, 0.60 and 0.58, respectively. See Max Roser, “Homicides,” https://ourworldindata.org/homicides.
6 Max Roser, “War and Peace,” data visualization, Our World in Data, https://ourworldindata.org/wp-content/uploads/2013/08/Wars-Long-Run-military-civilian-fatalities-from-Brecke.png.
7 Max Roser and Esteban Ortiz-Ospina, “World Population Growth,” updated April 2017, https://ourworldindata.org/world-population-growth.
8Adam Smith, An Inquiry into the Nature and Causes of the Wealth of Nations, vol. 1 (Indianapolis: Liberty Fund, 1981), p. 13.
9 The Nobel Prize–winning economist Angus Deaton argues that population growth preceded the Great Enrichment of the last two centuries because of “the control of disease through public health measures. At first this took the form of improvements in sanitation and in water supplies. Eventually the science caught up with practice and the germ theory of disease was understood and gradually implemented, through more focused, scientifically based measures. These included routine vaccination against a range of diseases and the adoption of good practices of personal and public health based on the germ theory.” See Angus Deaton, The Great Escape: Health, Wealth, and the Origins of Inequality (Princeton: Princeton University Press, 2013), p. 93.
10 Julian L. Simon, The Ultimate Resource (Princeton: Princeton University Press, 1981). Note that until 1983, Simon was economics and business professor at the University of Illinois at Urbana–Champaign. He moved to the University of Maryland two years after publishing The Ultimate Resource.
11 New ideas are the result of the combination of existing ideas or, as the British writer Matt Ridley put it, “ideas have sex.” The more ideas people have, the more ideas they can have. See Matt Ridley, The Rational Optimist (New York: HarperCollins, 2010).
12 Paul Ehrlich, The Population Bomb (New York: Ballantine Books, 1968), p. 11.
13 Julian L. Simon, The Ultimate Resource, pp. 345, 346, 348.
14 Garrett Hardin, “The Tragedy of the Commons,” Journal of Natural Resources Policy Research 1, no. 3 (2009): 243–53; and Jared Diamond, Guns, Germs, and Steel (New York: W. W. Norton, 1997); Jared Diamond, Collapse: How Societies Choose to Fail or to Succeed (New York: Viking Press, 2005). For a discussion of the intellectual origins of Hardin’s thinking, see Fabien Locher, “Cold War Pastures: Garrett Hardin and the ‘Tragedy of the Commons,’” Revue d’Histoire Moderne et Contemporaine 60, no. 1 (2013): 7–36, https://www.cairn-int.info/article-E_RHMC_601_0007--cold-war-pastures-garrett-hardin-and.htm.
15 The full quote is this: “Most biologists and ecologists look at population growth in terms of the carrying capacity of natural systems. Julian [Simon] was not handicapped by being either. As an economist, he could see population growth in a much more optimistic light.” See “Julian Simon, 65, Optimistic Economist, Dies,” New York Times, February 12, 1998, https://www.nytimes.com/1998/02/12/business/julian-simon-65-optimistic-economist-dies.html.
16 Lester R. Brown, in “Julian Simon, 65, Optimistic Economist, Dies.”
17 Ridley continues, “I am not talking about swapping favors—any old primate can do that. There is plenty of ‘reciprocity’ in monkeys and apes: you scratch my back and I scratch yours. . . . Such reciprocity is an important human social glue, a source of cooperation and a habit inherited from the animal past that undoubtedly prepared human beings for exchange. But it is not the same thing as exchange. Reciprocity means giving each other the same thing (usually) at different times. Exchange—call it barter or trade if you like—means giving each other different things (usually) at the same time: simultaneously swapping two different objects.” Matt Ridley, The Rational Optimist (New York: HarperCollins, 2010), pp. 56–57.
18 Ronald Bailey, The End of Doom (New York: St. Martin’s Press, 2015), p. 45.
19 Paul Sabin, The Bet: Paul Ehrlich, Julian Simon, and Our Gamble over Earth’s Future (New Haven, CT: Yale University Press, 2013).
20 For a more detailed history of “the bet” and its consequences, see Pierre Desrochers and Vincent Geloso, “Snatching the Wrong Conclusions from the Jaws of Defeat: A Resourceship Perspective on Paul Sabin’s The Bet: Paul Ehrlich, Julian Simon, and Our Gamble over Earth’s Future, Part 1: The Missing History of Thought: Depletionism vs. Resourceship,” New Perspectives on Political Economy 12, nos. 1-2 (2016): 5–41 and “Part 2: The Wager: Protagonists and Lessons,” pp. 42–64.
21 Michael Cox and Richard Alm, “Onward and Upward! Bet on Capitalism—It Works,” 2015-16 Annual Report of the William J. O’Neil Center for Global Markets and Freedom, Southern Methodist University Cox School of Business, https://www.smu.edu/-/media/Site/Cox/CentersAndInstitutes/ONeilCenter/Research/AnnualReports/2016_annual_report_full.ashx?la=en.
22 Adam Smith, An Inquiry into the Nature and Causes of the Wealth of Nations (London: W. Strahan and T. Cadell, 1776), book 1, chap. 5, http://geolib.com/smith.adam/won1-05.html.
23 Cox and Alms, “Onward and Upward!,” p. 8.
24 Steven Pinker, Enlightenment Now: The Case for Reason, Science, Humanism, and Progress (New York: Viking Press, 2018), p. 48.
25 Leda Cosmides and John Tooby, “Evolutionary Psychology: A Primer,” Center for Evolutionary Psychology, 1997, https://www.cep.ucsb.edu/primer.html.
26 It is noteworthy that very few pessimists are willing to put their skin in the game and bet against progress. Even Ehrlich, who has been repeating the same message of doom and gloom for the past 50 years, has never again engaged in a wager similar to that which he lost.
27 Paul R. Ehrlich and Anne H. Ehrlich, “Can a Collapse of Global Civilization Be Avoided?” Proceedings of the Royal Society B 280 (January 9, 2013): https://doi.org/10.1098/rspb.2012.2845, http://rspb.royalsocietypublishing.org/content/280/1754/20122845.
28 Paul R. Ehrlich, “Biological Extinction,” https://www.youtube.com/watch?v=1j7TpoLmR60.
29 United Nations Department of Economic and Social Affairs, The Determinants and Consequences of Population Trends: New Summary of Findings on Interaction of Demographic, Economic and Social Factors (New York: United Nations, 1973), p. 33.
30 United Nations, The Determinants and Consequences of Population Trends, p. 34.
31 Thomas R. Malthus, An Essay on the Principle of Population (London: J. Johnson, 1798).
32 “About Us,” Club of Rome, https://www.clubofrome.org/.
33 Donella H. Meadows, Dennis L. Meadows, Jørgen Randers, and William W. Behrens III, The Limits to Growth: A Report for the Club of Rome’s Project on the Predicament of Mankind (Washington: Potomac Associates, 1972) via Donella Meadows Collection, Dartmouth Digital Collections, http://collections.dartmouth.edu/teitexts/meadows/diplomatic/meadows_ltg-diplomatic.html.
34 Ernst von Weizsäcker and Anders Wijkman, Come On! Capitalism, Short-Termism, Population and the Destruction of the Planet (New York: Springer, 2017).
35 Alan Flippen and Damon Darlin, “Forty-Four Years of Earth Day,” The Upshot (blog), New York Times, April 22, 2014, https://www.nytimes.com/2014/04/23/upshot/forty-four-years-of-earth-day.html.
36 John McConnell, Earth Day (Eugene, OR: Wipf and Stock, 2011).
37 Simon, The Ultimate Resource, p. 346.
38 Paul Krugman, “Rare and Foolish,” New York Times, October 17, 2010, https://www.nytimes.com/2010/10/18/opinion/18krugman.html.
39 Eugene Gholz, “Rare Earth Elements and National Security,” Council on Foreign Relations energy report, October 1, 2014, https://www.jstor.org/stable/resrep00311, p. 6.
40 Gholz, “Rare Earth Elements and National Security.”
41 A. J. Willingham, “Mud Near This Small Japanese Island Could Change the Global Economy,” CNN, April 17, 2018, https://www.cnn.com/2018/04/16/asia/japan-rare-earth-metals-find-china-economy-trnd/index.html.
42 The numbers provided presume that the current usage rates of rare earths continue for centuries to come. If humanity learns how to use rare earths more efficiently, the currently known reserves of rare earths will last even longer.
43 Marian L. Tupy, “Man’s Ingenuity Is Quenching the World’s Thirst,” CapX, June 8, 2017, https://capx.co/mans-ingenuity-is-quenching-the-worlds-thirst/.
44 Rowan Jacobsen, “Israel Proves the Desalination Era Is Here: One of the Driest Countries on Earth Now Makes More Freshwater than It Needs,” Scientific American, July 29, 2016, https://www.scientificamerican.com/article/israel-proves-the-desalination-era-is-here/.
45 Paul Romer, “Economic Growth,” PaulRomer.Net, October 12, 2015, https://paulromer.net/economic-growth/.
46 “Commodity Price Data,” World Bank, http://www.worldbank.org/en/research/commodity-markets; International Monetary Fund, http://www.imf.org/external/np/res/commod/External_Data.xls.
47 “Gross Domestic Product: Implicit Price Deflator,” FRED Economic Data, https://fred.stlouisfed.org/series/GDPDEF#0.
48 The World Bank’s “GDP per Capita in Current U.S. Dollars” data span the period between 1960 and 2016. We have imputed the 2017 value by computing the average rate of income appreciation between 1960 and 2016, which came to 3 percent. We added 3 percent to the 2016 figure of $10,192.
49 “GDP per Capita (current US$),” World Bank, https://data.worldbank.org/indicator/NY.GDP.PCAP.CD.
50 “Total Economy Database: Annual Hours Worked per Worker,” The Conference Board, https://www.conference-board.org/data/economydatabase/.
51 The “Annual Hours Worked per Worker” dataset from The Conference Board covers 70 percent of the world’s population. We consider that to be a sufficient share of the world’s population to imply a global population–adjusted average annual hours worked per worker decline of 9.4 percent.
52 The relevant calculation for 1980 is GDP per capita of $6,431 ÷ 2,168 hours worked = $2.97 income per hour. The relevant calculation for 2017 is GDP per capita of $10,495 ÷ 1,964 hours worked = $5.34 income per hour. (All figures are in 2017 dollars.)
53 The relevant equation here is
TP = [(1+ percentage change in price) ÷ (1 + the percentage change in income)] − 1
TP = [1.10 ÷ 1.20] − 1
TP = 0.917 – 1
TP = −0.083 or −8.3 percent
54 The relevant equation here is
TP = [(1+ percentage change in price) ÷ (1 + the percentage change in income)] − 1
TP = [(1 − 0.363) ÷ (1 + 0.801)] − 1
TP = [0.637 ÷ 1.801] − 1
TP = 0.353 − 1
TP = −0.647 or −64.7 percent
55 The relevant equation here is
TPM = 1 ÷ (1 + percentage change in time-price)
TPM = 1 ÷ (1 + (−0.50))
TPM = 1 ÷ 0.5
TPM = 2
56 The relevant equation here is
TPM = 1 ÷ (1 + change in time-price)
TPM = 1 ÷ (1 + (−0.647))
TPM = 1 ÷ 0.353
TPM = 2.83
57 Price elasticity of a product (P) = percentage change in the quantity of P purchased ÷ percentage change in price of P sold; price elasticity of P = (−25 percent ÷ 50 percent); price elasticity of P = −0.5.
58 The relevant equation here is: PEP = percentage change in time-price ÷ percentage change in population.
59 “World Population Prospects, 2017,” United Nations Department of Economic and Social Affairs, https://esa.un.org/unpd/wpp/Download/Standard/Population/.
60 The relevant equation here is
PEP = percentage change in time-price ÷ percentage change in population
PEP = -64.7 ÷ 69.3
PEP = -0.934
61 Note that price elasticity of population is unlikely to be constant. The nearly direct link between population and time-price generated between 1980 and 2017 might not hold over the course of the next 37 years. For more discussion on this subject, see the “Forecasts” section of this paper.
62 Paul R. Ehrlich and Anne H. Ehrlich, The End of Affluence: A Blueprint for Your Future (New York: Ballantine Books, 1974), p. 33.
63 Paul R. Ehrlich et al., “No Middle Way on the Environment,” Atlantic Monthly 280, no. 6 (December 1997): 98–104, https://www.theatlantic.com/magazine/archive/1997/12/ehrlich/377016/.
64 “Scarcity,” Economics Online, http://www.economicsonline.co.uk/Definitions/Scarcity.html.
65 Peter H. Diamandis and Steven Kotler, Abundance: The Future Is Better Than You Think (New York: Free Press, 2014 ed.), p. 9.
66 Note that the PEP denominator will always be positive. That’s because we expect population to keep growing for the foreseeable future. The PEP does not deal with scenarios in which population remains constant or is declining. That’s consonant with the Simon–Ehrlich debate, since both scholars were concerned with the effect of population growth on the availability of resources.
67 The relevant equation here is
NLE = [1 ÷ (1 + percentage change in population)] − 1
NLE = [1 ÷ (1 + 0.50)] − 1
NLE = [1 ÷ 1.5] − 1
NLE = 0.66 − 1
NLE = −0.33 or −33 percent
68 The relevant equation here is
NLE = [1 ÷ (1 + percentage change in population)] − 1
NLE = [1 ÷ (1 + 0.693)] − 1
NLE = [1 ÷ 1.693] − 1
NLE = 0.59 − 1
NLE = −0.41 or −41 percent
69 To better understand this section, consider watching this video prepared by Gale Pooley: https://www.youtube.com/watch?v=OPWU4YF6RvI&feature=youtu.be.
70 The relevant equation is
SAI = [(1 + percentage change in population) ÷ (1 + percentage change in time-price)] × 100
SAI = [(1 + 0.693) ÷ (1 − 0.647)] × 100
SAI = [1.693 ÷ 0.353] × 100
SAI = 4.796 × 100
SAI = 479.6
71 Much of the contemporary discussion in academia and the popular press centers on the subject of income inequality. In this paper, we did not adjust our figures to indicate different resource availability for people of different income levels. That said, it is worth remembering that the Simon Index is composed of basic commodities, not yachts or Lamborghinis. The poor benefit most when basic commodities, including food, fall in price. Hundreds of millions of people, especially those in the developing world whose incomes remain relatively low, are escaping from absolute poverty because time-prices of commodities are getting cheaper. Other researchers might wish to examine spending patterns to determine the welfare implications of the falling time-price of commodities for different income groups.
72 See the section, “Ehrlich and Simon: A Clash of Visions.”
73 Quoted in Ed Regis, “The Doomslayer,” Wired, February 1, 1997, https://www.wired.com/1997/02/the-doomslayer-2/. Emphasis in original.
74 Ronald Bailey, “High School Students Are Very Worried about Overpopulation. They Shouldn’t Be,” Hit and Run (blog), Reason, January 18, 2018.
75 “World Population Prospects, 2017,” United Nations Department of Economic and Social Affairs, https://esa.un.org/unpd/wpp/Download/Standard/Population/.
76 The standard deviation was 5.71 and the standard error was 0.939. Assuming a normal distribution, the chance that the PEP average will exceed 1 (i.e., scarcity) is 2.69 standard deviations away from the mean. The probably of that occurring is 0.00355 percent.
77 Note that the PEP value for 1980–2017, which comes to -0.934, differs somewhat from the yearly average of -1.53. As such, our forecast of -0.90 errs on the side of caution.
78 A potential concern with our forecast is that innovation could, as Paul Romer put it, “peter out.” As humanity develops more ideas, finding enough good new ones to maintain the current level of productivity growth may require increasingly costly investments in human capital. Researchers may have to command a greater body of literature and solve increasingly difficult problems. Under this scenario, the cost of accumulating enough human capital to balance population growth with higher productivity may eventually become prohibitive, the PEP could move toward a positive value, and population growth could indeed presage decreasing abundance. Note that Romer does not endorse the “petering out” argument but merely gives that concept a useful name. Like Romer, we believe that, when it comes to innovation, there are reasons for optimism. As Peter Diamandis and Steven Kotler put it in their 2012 book Abundance: The Future Is Better Than You Think, “the advancement of new, transformational technologies—computational systems, networks and sensors, artificial intelligence, robotics, biotechnology, bioinformatics, 3-D printing, nanotechnology, human-machine interfaces, and biomedical engineering—will soon enable the vast majority of humanity to experience what only the affluent have access to today.” See Paul Romer, “Endogenous Technological Change,” Journal of Political Economy, 98, no. 5, pt. 2 (1990): S71–S102; and Diamandis and Kotler, Abundance: The Future Is Better Than You Think, p. 10.
79 Mauricio Lima, “Climate Change and the Population Collapse during the ‘Great Famine’ in Pre-industrial Europe,” Ecology and Evolution 4, no. 3 (February 2014): 284–91, https://onlinelibrary.wiley.com/doi/abs/10.1002/ece3.936.
80 Jonah Goldberg, Suicide of the West: How the Rebirth of Tribalism, Populism, Nationalism, and Identity Politics Is Destroying American Democracy (New York: Random House, 2018). The quote comes from Goldberg’s essay adapted from the book in National Review, April 12, 2018, https://www.nationalreview.com/magazine/2018/04/30/jonah-goldberg-suicide-of-the-west-excerpt/.
81 See Pinker, Enlightenment Now.
82 “Natural Gas Prices,” BP website, https://www.bp.com/en/global/corporate/energy-economics/statistical-review-of-world-energy/natural-gas/natural-gas-prices.html.
83 Marian L. Tupy, “Julian Simon Was Right: A Half-Century of Population Growth, Increasing Prosperity, and Falling Commodity Prices,” Cato Institute Economic Development Bulletin no. 29, February 16, 2018, p. 7, https://www.cato.org/publications/economic-development-bulletin/julian-simon-was-right-half-century-population-growth.
84 Tupy, “Julian Simon Was Right,” p. 7.

About the Authors


This work is licensed under a Creative Commons Attribution-NonCommercial-ShareAlike 4.0 International License.