The potential benefits of increased access to private school choice programs in the United States remain a hot topic in educational policy. According to economic theory, private schooling should improve student achievement by increasing competitive pressures on educators to provide high-quality educational experiences. In addition, since children have differing interests, abilities, and learning styles, private school choice would allow for an improved match between educators and students.
To see if these market benefits materialize, I examine the effect that increased access to private schooling has on international student test scores in 52 countries around the world. Notably, this study establishes causal relationships by comparing these countries to themselves over time while controlling for any fluctuations in gross domestic product, government expenditures, population, school enrollment, life expectancy, and infant mortality. I find that a 1 percentage point increase in the private share of total primary schooling enrollment would lead to moderate increases in student math, reading, and science achievement within nations.
Since the inception of common schooling around the globe, public-education advocates have argued that voluntary schooling selections — that is, school choice programs — would damage democratic societies by reducing the quality of education. They contend that if we allow parents and guardians to select the educational environment for their children, they may negatively affect the entire society by failing to choose academically rigorous institutions, among other problems. After all, since not all parents are education experts, they may not have the capacity to select schools based on academic quality. Further, self-interested parents may choose schools based on location and extracurricular activities rather than academics. With the rise of private school choice programs across the United States and a growing clamor for broad federal school choice, these claims are being repeated by school-choice opponents with growing volume and frequency.
There is, however, good reason to believe that education grounded in rationally self-interested decisions can benefit all of society through a better-educated citizenry. Because the freedom to choose a child’s school reduces the monopoly power exercised by public schooling, we should expect expanded school choice to result in better educational quality and lower school cost. Since families care about the cognitive outcomes of their children, they will select schools based on academic quality. Moreover, if parents have the freedom to select their children’s schools, they will have a stronger interest in becoming more informed about the quality of various educational options.
The most methodologically rigorous studies on private school choice programs take advantage of random lotteries used to decide which children get access to oversubscribed — that is, overenrolled — programs. An experimental setting exists because, with the lotteries, it is merely random chance that determines who wins the school voucher. As a result, any difference in outcome between the control and treatment groups can be directly attributed to the private school choice program in question.
The three most recent experimental evaluations of private school choice programs have found that winning a lottery to attend a private school in Louisiana and Washington, D.C., resulted in lower standardized test scores in initial years.1 Critics of school choice have seized on these studies to argue that these programs actually harm the students they are intended to help.2 However, these are just the latest in a larger empirical literature on the effects of school choice. The full collection of 20 experimental evaluations indicates that private school choice programs increase student achievement, but only slightly.3 This literature also indicates that private school choice programs improve essential individual and societal outcomes, including saving taxpayer money,4 reducing criminal activity,5 and improving graduation rates.6
Notably, only 4 of the 20 experimental evaluations of private school voucher programs on student achievement were conducted outside the United States. These took place in Bogota, Colombia; Andhra Pradesh, India; and Delhi, India, and found an average effect of about a half of a standard deviation increase in reading scores and about a third of a standard deviation increase in math for students who won and used vouchers to attend private schools.7 These effects are quite large; according to the conversion of standard deviations to annual learning gains used by the Center for Research on Education Outcomes (CREDO) at Stanford University, these effects are equivalent to more than a two-grade improvement in math and reading over public schools.8 Of course, these four experiments are not representative of the rest of the world, so we should be careful about assuming such private school effects would be replicated across the globe. In addition, James Tooley and Pauline Dixon found that access to private schooling benefited the least advantaged children around the world, while M. Najeeb Shafiq and John P. Myers found that private school vouchers in Sweden increased such outcomes as students’ reported tolerance of other ethnic and immigrant groups.9
Few existing studies attempt to determine the effect of private schooling on student test scores around the world. Aldo S. D’Agostino examined the private share of school enrollment in 30 countries in 2012 but did not find a statistically significant effect on Programme for International Student Assessment (PISA) scores.10 This is a standardized assessment, coordinated by the Organisation for Economic Co-operation and Development (OECD) that examines academic abilities of 15-year-old children around the world. The assessment is scaled to have a mean of 500 and a standard deviation of 100. Chris Sakellariou examined schooling in 40 countries in 2012 and found that public schools outperformed private school on PISA scores.11 However, since these studies all used cross-country comparisons, they cannot be interpreted as causal. Martin R. West and Ludger Woessmann used PISA data from 29 countries in 2003 and found that students in private schools had much higher standardized test scores.12 More recently, Gabriel Heller-Sahlgren found that private schooling had similarly large positive effects on PISA scores for students from 34 different countries in 2012.13
Importantly, the studies by West and Woessmann and Heller-Sahlgren used the share of each country’s Catholic population in the year 1900 as an instrumental variable to predict the likelihood that a given student was in a private school in 2003 or 2012. Since the historic Catholic share of the population is highly correlated with whether a student ends up in a private school today, and is unrelated to the student’s test score today, they argue, their papers identify a causal relationship between private schooling and higher student achievement. I contend that this approach does not fully remove bias from their estimates, as the historic Catholic share of the population is correlated with omitted variables such as national culture, political structure, economic structure, and racial diversity.
In order to remove the problem of comparing students in different countries to one another when probing the effects of school choice, I use data from 52 countries from the years 2000 to 2012 to compare nations to themselves. Previously, I have also employed an instrumental variable (short-run fluctuations in the demand for schooling) to predict the share of private schooling within a given country and year as a robustness check.14 A valid instrument removes any potential bias because it is a random variable that affects only the outcome of interest — PISA scores — through its influence on the explanatory variable of interest — the private share of schooling enrollment.
Theory
I expect that an increase in the private share of schooling within countries would improve student achievement through competitive pressures and an improved match between educators and students.
Because public schools are able to force their customers to pay for their educational products through taxation, they hold monopoly power and, as a result, do not face strong pressures to be accountable to families.15 Of course, this is not because public-school leaders are malevolent or incompetent; they likely care a great deal about families, children, and the rest of society. But these leaders do not have strong economic incentives to provide a high-quality service at the lowest possible price. The most powerful incentives for leaders are to maximize political capital and budgets rather than quality levels.16 If public officials are making efficient spending decisions, they will likely be financially punished the following year for spending less than the budgeted amount. If, on the other hand, they spend the maximum amount budgeted, they will be more likely to receive additional funding the next year, and they will be able to tell their constituents that they directed large amounts of taxpayer money toward them. And political capital trumps quality because it is political actors — not the families that the schools are supposed to serve — who make the decisions about where money goes and how it is used.
Traditional public schools also hold exorbitant monopoly power through government-mandated assignment based on neighborhood. Imagine if you were residentially assigned to another service: restaurants. If you paid for the public restaurant, whether you decided to eat there or not, you would have a large incentive to go, almost regardless of its quality level. The only way you would exit and eat at a private restaurant would be if the perceived benefit of additional quality were greater than the sum of the price of food in the private restaurant and the value of the food at the public establishment.17 The public restaurants would not need to provide high-quality meals; instead, they would only need to be accountable to the state for maintaining minimum levels of taste and safety. Indeed, it would be irrational to provide a service above the minimum specified amount, especially since the public institutions would not be able to receive additional funding for providing great food and service. Similarly, if the government were to give away automobiles valued at $15,000 for “free,” it would be very difficult to sell someone a slightly higher quality car for a price of $15,000, regardless of vehicle choice, especially if the individual paid for the government car indirectly through taxation.
Alternatively, if more children within a nation are in private schools that face pressures to avoid financial losses and possible shutdown — and to perhaps even make a profit — educational quality levels will increase while costs will diminish. If perceived quality levels do not consistently surpass the costs of production, private institutions are forced to close. In addition, increases in private schooling within a country would increase the incentives for both private and public schools to provide high-quality educational experiences, assuming public schools faced some negative consequences, such as losing funds, for students who left. Moreover, private schooling would introduce price differentiation into the market for schooling. Price differentiation could entice new, high-quality schools to enter the educational market and could communicate information regarding student and parent values, goals, and desires.
If families were able to select their educational products, educational quality levels could increase simply because of the improved match between educators and students. Since all children are unique, they require different educational experiences. If students are better matched to educational institutions based on ability levels, interests, and learning styles, they will gain more knowledge and skills from schooling attendance.18 In theory, since access to private schooling ought to improve student learning, an increase in private schooling should lead to an increase in PISA scores.
Data and Methods
To conduct this research, I use country-level data for the five years between 2000 and 2012, in which PISA testing was conducted. I use PISA test-score data for 52 countries, which are publicly available online at the National Center for Education Statistics.19 For the independent variable of interest — the private share of total primary schooling enrollment — I employ data from the World Bank20 and the United Nations Data Retrieval System.21 I also use the World Bank for country-level data on gross domestic product (GDP), population, life expectancy, infant mortality, and total schooling enrollment. The final sample consists of 214 country-year observations for math and science and 212 country-year observations for reading. Of course, since this sample consists only of about 27 percent of the 195 countries around the world, it is not globally representative. The analytic sample of 52 countries represents 31 of the 44 countries (70 percent) in Europe; 3 of the 23 countries (13 percent) in North America; 6 of the 12 countries (50 percent) in South America; 2 of the 14 countries (14 percent) in Oceania; 9 of the 48 countries (19 percent) in Asia; and 1 of the 54 countries (2 percent) in Africa.
Table 1: Descriptive statistics
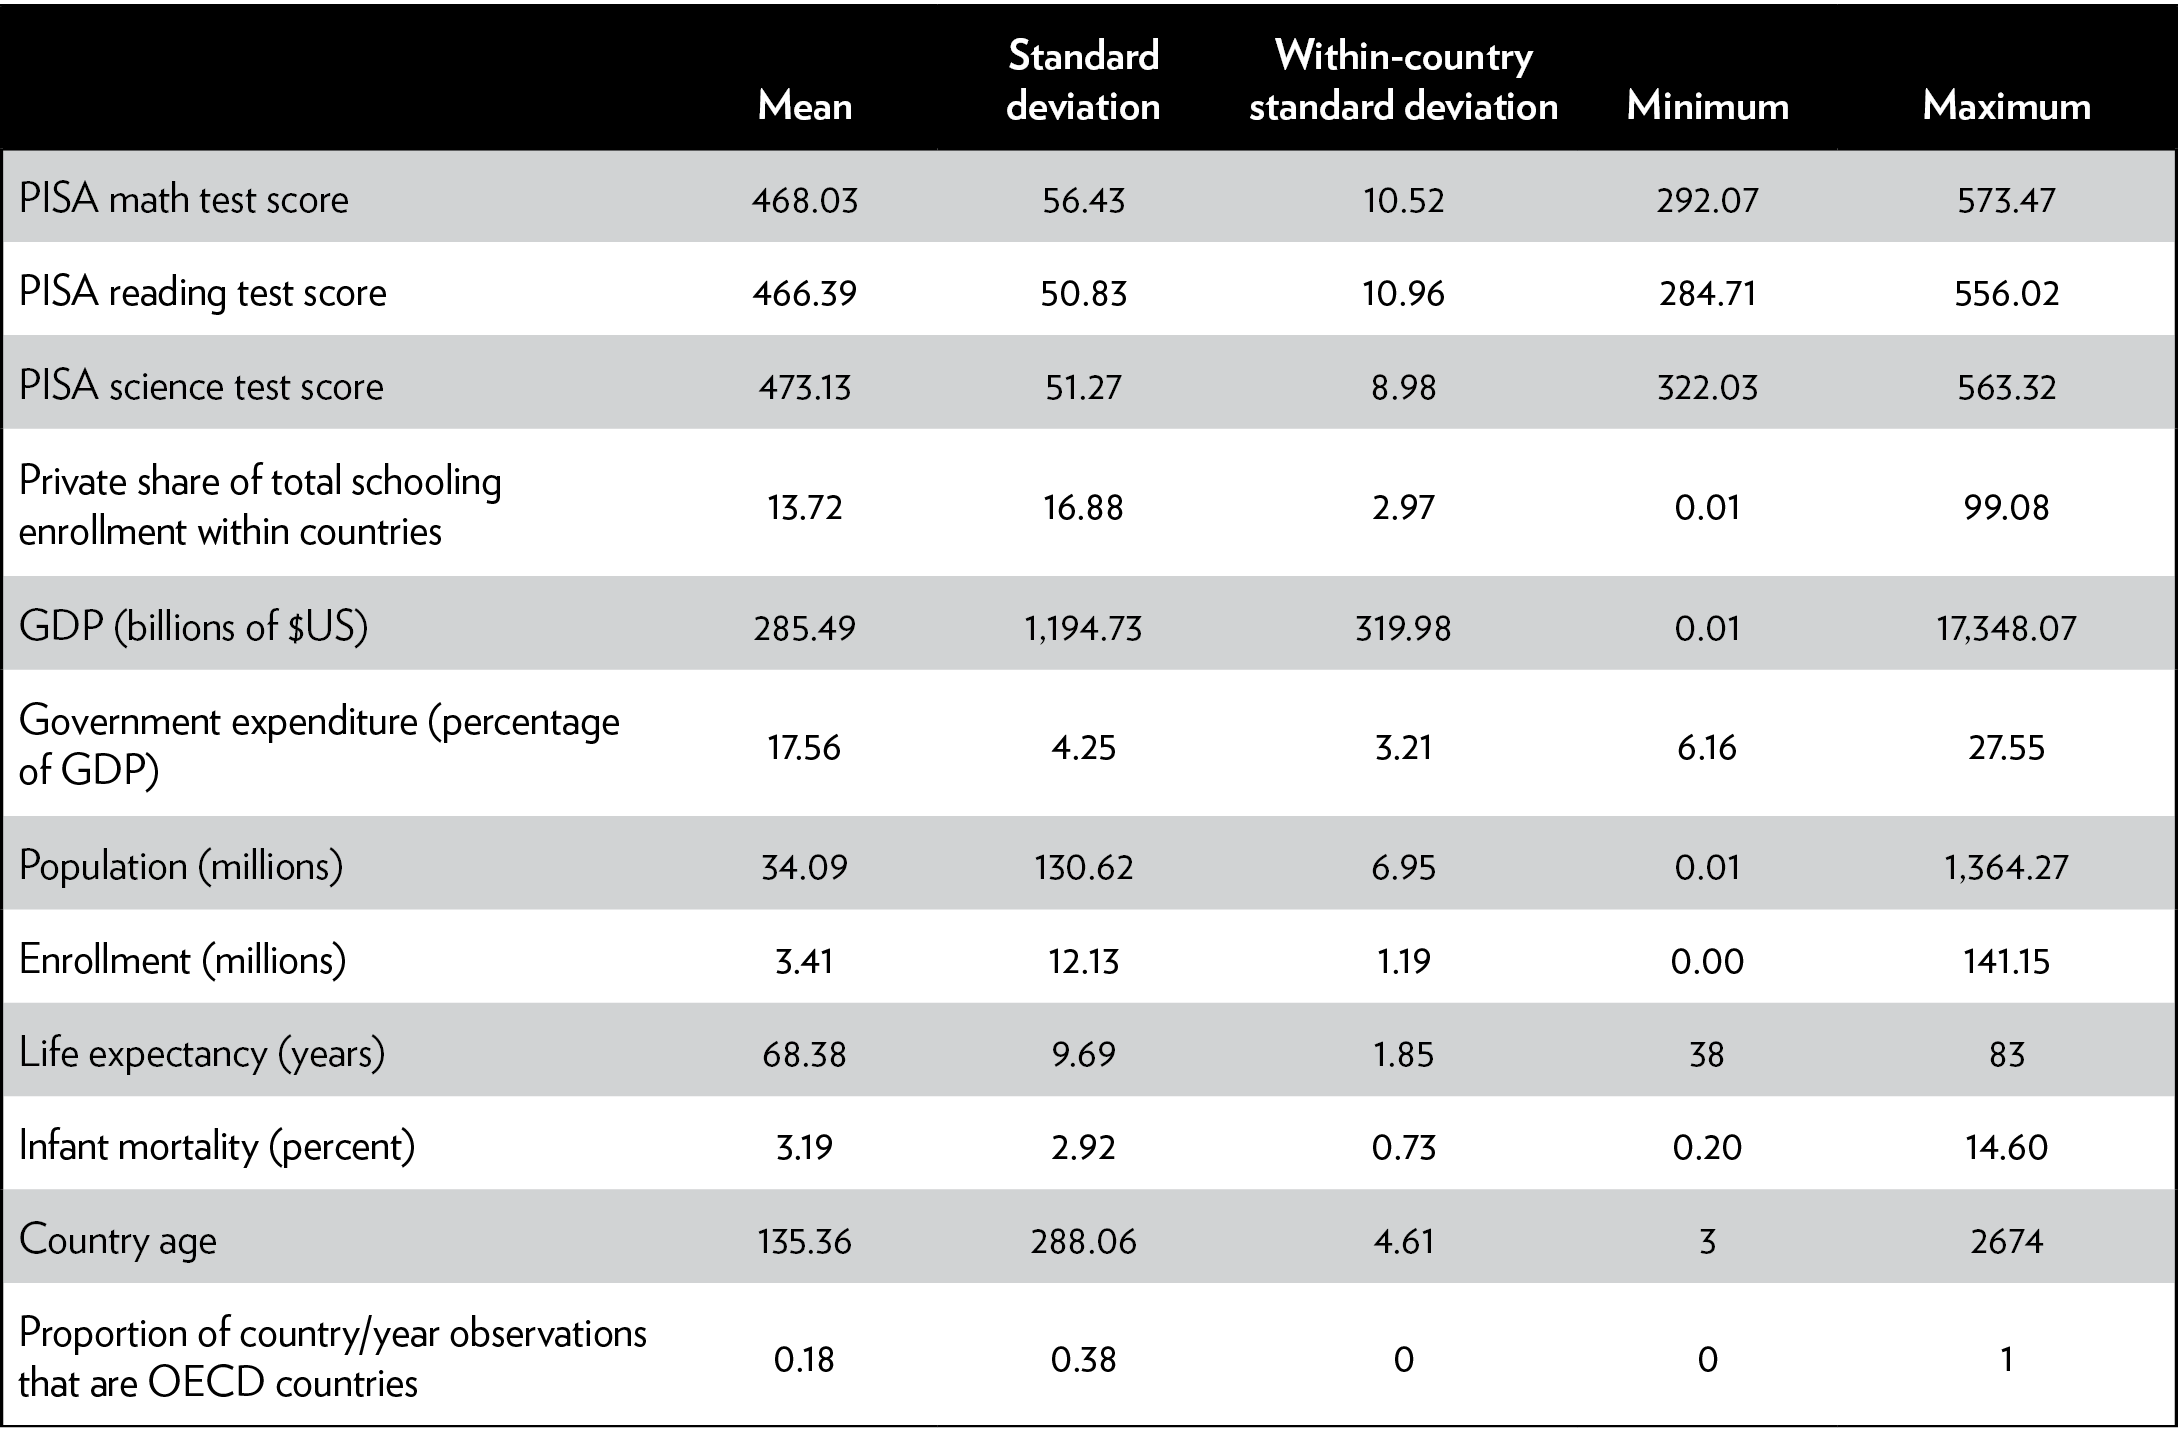
Sources: National Center for Education Statistics, “International Data Explorer,” https://nces.ed.gov/surveys/pisa/idepisa/; World Bank and UNESCO Institute for Statistics, “Percentage of Enrolment in Primary Education in Private Institutions,” http://data.worldbank.org/indicator/SE.PRM.PRIV.ZS; UN Data, UIS Data Centre, “Private Enrolment as Percentage of Total Enrolment. Primary Education,” http://data.un.org/Data.aspx?d=UNESCO&f=series%3aPRP_1. World Bank, “World Bank Open Data,” https://data.worldbank.org/.
Note: PISA = Programme for International Student Assessment.
The PISA assessment has been conducted by the OECD every three years since it began in 2000, with the most recent exam completed in 2015. The number of participating countries went from 32 in 2000 to 70 in 2015. The nationally representative exam is given to 15-year-olds in order to compare student achievement around the world. The most recent assessment included math, reading, science, problem solving, and financial literacy. In this study, I focus on math, reading, and science results.
The OECD requires that each nation test at least 4,500 students from at least 150 different schools. In order for data to be captured, the national response rate must be greater than 64 percent of the original sample of schools; the school-level response rates must be greater than 79 percent of the sampled children; and the testing timeframe may not exceed 42 days. Because of the strict OECD procedures, we can be confident that the data from each country are nationally representative and that resulting analyses are free from sampling bias.
Most important, I am able to compare countries to themselves over time because I have access to five years of data. The initial analysis examines the effect that a 1 percentage point increase in the private share of primary schooling has on PISA scores within countries. Since I can compare countries to themselves, I can control for factors that remain relatively constant, such as national culture, religion, and racial diversity.22 This approach is a strong improvement to previous studies that compare very different countries to each other at one point in time. Instead of pointing out that countries with more or less private schooling have different test scores, this study is able to illustrate the effects of private schooling on test scores within the same country. This method is also a substantial improvement because by exploiting within-country variations it addresses the concern that the definition of private schooling differs across locations.
Obviously, other factors besides the private share of total primary schooling can change within countries. If other factors change within countries, and these variables are simultaneously associated with changes in the share of private schooling and PISA scores, the initial method may produce biased estimates. For instance, if GDP increases within a nation, higher incomes may lead to more families having the ability to afford private schooling. Additionally, higher incomes may lead to more access to educational resources, resulting in higher PISA achievement. Similarly, if population largely increases within a country, public share of schooling would likely increase, while PISA scores might decline as a result of reduced educational resources per child. In theory, an analysis failing to hold GDP and population constant could produce results that are biased upward in magnitude. Because of this potential bias, I include the preferred model that examines the effects of changes in the share of private schooling on PISA scores within countries after holding GDP, population, life expectancy, infant mortality, government expenditures, and total schooling enrollment constant. See the appendix for more details on the econometric methods employed. Table 1 shows descriptive statistics of the data used in the analyses.
Results
Table 2 and Figure 1 indicate that increases in the private share of schooling within countries lead to increases in PISA math, reading, and science achievements. In particular, a 1 percentage point increase in the private share of schooling enrollment within a country is associated with a 2.5-point increase in math scale scores, a 1.5-point increase in reading scale scores, and a 1.3-point increase in science scale scores.
Importantly, I compare countries to themselves over time in order to estimate the effects of private schooling on student test scores. This way, I can avoid almost all of the bias introduced in other studies that simply attempt to compare differences across countries. However, this initial model assumes that changes in other factors within countries, such as population, do not affect student achievement — or, if they do, that those factors are relatively constant.
In theory, many factors that change within countries can affect PISA scores, so it may be important that those variables are held constant. For example, an increase in GDP within a country can increase the number of children that may be able to afford private schools, while simultaneously increasing students’ test scores. If this is the case, the effects detected in the first model would be biased upward. In order to eliminate potential bias, I examine the effects of changes in the private share of schooling while holding GDP, government expenditures, population, life expectancy, infant mortality, and total schooling enrollment constant.
Table 3 and Figure 2 show that even with these controls, increases in private schooling within countries result in higher math, reading, and science PISA scores. Specifically, a 1 percentage point increase in private schooling would improve math scores by 1.4 scale points, reading scores by 1 scale point, and science scores by 0.9 scale points. These results are smaller and less statistically significant than those detected in the previous model; however, these results for math and reading remain statistically significant. This is especially notable because the sample used in the analysis is small relative to most social science research today.
Table 2: The effect of 1 percentage point increase in private schooling on Programme for International Student Assessment (PISA) scale scores
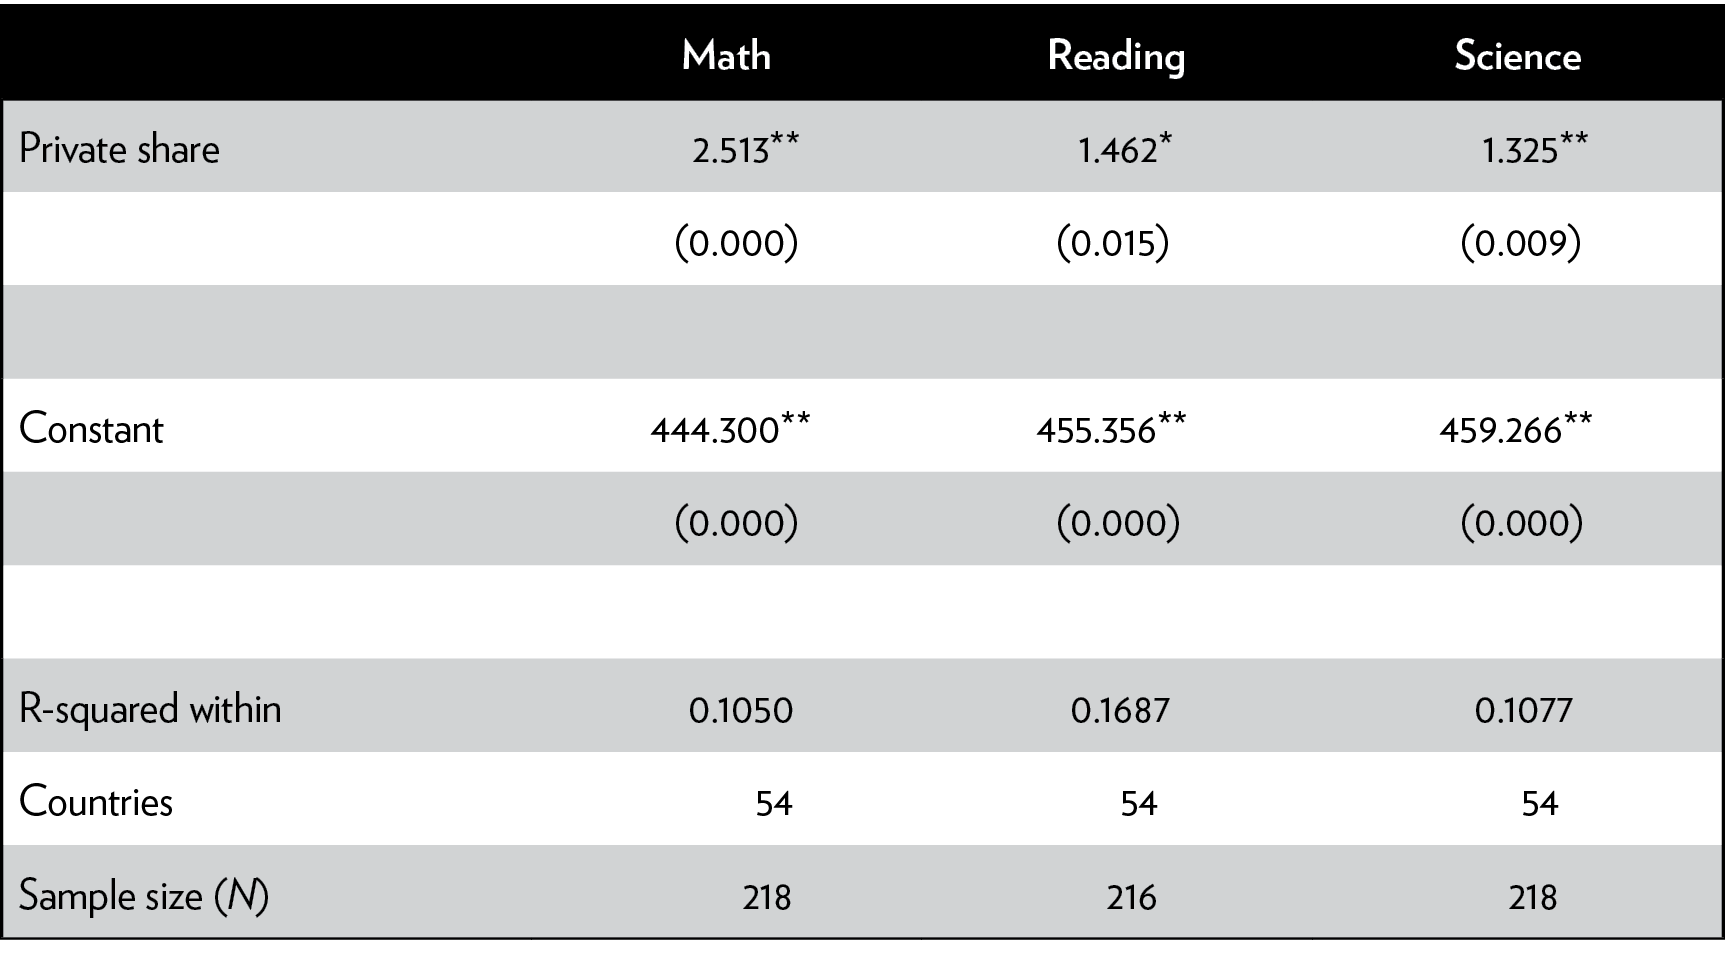
Source: Author’s calculations.
Note: p-values are in parentheses. All models use country and year-fixed effects.
* p < 0.05, ** p < 0.01
Figure 1
The effect of a 1 percentage point increase in private share of schooling enrollment on Programme for International Student Assessment (PISA) scale scores
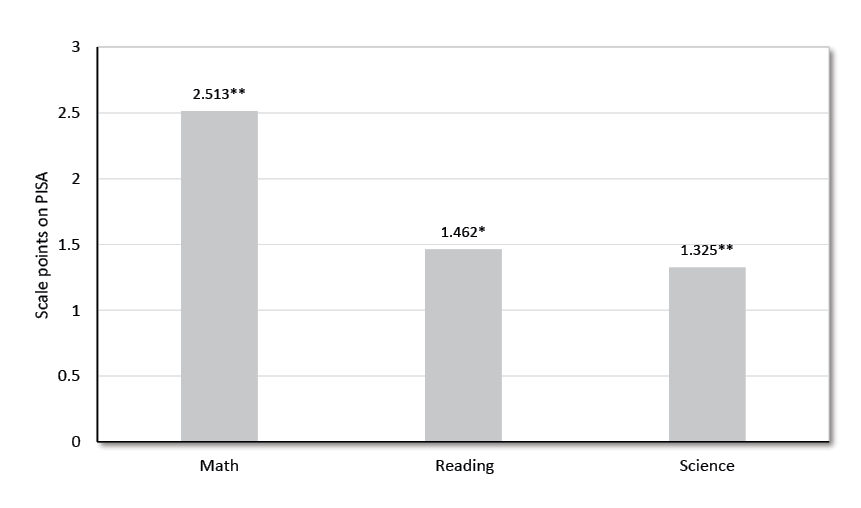
Source: Author’s calculations.
Note: * p < 0.05, ** p < 0.01
Table 3: The effect of a 1 percentage point increase in private schooling on Programme for International Student Assessment (PISA) scale scores

Source: Author’s calculations.
Note: p-values are in parentheses. All models include country and year-fixed effects.
* p < 0.10, ** p < 0.05, *** p < 0.01
Figure 2: The effect of a 1 percentage point increase in private share of schooling enrollment on Programme for International Student Assessment (PISA) scale scores
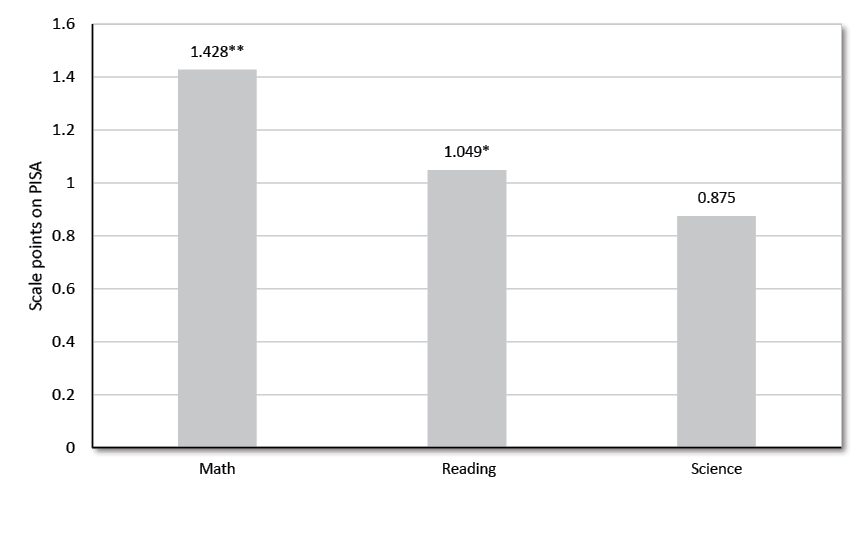
Source: Author’s calculations.
Note: * p < 0.10, ** p < 0.05
Most nations, importantly, did not experience a large fluctuation in the private share of enrollment, as evidenced by the within-country standard deviation (shown in Table 1) of around 3 percentage points observed in the sample. In other words, a 1 percentage point increase in the private share is within the realm of typical increases. However, a few nations did experience larger changes: Qatar, for example, increased its private share of schooling from around 38 percent in 2000 to almost 58 percent in 2012. Over a six-year period, Qatar also increased its PISA scores by 58 points in math, 75 points in reading, and 34 points in science.
The observed effects are moderate, as they represent around a tenth of a standard deviation increase in math, reading, and science scores. According to these results, combined with research by Stanford economist Eric Hanushek and assuming a constant return to education, a 1 percentage point increase in the share of students enrolled in private schools would result in around a 1.3 percent gain in lifetime earnings for the average student in a given nation, or about $15,000 per student in the United States.23 Moreover, according to estimates derived by the national CREDO report, the estimated effects resulting from a 1 percentage point increase in private schooling share would be equivalent to more than two months of learning gains.24
To put this in perspective, consider that the United States ranked 40th in math and 24th in reading on the 2015 PISA exam.25 If the United States had experienced a 10 percentage point increase in private school enrollment at that time (an increase that would be out of the ordinary for the United States), I estimate that the nation would have achieved a 14-point increase in math and a 10-point increase in reading, resulting in the country being ranked around 34th in math and around 13th in reading. However, private school enrollment in the United States is currently going in the opposite direction, declining from almost 12 percent in 2000 to around 8 percent in 2012.
Conclusion and Policy Implications
I find that access to private schooling has moderate effects on math, reading, and science achievement for children across the globe. However, because statistical significance relies on using sufficiently large samples, and I only have access to data for just 52 countries overall, the dataset lacks the statistical power necessary to perform subgroup analyses. As a result, I am unable to determine which countries have experienced the biggest effects for students.
Of course, private schooling does not have the same effect on every child around the world. As found in the academic version of this analysis, the detected effects are mostly driven by non-OECD countries. This is likely because most of the statistical power in the analysis is derived from non-OECD countries; private schooling varies substantially more within non-OECD countries. Consequently, this body of research could be much improved with more access to schooling data worldwide. Data available at the city level would increase the statistical power enough to perform more informative subgroup analyses. Nonetheless, the positive overall effect means that many children experienced higher achievement than they would have experienced if private school enrollment had been flat or shrank. Obviously, while private schooling does not have the same test score effects for every child around the world, private school choice does improve the ability of families to provide their children with options necessary for lifelong success.
This report, alongside robust scientific evidence of improved short- and long-term outcomes for students and societies, further indicates that decisionmakers ought to increase access to private school choice around the world. In particular, Education Savings Accounts, tuition tax credits, individual tax credit deductions, and voucher programs could increase access to private schooling and other private educational services within countries.
Methodology Appendix
The preferred model is a time- and country-fixed effects regression approach of the form:
PISAit = β0 + β1PrivateShare it + β2GDPit + β3GovtExpendit + β4Popit + β5Enrollit + β6LifeExpectit + β7Mortalityit + β8Ageit + ai + ɛit
where PISA is one of the three dependent variables of interest for country i at time period t. The three dependent variables of interest are math, reading, and science test scores as measured by the international PISA assessment.
PrivateShare is the independent variable of interest, the private school share of total enrollment for country i in time period t. I expect that the coefficient of interest, β1, will be positive because private schooling should increase competitive pressures, which should lead to overall increases in schooling quality within a country as measured by PISA scores.
I include a set of country-level control variables because certain characteristics of countries may cause their children to become better educated as well as increase private sector schooling. For example, an increase in GDP could lead a country to increase spending on public schooling because it has more wealth. Concurrently, the PISA scores for a country are likely to increase because of an increase in its wealth.
GDP is the gross domestic product for country i in year t. GovtExpend is the government expenditure as a percent of GDP, Pop is the population, Age is the age of the country in years, LifeExpect is the average life expectancy, Mortality is the infant mortality rate, and Enroll is the total number of students enrolled in private and public schooling for country i in time period t. Because of the nonlinear relationship between the dependent variables and GDP, population, and enrollment, I also include squares of these terms in the models. Finally, ai is the set of country-level time-invariant parameters, such as ethnicity, language, and culture, and ɛt is the random error term.
- Jonathan N. Mills and Patrick J. Wolf, “The Effects of the Louisiana Scholarship Program on Student Achievement after Three Years,” Education Research Alliance for New Orleans, June 26, 2017, http://www.uaedreform.org/downloads/2017/06/the-effects-of-the-louisiana-scholarship-program-on-student-achievement-after-three-years.pdf; Mark Dynarski et al., “Evaluation of the DC Opportunity Scholarship Program Impacts after One Year,” United States Department of Education, June 2017; and Atila Abdulkadiroglu et al., “School Vouchers and Student Achievement: First-Year Evidence from the Louisiana Scholarship Program,” Massachusetts Institute of Technology Department of Economics working paper no. 2015.06, December 2015, https://seii.mit.edu/wp-content/uploads/2016/01/SEII-Discussion-Paper-2015.06-Abdulkadiro%C4%9Flu-Pathak-Walters.pdf.
- Kevin Carey, “Dismal Voucher Results Surprise Researchers as DeVos Era Begins,” New York Times, February 23, 2017, https://www.nytimes.com/2017/02/23/upshot/dismal-results-from-vouchers-surprise-researchers-as-devos-era-begins.html.
- Valerie Strauss, “Ravitch: Why Is PBS Running this Education Documentary?” Washington Post, June 13, 2017, https://www.washingtonpost.com/news/answer-sheet/wp/2017/06/13/ravitch-why-is-pbs-running-this-education-documentary/?utm_term=.5d7c5fea0ff0.
- Martin F. Lueken, “The Tax-Credit Scholarship Audit: Do Publicly Funded Private School Choice Programs Save Money?” EdChoice, October 2016, https://www.edchoice.org/wp-content/uploads/2016/10/Tax-Credit-Scholarship-Audit-by-Martin-F.-Lueken.pdf; Greg Forster, “A Win-Win Solution: The Empirical Evidence on School Choice,” EdChoice, May 2016, https://www.edchoice.org/wp-content/uploads/2016/05/2016-5-Win-Win-Solution-WEB.pdf; and Jeff Spalding, “The School Voucher Audit: Do Publicly Funded Private School Choice Programs Save Money?,” Friedman Foundation for Educational Choice, September 2014, https://www.edchoice.org/wp-content/uploads/2015/07/The-School-Voucher-Audit-Do-Publicly-Funded-Private-School-Choice-Programs-Save-Money.pdf.
- Will Dobbie and Roland G. Fryer Jr., “The Medium Term Impacts of High-Achieving Charter Schools,” Journal of Political Economy 123.5 (2015): 985-1037; and Corey DeAngelis and Patrick J. Wolf, “The School Choice Voucher: A ‘Get Out of Jail’ Card?,” University of Arkansas College of Education and Health Professions Working Paper no. 2016-05, March 2016, http://www.uaedreform.org/downloads/2016/03/the-school-choice-voucher-a-get-out-of-jail-card.pdf.
- Patrick J. Wolf et al., “School Vouchers and Student Outcomes: Experimental Evidence from Washington, D.C.,” Journal of Policy Analysis and Management 32.2 (2013): 246–70; and Joshua M. Cowen et al., “School Vouchers and Student Attainment: Evidence from a State-Mandated Study of Milwaukee’s Parental Choice Program,” Policy Studies Journal 41.1 (2013): 147–68.
- Joshua Angrist et al., “Vouchers for Private Schooling in Columbia: Evidence from a Randomized Natural Experiment,” American Economic Review 92.5 (2002): 1535–58; Joshua Angrist et al., “Long Term Educational Consequences of Secondary School Vouchers: Evidence from Administrative Records in Colombia,” American Economic Review 96.3 (2006): 847–62; Karthik Muralidharan and Venkatesh Sundararaman, “The Aggregate Effect of School Choice: Evidence from a Two-Stage Experiment in India,” Quarterly Journal of Economics 130.3 (2015): 1011–66; and Patrick J. Wolf, Anna J. Egalite, and Pauline Dixon, “Private School Choice in Developing Countries: Experimental Results from Delhi, India,” in Handbook of International Development and Education, ed. Pauline Dixon, Steve Humble, and Chris Counihan (Northampton, MA: Edward Elgar Publishing, Inc., 2015), pp. 456–71.
- Center for Research on Education Outcomes (CREDO), “Urban Charter School Study: Report on 41 Regions, 2015,” https://urbancharters.stanford.edu/download/Urban%20Charter%20School%20Study%20Report%20on%2041%20Regions.pdf.
- James Tooley and Pauline Dixon, “Private Education Is Good for the Poor: A Study of Private Schools Serving the Poor in Low-Income Countries,” Cato Institute Policy White Paper, December 7, 2005; and M. Najeeb Shafiq and John P. Myers, “Educational Vouchers and Social Cohesion: A Statistical Analysis of Student Civic Attitudes in Sweden,” American Journal of Education 121.1 (2014): 111–36.
- Aldo S. D’Agostino, “Does Private School Competition Improve Country-Level Student Achievement? A Cross-Country Analysis Using PISA 2012” (master’s thesis, Georgetown University, 2016), https://repository.library.georgetown.edu/bitstream/handle/10822/1040786/DAgostino_georgetown_0076M_13204.pdf?sequence=1&isAllowed=y.
- Chris Sakellariou, “Private School or Public School Advantage? Evidence from 40 Countries Using PISA 2012-Mathematics,” Applied Economics 49.29 (2017): 2875–92.
- Martin R. West and Ludger Woessmann, “‘Every Catholic Child in a Catholic School’: Historical Resistance to State Schooling, Contemporary Private Competition and Student Achievement across Countries,” Economic Journal 120.546 (2010): F229–55.
- Gabriel Heller-Sahlgren, “Smart but Unhappy: Independent-school Competition and the Wellbeing-Efficiency Trade-off in Education,” Economics of Education Review 62 (2018): 66–81.
- Corey A. DeAngelis, “Does Private Schooling Improve International Test Scores? Evidence from a Natural Experiment,” EDRE Working Paper no. 2017-02, October 2017, https://papers.ssrn.com/sol3/papers.cfm?abstract_id=2903523.
- Caroline Minter Hoxby, Economics of School Choice (Chicago: University of Chicago Press, 2003), pp. 287–342; and Milton Friedman and Rose Friedman, Free to Choose: A Personal Statement (Orlando, FL: Harcourt, Inc., 1990).
- William A. Niskanen Jr., Bureaucracy and Representative Government (Chicago: Aldine-Atherton, 1971).
- Paul Klemper, “Markets with Consumer Switching Costs,” Quarterly Journal of Economics 102 (1987): 2.
- Corey A. DeAngelis and Heidi Holmes Erickson, “What Leads to Successful School Choice Programs? A Review of the Theories and Evidence,” Cato Journal 38 (forthcoming).
- National Center for Education Statistics, “International Data Explorer,” https://nces.ed.gov/surveys/pisa/idepisa/.
- The World Bank and UNESCO Institute for Statistics, “Percentage of Enrolment in Primary Education in Private Institutions,” http://data.worldbank.org/indicator/SE.PRM.PRIV.ZS.
- UN Data, UIS Data Centre, “Private Enrolment as Percentage of Total Enrolment. Primary Education,” http://data.un.org/Data.aspx?d=UNESCO&f=series%3aPRP_1.
- Religion and racial diversity indexes are not available for multiple years, so I am unable to empirically test this assumption.
- Eric A. Hanushek, “The Economic Value of Higher Teacher Quality,” Economics of Education Review 30.3 (2011): 466–79.
- Center for Research on Education Outcomes, “Urban Charter School Study: Report on 41 Regions, 2015.”
- Organisation for Economic Co-operation and Development, “PISA 2015, Results in Focus,” 2016, https://www.oecd.org/pisa/pisa-2015-results-in-focus.pdf.

About the Author
