One provision of the Patient Protection and Affordable Care Act (ACA) that has been delayed until 2017 is a federal mandate for standard menu items in restaurants and some other venues to contain nutrition labeling. The motivation for so-called “menu mandates” is a concern about rising obesity levels driven largely by Americans’ eating habits. Menu mandates have been implemented at the state and local level within the past decade, allowing for a direct examination of the short-run and long-run effects on outcomes such as body mass index (BMI) and obesity. Drawing on nearly 300,000 respondents from the Behavioral Risk Factor Surveillance System (BRFSS) from 30 large cities between 2003 and 2012, we explore the effects of menu mandates. We find that the impact of such labeling requirements on BMI, obesity, and other health-related outcomes is trivial, and, to the extent it exists, it fades out rapidly. For example, menu mandates would reduce the weight of a 5′10″ male adult from 190 pounds to 189.5 pounds. For virtually all groups explored, the long-run impact on body weight is essentially zero. Analysis of subgroups suggests that to the extent that menu mandates affect short-run outcomes, they do so through a “novelty effect” that wears off quickly. Subgroups that were thought likely to experience the largest gains in knowledge from such mandates exhibit no short-run or long-run changes in weight.
Menu Mandates and Obesity
Introduction
The prevalence of obesity has increased markedly in the United States over time and has affected all socioeconomic groups.1, 2, 3 Although the estimated cost of obesity—in terms of disease, medical visits, lost work days, and other outcomes—varies widely, some have argued that these costs represent a rationale for government intervention to reduce obesity-related externalities.4, 5
The Patient Protection and Affordable Care Act is the most significant government overhaul of the U.S. healthcare system since the passage of Medicare and Medicaid in the 1960s. One often overlooked provision, Section 4205, mandates that calorie information be provided on menus of restaurants and numerous other venues.6 When fully implemented, this “menu mandate” will affect 300,000 establishments, and the breadth of the Food and Drug Administration’s (FDA) final rule surprised even health advocates.7, 8 Chain restaurants, movie theaters, grocery stores (for their salad or hot bars), and vending machines will be forced to provide calorie counts. Although this FDA regulation was supposed to be effective in December 2015, it was pushed back and will now be implemented in 2017.9
The stated motivation for such menu mandates is to reduce the number of overweight and obese Americans by reducing their consumption of calories. A significant portion of food expense and calories comes from foods prepared outside the home, and government officials believe that many people do not know (and may underestimate) the caloric content of such food.10 The federal mandate was preceded by similar efforts at the state and local levels within the past decade, perhaps the best known of which was New York City’s menu mandate in 2008. At the time, some argued that menu mandates could lead to substantial reductions in weight—roughly 7.5 pounds per year, or 106 calories per fast-food transaction.11
To date, the most convincing evidence concerning the effects of menu mandates—both in New York City and elsewhere—has been on calorie consumption associated with individual transactions. The evidence on the broader effectiveness of such mandates is mixed; we discuss it later. However, more important than any one transaction is whether menu mandates have any long-lasting impact on body weight or obesity. The principal contribution of this analysis is to explore this issue by using publicly available data on nearly 300,000 respondents from the Behavioral Risk Factor Surveillance System for 30 large cities between 2003 and 2012. On a staggered basis, some of these cities implemented menu mandates, while others did not. This paper finds that the impact of such mandates on body weight is trivial, and to the extent an impact exists, it fades out rapidly. For example, menu mandates would reduce the weight of a 5′10″ male adult from 190 pounds to 189.5 pounds. For virtually all groups explored, the long-run impact on body weight of menu mandates is essentially zero. This evidence demonstrates the futility of government efforts at altering individuals’ preferences regarding the food they eat; the lack of benefit, in conjunction with costs both to consumers and businesses, shows that government-imposed menu mandates are ill-advised.
The Benefits of Menu Mandates
Bollinger et al. discuss the potential impact of menu mandates.12 Learning information about calories contained in food and beverages may lead to healthier purchases by consumers at chain restaurants. However, customers may care mostly about convenience, price, and taste, with calories being relatively unimportant. It may also be the case that those who do care about calories are already well-informed; such nutrition information is available for the motivated customer.
How menu mandates affect behavior in the long run, or outside of the restaurant setting, is less clear. With respect to long-run behavior, such mandates may improve a customer’s knowledge of calories (a “learning effect”) or sensitivity to calories (a “salience effect”).13 To the extent that menu mandates improve learning and correct misperceptions about food calories, the effects of menu mandates are more likely to be permanent. To the extent they simply make calories more salient, the effects are more likely to be short-lived. Efforts to make unwanted information more salient—from web banners to graphic tobacco warning labels—tend to be ineffective, especially after the initial novelty wears off.14 Cantor et al. surveyed consumers in New York City immediately after the menu mandate took effect in 2008, and at three points during 2013–2014.15 They found that the percentage of respondents noticing and using the information declined in each successive period, and that there were no statistically significant changes in calorie levels or visits to fast-food restaurants.
In addition to these responses, it is also possible that restaurants innovate by offering more low-calorie items in the long run, making the mandate more impactful. Outside the restaurant setting, consumers’ exposure to calorie information may make them generally more aware and attentive to the nutritional value of the foods they eat.16 On the other hand, people may offset changes in their calorie consumption at restaurants by changing what they eat at home.
Ultimately, the evidence on the effects of menu mandates on caloric intake at restaurants is mixed. Studying the implementation of the menu mandate in New York City, Bollinger et al. find that average calories consumed per transaction at Starbucks fell by 6 percent, but that this change disproportionately affected consumers who made high-calorie purchases (thereby potentially having a larger impact on obesity rates).17 Yet a meta-analysis by Long et al. found that “current evidence does not support a significant impact on calories ordered.”18 And the findings of Cantor et al. suggest any effects may be short-lived. While reduced caloric intake at point-of-purchase is certainly a necessary condition for reductions in body weight, it is not sufficient. As mentioned previously, the stated goal is to reduce the prevalence of being obese and overweight, especially in the long run. Thus the focus of this study is much more accurately aligned with the explicit public health policy goal of such menu mandates. A recent paper by Deb and Vargas explores many of the same issues as this paper; the authors use the BRFSS and the staggered implementation of menu mandates to examine effects on BMI, although the geographic coverage and econometric methods differ.19 In many respects, the principal findings of the two studies are quite similar: for the population as a whole, the effects of menu mandates on BMI are very small. Deb and Vargas find significant effects for some subgroups, as does this study. And although not the key focus of their study, their entropy-balanced, weighted trends for men (where they do find significant effects) show convergence by 2012, consistent with a fade-out effect of menu mandates found in this study.
The Costs of Menu Mandates
Some of the same studies that find reductions in calories consumed (arguably a benefit) also assert that the costs of menu mandates are trivial or nonexistent. For example, Bollinger et al. argue that “as far as regulatory policies go, the costs of calorie posting are very low—so even these small benefits could outweigh the costs.”20 This section reviews the costs of menu mandates.
Some of the financial costs are outlined in Bollinger et al. One cost of menu mandates is updating display menus, which is modestly expensive. This potentially is a one-time fixed cost, and perhaps a primary reason many chains are switching to digital menu boards.21 Another cost is determining the caloric content of each menu item. This is likely a more important issue for the other types of venues covered by the menu mandate, as most chains know well the caloric content of each regular menu item.22 Related to this, there may be increased legal costs from being exposed to potential litigation if the posted calories are incorrect. Menu mandates may also affect operating profits by decreasing demand or frequency of visits, but this was not the case for Starbucks.23
There are also more subtle costs. Adding calorie content can slow down the ordering process, which reduces the overall convenience of consuming fast food. Some menu labeling laws distinguish between—and have different requirements for—menu boards inside a restaurant and drive-through menus outside a restaurant. For example, California’s statewide menu mandate (effective January 2011) required menu boards to display calories next to the item, but allowed to drive-throughs to offer a brochure that is available on request.24 This law implicitly recognizes the potential bottleneck that arises with one line in a drive-through setting, but the same critique about reduced convenience applies inside the store as well.
Arguably a more important, but harder to measure, cost is the reduced utility from consuming a meal. Although Cantor et al. find increases of up to 37 percentage points in those who saw calorie labels in New York City after the menu mandate (from 14 percent to 51 percent), those who used labels to order fewer calories increased by just 7 to 10 percentage points. Among those who see such information but do not use it in altering their purchasing choices, such “education” presumably lowers utility for those who still consume high-calorie meals anyway. Glaeser calls this an “emotional tax” on behavior that yields no government revenue, just pure utility losses.25
Empirical Approach and Findings
Although one cannot yet measure the impact of the menu mandate provision in the ACA, a number of localities and states have regulated menu information at chain restaurants since 2008. Most prominently, in New York City under Mayor Michael Bloomberg, efforts were made to regulate soda sizes, limit trans fats, and mandate calorie disclosure on menus, leading to calls of New York becoming a “nanny state.”26 Although receiving far less attention, some of these same measures—especially regarding mandated calorie disclosure—were implemented in a number of other large urban areas, including Philadelphia, Portland, Seattle, as well as statewide in Massachusetts and California. The empirical approach, discussed in the appendix, is to compare individuals in these locations both before and after menu mandates were enforced. To address concerns that other factors besides menu mandates may also affect body weight and were changing over time, other large cities (Charlotte, Chicago, Columbus, Dallas, Denver, Detroit, El Paso, Fort Worth, Houston, Indianapolis, Jacksonville, Louisville, Memphis, Milwaukee, Nashville, Oklahoma City, Phoenix, and San Antonio) serve as a control group.
The analysis relies on transparent, publicly available data from the Behavioral Risk Factor Surveillance System. The BRFSS completes more than 400,000 adult interviews each year, making it the largest continuously conducted health survey system in the world.27 Between 2003 and 2012, the publicly available data both identify an individual’s locality and ask about body weight.28 In virtually all studies of adults, the critical outcome of interest is the body mass index, which is a measure of body fat based on height and weight: BMI is a person’s weight in kilograms divided by the square of their height in meters. From there, various thresholds of BMI are used to classify individuals as obese (BMI >= 30.0), overweight (BMI >= 25.0), underweight (BMI < 18.5), or normal weight (18.5 <= BMI < 25.0).29
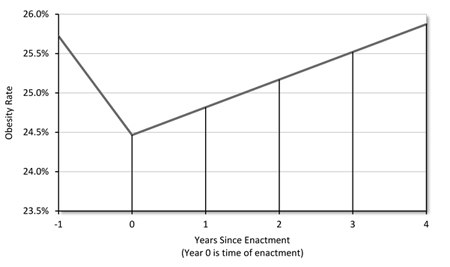
Without a doubt, the largest share of attention has been focused on obesity. More than one-third of adults in the United States are obese.30 The empirical analysis in this paper examines the impact of menu mandates on obesity, along with the other body weight outcomes (BMI levels, overweight or more, underweight). Because of the motivations discussed earlier about learning and salience (i.e., the “novelty” of calorie disclosure), this study estimates both the immediate impact and the longer-run impact of menu mandates. Figure 1 Figure 1, “The Effect of Menu Mandates on Obesity Levels is Short-Lived” illustrates how menu mandates affect obesity rates for adults in the years after enactment, using coefficient estimates from the regression model based on all 30 cities in Table A.2.Table A.2, “Full Sample from the Behavioral Risk Factor Surveillance System”
Figure 1. The Effect of Menu Mandates on Obesity Levels is Short-Lived
|
Source: Effects from regression model were estimated by the author from the Behavioral Risk Factor Surveillance System data in Table 2, Specification 2. |
As can be seen, prior to enactment of menu mandates (period ‑1), approximately 25.7 percent of adults in these 30 major cities were obese. There is a statistically significant reduction in obesity at time of implementation—roughly 1.25 percentage points—which would bring down the obesity rate to 24.5 percent. However, the effects are short-lived. In years after enactment, the novelty of menu mandates appears to wear off, and obesity rates again rise, such that the entire impact on obesity disappears within four years. Thus, menu mandates appear to have a small but temporary impact on obesity.
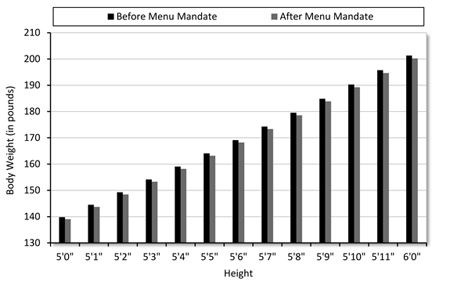
In addition to obesity, where the effects fade over time, the study considered BMI, for which there appear to be more permanent effects, although these effects are not concentrated amongst the heaviest individuals. The same empirical models show that menu mandates lead to a one-time reduction in BMI of 0.15 BMI points, and that this weight reduction is sustained over time. Figure 2 Figure 2, “The Impact of Menu Mandates on Body Weight” illustrates the practical importance of this reduction.
Figure 2. The Impact of Menu Mandates on Body Weight
|
Source: Author’s calculations from model estimated from the Behavioral Risk Factor Surveillance System data in Table 2, Specification 2. Results were calculated for the average BMI in the sample of 27.3. |
Although the weight loss is statistically significant, an effect of 0.15 BMI points translates into a barely noticeable difference in weight. For example, for an individual who is 5′10″ and is initially average (BMI = 27.3), the reduction in body weight is roughly one pound. As can be seen for heights that vary from 5′0″ to 6′0″, the impact of menu mandates for the typical individual is hardly visible.
The technical analysis in the appendix further examines the effects of menu mandates among various socioeconomic groups. It finds that the impacts are nonexistent for young adults and the less educated—both groups where, it could be argued, that such mandates convey new and meaningful information about caloric content. In contrast, the effects (and fade-out) are larger for older adults and those with more education—both groups that likely have greater knowledge of caloric content, and where such mandates provide salience, novelty, or guilt when initially implemented. For them, there are larger initial reductions in BMI and obesity, but the initial effects fade out quickly. The conclusion that emerges is that menu mandates serve as an ineffective “emotional tax.”
Conclusion
The analysis in this study has found that menu mandates are a futile effort to reduce body weight, with trivial or short-lived effects on BMI and obesity. What public efforts should be undertaken to reduce obesity? The intuitive answer is “nothing at all.” People make choices about all aspects of their lives. Whether it is to eat unhealthily, smoke cigarettes, use drugs, consume alcohol, drop out of school, watch too much television, not exercise, or not save for retirement, all of these decisions should ultimately fall onto the individual, who has to live with the consequences of his or her actions. In virtually all of these cases, as illustrated with BMI and obesity in this study, the argument that individuals are ill-informed about the consequences of their actions is implausible.
Proponents of government intervention would argue that there are negative externalities—costs of obesity that are not borne by the individual, but by society as a whole. The primary consequences of obesity are costs related to disease, medical visits, and lost work days. In principle, each of these would be internalized by the individual through well-functioning insurance and labor markets. That is, the fact that Medicare or Medicaid costs increase due to obesity is not a problem about obesity, but about public health insurance not accurately pricing premiums to reflect an individual’s choices. Private, unregulated insurance markets would price their products based on such risk characteristics, in which case such externalities are internalized.
Finally, some prominent behavioral economists look at the evidence on ineffectiveness of calorie labeling and suggest doubling down. Cass Sunstein has recently argued that menu mandates are too complicated and argues for “simple and meaningful” disclosures to consumers, such as putting a “red light” on highly caloric foods and a “green light” on the healthier ones.31 The current analysis shows that the problem is not lack of knowledge or conveying information—on the contrary, the consumers who responded to the menu mandates were among the most knowledgeable. Rather, people have preferences that are more or less fixed, and for the most part, people enjoy cheeseburgers more than broccoli. The private market provides ample nutrition advice at extremely low cost, from cell-phone apps that give calorie and other nutrition information to easy-to-understand, simple substitutions in books such as Eat This, Not That. There is no need for government-mandated disclosures that impose an emotional tax on each transaction when individuals can easily and voluntarily seek out such information on nutrition.
A. Appendix
Data
The analysis uses data from the Behavioral Risk Factor Surveillance System.32 The BRFSS is a collaborative project of the Centers for Disease Control and Prevention (CDC) and U.S. states and territories.33 The BRFSS, administered and supported by CDC’s Behavioral Risk Factor Surveillance Branch, is an ongoing data-collection program designed to measure behavioral risk factors for the noninstitutionalized adult population (18 years of age and older). The BRFSS was initiated in 1984, with 15 states collecting surveillance data on risk behaviors through monthly telephone interviews. Over time, the number of states participating in the survey increased: by 2001, all 50 states, the District of Columbia, Puerto Rico, Guam, and the U.S. Virgin Islands were participating in the BRFSS.
Of critical importance, the BRFSS calculates the body mass index from the respondent’s reported height and weight. The BMI is a measure of body fat based on height and weight that applies to adult men and women, where a BMI of 30.0 or greater is classified as obese, a BMI between 25.0 and 29.9 is classified as overweight, a BMI between 18.5 and 24.9 is classified as normal weight, and a BMI less than 18.5 is classified as underweight.34
The BRFSS consists of repeated annual cross sections of randomly sampled adults. The survey boasts a large number of respondents, which is critical to obtaining meaningful precision when examining the impact of a local program where effects might be concentrated amongst only a fraction of the population.35 Given the focus on local regulations regarding caloric content, the analysis uses BRFSS data from 2003 to 2012, where county identifiers are included.36 Adults in the 30 largest cities in the United States are included, reducing the initial BRFSS sample from 3,991,585 observations to 362,361 observations.37 The total population in these cities, approximately 38.97 million in July 2012, is 12.4 percent of the total U.S. population.38 These 30 cities include New York, Philadelphia, Seattle, and Portland, all of which mandated calorie disclosure on menus starting in 2008 or later. The cities also include Los Angeles, San Francisco, San Jose, San Diego, and Boston, where state legislation mandated disclosure. By 2012, nearly half the residents of these 30 large cities were covered by such mandates. The final sample consists of adults aged 18 and over who provided sufficient information to compute BMI; demographics (race, ethnicity, age, gender, number of children, and marital status); socioeconomic status (education, employment, and income); and health status (self-reported health and exercise). These restrictions reduce the sample to 288,392 individual-level observations that are used in the empirical analysis.
Summary Statistics
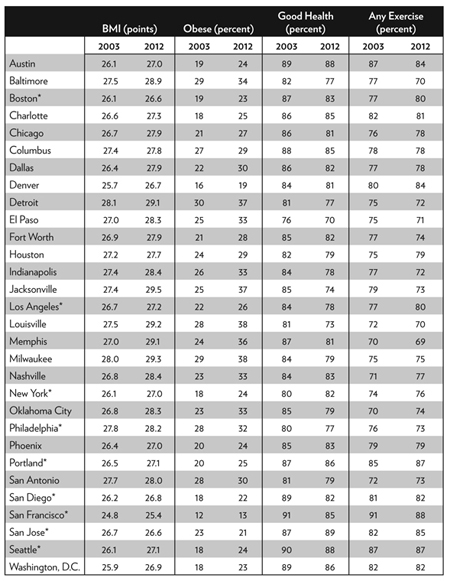
The vast majority of menu mandates were implemented at the local level by very large cities. A natural concern, one that is accounted for in the regression framework with city-fixed effects, is that large cities differ from smaller cities or rural areas, and also that large cities with calorie disclosure requirements differ from other ones that did not have such mandates. Table A.1 Table A.1, “Comparisons across 30 cities over time in Body Mass Index (BMI), Obesity, and Health Habits” provides summary statistics in 2003 and 2012 across the 30 cities for several key health variables.39 The BMI and obesity (BMI >= 30.0) increased in almost every city over this period. There is significant cross-sectional variation in residents’ weight prior to any menu mandates: Detroit, Louisville, and San Antonio had obesity rates exceeding 30 percent in 2003, while many of the cities that subsequently mandated calorie disclosure had obesity rates below 20 percent.
Such differences in BMI or obesity could reflect fixed characteristics at the local level, such as the weather (and ease of exercising outdoors) or mode of transport to work, and are controlled for in the empirical work with city-fixed effects. Put differently, it is likely that the localities that forced calorie disclosure are different in other ways. This is illustrated in Table A.1 by looking at self-reported health and exercise habits, both of which exhibit significant cross-sectional variation: in 2003, there is approximately a 20 percentage point difference in reporting any exercise in the past 30 days between the least active and most active cities.
Empirical Specification
The staggered implementation of menu mandates in some localities, but not others, creates a straightforward “difference-in-difference” framework that has been effectively used to estimate the causal effect of policy.40 The regression specification is set up as follows:
WEIGHTijt = β0 + β1MENU_MANDATEjt + β2YEARS_AFTERjt + β3Xi + δj + δt + εijt
where WEIGHTijt represents BMI, Obesity, Overweight, or Underweight for person i in city j (for the 30 cities listed in Table A.1 Table A.1, “Comparisons across 30 cities over time in Body Mass Index (BMI), Obesity, and Health Habits”) in time period t (2003–2012), and is a continuous measure for BMI, or a dummy variable equal to 1 if the individual was Obese (BMI >= 30.0), Overweight (BMI >= 25.0) or Underweight (BMI < 18.5). Also included are individual controls in Xi related to the respondent’s age, education, race/ethnicity, gender, marital status, health status, exercise frequency, and number of children.
The variable MENU_MANDATEjt is a policy indicator that varies by city and time period, and is equal to 1 if the locality mandated calorie disclosure in year t. Additionally, the variable YEARS_AFTERjt measures the number of years since the mandate was implemented. At the local level, New York, Philadelphia, Seattle (King County), and Portland (Multnomah County) passed menu mandates.41 At the state level, California, Maine, Massachusetts, and Oregon passed such mandates.42 For example, New York City implemented a mandate in 2008; thus both variables equal 0 for these residents in the years 2003–2007, while MENU_MANDATEjt equals 1 for the years 2008–2012, and YEARS_AFTERjt increases from 1 in 2008 to 5 by 2012. The mandate variables are constructed at the group level, while the BRFSS data itself is at the individual level. Following the recommendation of Cameron, Gelbach, and Miller, the standard errors are corrected for non-nested two-way clustering, where the clustering is based on locality and year.43
Table A.1. Comparisons across 30 cities over time in Body Mass Index (BMI), Obesity, and Health Habits
|
Source: Authors’ tabulation of 2003 and 2012 Behavioral Risk Factor Surveillance System. |
|
Note: Summary statistics are unweighted and include adults aged 18 and over. Cities with an asterisk had implemented a mandate for chain restaurants to disclose calories by 2012. The BMI is average Body Mass Index and Obese is the fraction with BMI >= 30.0. Good health is the fraction of sample that self-reports health status as excellent, very good, or good. Any exercise is the fraction that reports any exercise (outside of work) in the past 30 days. Individuals with invalid data on any question excluded from table. |
Main Results and Subgroup Analysis
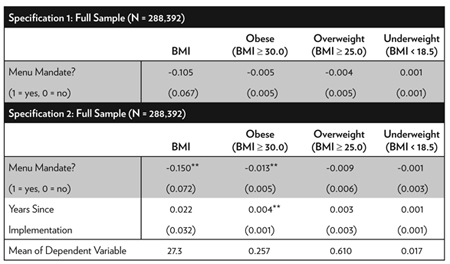
Table A.2 presents results for four outcomes: BMI, Obese, Overweight, and Underweight. The first set of results includes an indicator for a menu mandate, but not additional years since passage. Although not shown, all specifications include dummy variables for year and city, interview month, health status, gender, marital status, race/ethnicity, any exercise, education, and age and number of children. In no case are the results statistically significant. In addition, if one were to interpret the point estimate on BMI, it would indicate that the effect of menu labeling reduces BMI by 0.11 points. The average respondent in the sample has a BMI of 27.3, suggesting such labeling would reduce BMI to approximately 27.2. To put this in perspective, for a 5′10″ male adult, this translates into a reduction in weight from 190 pounds to 189.5 pounds, roughly a 0.5 pound reduction.47 None of the threshold measures—Obese, Overweight, or Underweight—are significant.
Table A.2. Full Sample from the Behavioral Risk Factor Surveillance System
|
Source: Author’s calculation from 2003–2012 Behavioral Risk Factor Surveillance System. |
|
Notes: Standard errors in parentheses and are corrected for non-nested two-way clustering, using the methods of A. Colin Cameron, Jonah B. Gelbach, and Douglas L. Miller, “Robust Inference with Multiway Clustering,” Journal of Business & Economic Statistics 29, no. 2 (2011): 238–49, where clustering is grouped on city and year. All specifications includes fixed effects for city (30 overall), year (2003–2012), and interview month. Individual covariates include self-reported health (excellent/very good/good)(omitted is fair/poor); male; married; race/ethnicity (Hispanic, white, African-American)(omitted is other group); any exercise in past 30 days; number of children; education (high school or less, some college)(omitted is college graduate); and age. |
The second set of findings examines the full sample, and includes both an indicator for the menu mandate as well as years since passage. For BMI, the initial implementation significantly reduces BMI (p‑value of 0.037). However, the interpretation is much the same as before, as the effect of menu labeling reduces BMI by 0.15 points. The effect appears to be long-lived for the full sample, as the effect of years-since-passage is insignificant.
Perhaps the most noteworthy result relates to obesity (BMI >= 30.0). In the full sample, nearly 26 percent of respondents are obese. The immediate impact of menu labeling is to significantly reduce obesity by nearly 1.3 percentage points (p‑value of 0.016). Bollinger et al. argue that if the policy goal is to address obesity, it is important to know whether calorie posting disproportionately affects consumers who make high-calorie purchases.48 They find that calorie posting has a large influence on Starbucks loyalty cardholders who tended to make high-calorie purchases. For consumers who averaged more than 250 calories per Starbucks transaction, calories per transaction fell by 26 percent, versus 6 percent for the full sample. The short-run effect estimated from the BRFSS analysis appears consistent with Bollinger et al.49 However, the effect on obesity is short-lived, as the coefficient on years-since-passage is positive. Each additional year since passage increases obesity by nearly 0.4 percentage points, meaning that the short-run reduction in obesity disappears within four years. Menu labeling mandates have no long-run impact on obesity. Furthermore, menu mandates have no impact on Overweight (BMI >= 25.0, comprising nearly 61 percent of the full sample) or Underweight (BMI < 18.5, comprising 1.7 percent of the full sample).
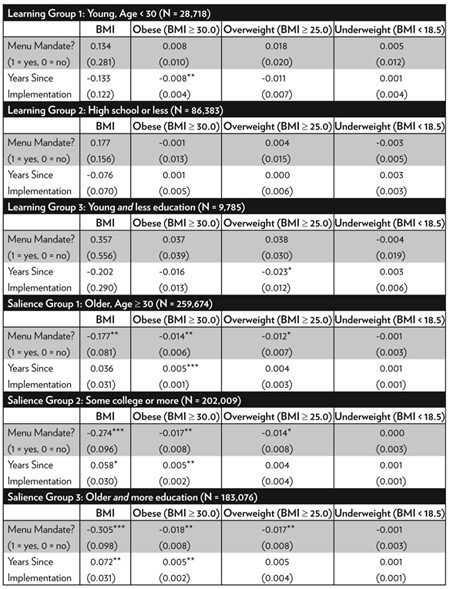
Table A.3 Table A.3, “Learning versus Salience” breaks out the full sample into various subgroups that may be of interest in their own right. Even though the effects of menu mandates are ineffective for the full sample, they may be more significant for various groups. As Bollinger et al. (2011) explain, two of the principal methods through which menu mandates may reduce weight are learning effects and salience effects.50 It is reasonable to believe that the learning effect would be more important for those with less experience with nutrition, where two proxies for such inexperience are low levels of education and young age. Conversely, the learning effect should be less important for those with more experience with nutrition, which is proxied by higher levels of education and older ages. If learning is unimportant for these groups, then any effects on weight are likely due to the salience of caloric information on menus.
Table A.3. Learning versus Salience
|
Source: Author’s calculation from 2003–2012 Behavioral Risk Factor Surveillance System. |
|
Notes: Standard errors in parentheses and are corrected for non-nested two-way clustering, using the methods of A. Colin Cameron, Jonah B. Gelbach, and Douglas L. Miller, “Robust Inference With with Multiway Clustering,” Journal of Business & Economic Statistics29, no. 2 (2011): 238–49, where clustering is grouped on city and year. All specifications includes fixed effects for city (30 overall), year (2003–2012), and interview month. Individual covariates are identical to that in Table 2, except when stratifying on covariate under consideration. |
The first panel of this table examines weight outcomes for those with a high school diploma or less, and the second examines outcomes for young adults aged 18 to 29. For both groups, menu mandates are more likely to convey new information. For less educated individuals, there is no evidence that mandates influence weight, suggesting that the information effect plays a relatively minor role. For young adults, it does appear that mandates reduce obesity, and that such an impact grows over time. When the two groups are combined—less educated young adults—there appears to be some sustained effect on Overweight but no effect on Obesity or Underweight.
The second panel examines weight outcomes for respondents with at least some college education, as well as older adults. In these groups, one may speculate that salience of caloric content plays a more important role. The results for more-educated respondents are striking. The immediate effect of menu mandates is a BMI reduction of nearly 0.28 BMI points (p‑value of 0.004), but the effect disappears within approximately four years (with BMI increasing by nearly 0.06 BMI points per year, p‑value of 0.053). Menu mandates have long-lasting effects on Overweight, but short-lasting effects on Obesity. For Overweight, the immediate effect is a reduction of 1.4 percentage points (p‑value of 0.056), and the effect does not diminish over time. For Obesity, there is a large immediate reduction of 1.7 percentage points (p‑value of 0.044), but this effect is eliminated within approximately three years (with Obesity rising by 0.5 percentage points per year, p‑value of 0.042). There is no effect for Underweight. The findings are similar for individuals aged 30 and over. The immediate and long-lasting effect on BMI is to reduce it by 0.18 BMI points (p‑value of 0.028). As with more educated individuals, the immediate impact on Obesity is significant but short-lived. The immediate reduction is 1.4 percentage points (p‑value of 0.017), but the effect also disappears within three years (with Obesity rising by 0.5 percentage points per year, p‑value of 0.001). As before, effects on Overweight appear to be longer lasting, and there is no effect on Underweight.
By combining the two groups—college-educated individuals aged 30 and over—the fade-out effects become extremely apparent. The immediate effect of menu mandates reduces BMI by 0.3 BMI points (p‑value of 0.002) but BMI subsequently increases by 0.07 points per year (p‑value of 0.018). There again appear to be sustained effects on Overweight, but effects on Obesity fade out quickly.
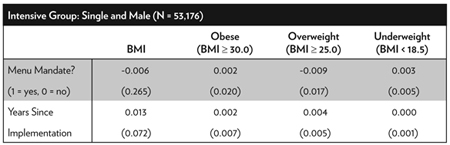
Table A.4 Table A.4, “Intensive Users of Fast Food” breaks outs the sample into those who are likely more intensive users of chain restaurants. Driskell et al. show that a significantly higher percentage of male college students report eating fast foods at least once a week relative to female college students.51 Other work shows that unmarried men spend a significantly greater proportion of their food budget on commercially prepared food than their married male peers. Households headed by single men spent more per capita on such food than those headed by single women.52
Given these findings, it is expected that single men would likely be more intensive users of fast food. However, the impact of menu mandates is less clear. It is surely the case that menu mandates should not matter for those who tend to cook at home. Yet among regular users of fast food, it is possible that much of the learning about caloric intake has already been done, or that food choices are relatively ingrained. The findings in the first panel of Table A.4 Table A.4, “Intensive Users of Fast Food” show no impact of menu mandates on unmarried men across BMI and each weight category.
Table A.4. Intensive Users of Fast Food
|
Source: Author’s calculation from 2003–2012 Behavioral Risk Factor Surveillance System. |
|
Notes: Standard errors in parentheses and are corrected for non-nested two-way clustering, using the methods of A. Colin Cameron, Jonah B. Gelbach, and Douglas L. Miller, “Robust Inference With with Multiway Clustering,” Journal of Business & Economic Statistics29, no. 2 (2011): 238–49, where clustering is grouped on city and year. All specifications includes fixed effects for city (30 overall), year (2003–2012), and interview month. Individual covariates are identical to that in Table A.2, except when stratifying on covariate under consideration. |
Notes
1. K. M. Flegal, M. D. Carroll, R. J. Kuczmarski, and C. L. Johnson, “Overweight and Obesity in the United States: Prevalence and Trends, 1960–1994,” International Journal of Obesity and Related Metabolic Disorders: Journal of the International Association for the Study of Obesity 22, no. 1 (1998): 39–47.
2. K. M. Flegal, M. D. Carroll, C. L. Ogden, and L. R. Curtin, “Prevalence and Trends in Obesity Among US Adults, 1999–2008.” JAMA 303, no. 3 (2010): 235–41.
3. A. H. Mokdad, M. K. Serdula, W. H. Dietz, B. A. Bowman, J. S. Marks, and J. P. Koplan, “The Spread of the Obesity Epidemic in the United States, 1991–1998,” JAMA 282, no. 16 (1999): 1519–22.
4. A. M. Wolf and G. A. Colditz, “Current Estimates of the Economic Cost of Obesity in the United States,” Obesity Research 6, no. 2 (1998): 97–106.
5. J. Cawley and C. Meyerhoefer, “The Medical Care Costs of Obesity: An Instrumental Variables Approach,” Journal of Health Economics 31, no. 1 (2012): 219–30.
6. These include bakeries, cafeterias, coffee shops, convenience stores, delicatessens, food service facilities located within entertainment venues (such as amusement parks, bowling alleys, and movie theatres), food service vendors (e.g., ice cream shops and mall cookie counters), food take-out and/or delivery establishments (such as pizza), grocery stores, retail confectionary stores, superstores, quick service restaurants, and table service restaurants. See Department of Health and Human Services, Food and Drug Administration, “Food Labeling; Nutritional Labeling of Standard Menu Items in Restaurants and Similar Retail Food Establishments,” Federal Register 79, no. 230 (December 1, 2014): 71156, https://www.gpo.gov/fdsys/pkg/FR-2014-12-01/pdf/2014-27833.pdf.
7. See “Health Policy Brief: The FDA’s Menu-Labeling Rule,” Health Affairs, June 25, 2015, http://www.healthaffairs.org/healthpolicybriefs/brief.php?brief_id=140.
8. See Stephanie Strom and Sabrina Tavernise, “F.D.A. to Require Calorie Count, Even for Popcorn at the Movies,” New York Times, November 24, 2014, http://www.nytimes.com/2014/11/25/us/fda-to-announce-sweeping-calorie-rules-for-restaurants.html.
9. See Department of Health and Human Services, Food and Drug Administration, “Food Labeling; Nutritional Labeling of Standard Menu Items in Restaurants and Similar Retail Food Establishments,” Federal Register 79, no. 230 (December 1, 2014): 71156, https://www.gpo.gov/fdsys/pkg/FR-2014-12-01/pdf/2014-27833.pdf; and Department of Health and Human Services, Food and Drug Administration, “Food Labeling; Nutritional Labeling of Standard Menu Items in Restaurants and Similar Retail Food Establishments; Extension of Compliance Date,” RIN 0910-AG57, (December 1, 2015), https://s3.amazonaws.com/public-inspection.federalregister.gov/2015-16865.pdf.
10. Food and Drug Administration, “Food Labeling; Nutrition Labeling of Standard Menu Items in Restaurants and Similar Retail Food Establishments; Calorie Labeling of Articles of Food in Vending Machines; Final Rule,” Federal Register 79, no. 230 (2014): 71156–259.
11. See Jane Furse, “Mayor Bloomberg’s 2008 Calorie-posting Has Caused Drop in High-calorie Intake: Reports,” New York Daily News, February 28, 2011, http://www.nydailynews.com/new-york/mayor-bloomberg-2008-calorie-posting-caused-drop-high-calorie-intake-reports-article-1.139154.
12. B. Bollinger, P. Leslie, and A. Sorensen, “Calorie Posting in Chain Restaurants,” American Economic Journal: Economic Policy 3, no. 1 (2011): 91–128.
13. Ibid.
14. See, for example, R. J. Reynolds Tobacco Company, et al. v. Food and Drug Administration, et al., 11 F.3d 5332 (D.C. Cir. 2012), https://www.cadc.uscourts.gov/internet/opinions.nsf/4C0311C78EB11C5785257A64004EBFB5/$file/11-5332-1391191.pdf, where the Court concluded “FDA has not provided a shred of evidence … showing that the graphic warnings will ‘directly advance’ its interest in reducing the number of Americans who smoke.” See J. P. Benway, “Banner Blindness: The Irony of Attention Grabbing on the World Wide Web,” Proceedings of the Human Factors and Ergonomics Society Annual Meeting 42, no. 5 (1998): 463–67.
15. Jonathan Cantor, Alejandro Torres, Courtney Abrams, and Brian Elbel, “Five Years Later: Awareness of New York City’s Calorie Labels Declined, With No Changes in Calories Purchased,” Health Affairs 34, no. 11 (2015): 1893–900.
16. Bollinger et al., “Calorie Posting in Chain Restaurants.”
17. Other studies often rely on empirical methods that potentially suffer from selection bias or omitted variables bias. For example, Mary Basset et al. examine purchasing behavior of restaurant patrons, and find that those who buy food at Subway (which posted calorie information at point of purchase) and viewed the calorie information purchased 52 fewer calories than did other Subway patrons (713.8 calories versus 765.5 calories). Of course, those with healthier eating habits may be both more likely to seek calorie information and make healthier purchases. See Mary T. Bassett, Tamara Dumanovsky, Christina Huang, Lynn D. Silver, Candace Young, Cathy Nonas, Thomas D. Matte, Sekai Chideya, and Thomas R. Frieden, “Purchasing Behavior and Calorie Information at Fast-Food Chains in New York City, 2007,” American Journal of Public Health 98, no. 8 (August 2008): 1457–59, http://www.ncbi.nlm.nih.gov/pmc/articles/PMC2446463/.
18. Matthew W. Long, Deirdre K. Tobias, Angie L. Cradock, Holly Batchelder, and Steven L. Gortmaker, “Systematic Review and Meta-analysis of the Impact of Restaurant Menu Calorie Labeling,” American Journal of Public Health 105, no. 5 (2015): E11-24.
19. P. Deb and C. Vargas, “Who Benefits from Calorie Labeling? An Analysis of Its Effect on Body Mass,” NBER Working Paper no. 21992 (February 2016).
20. Bollinger et al., “Calorie Posting in Chain Restaurants.”
21. See Digital Signage Federation, “Primary Benefits of Digital Signage/Menu Boards for Restaurants and QSR Locations,” http://www.digitalsignagefederation.org/Resources/Documents/Articles%20and%20Whitepapers/Primary_Benefits_DSMenuBoards.pdf, where the first benefit listed is “Ease of Menu Changes to Accommodate New Local, State, Federal & International Menu Board Regulations Regarding Ingredients.”.
22. See U.S. Food and Drug Administration, “Questions and Answers on the Menu and Vending Machines Nutrition Labeling Requirements,” December 2, 2015, http://www.fda.gov/Food/IngredientsPackagingLabeling/LabelingNutrition/ucm248731.htm for examples of items that would have to be covered.
23. Bollinger et al., “Calorie Posting in Chain Restaurants.”
24. See “An Act to Add Section 114094 to the Health and Safety Code, Relating to Food Facilities,” California SB 1420 (2008), http://www.leginfo.ca.gov/pub/07-08/bill/sen/sb_1401-1450/sb_1420_bill_20080903_enrolled.html.
25. E. L. Glaeser, “Paternalism and Psychology,” University of Chicago Law Review 73, no. 1 (2006): 133–56.
26. See “Mayor Bloomberg, Deputy Mayor Gibbs and Health Commissioner Farley Release New Data Highlighting Strong Relationship between Sugary Drink Consumption and Obesity,” City of New York, March 11, 2013, http://www1.nyc.gov/office-of-the-mayor/news/088-13/mayor-bloomberg-deputy-mayor-gibbs-health-commissioner-farley-release-new-data-highlighting; Michael Bloomberg, “Mayor Bloomberg Signs Legislation Reinforcing Board of Health’s Trans Fat Restriction,” remarks, New York City, March 28, 2007, http://www.nyc.gov/portal/site/nycgov/menuitem.c0935b9a57bb4ef3daf2f1c701c789a0/index.jsp?pageID=mayor_press_release&catID=1194&doc_name=http%3A%2F%2Fwww.nyc.gov%2Fhtml%2Fom%2Fhtml%2F2007a%2Fpr091-07.html&cc=unused1978&rc=1194&ndi=1; “Mayor Bloomberg, Public Advocate Deblasio, Manhattan Borough President Stringer, Montefiore Hospital CEO Safyer, Deputy Mayor Gibbs, and Health Commissioner Farley Highlight Health Impacts of Obesity,” City of New York, June 5, 2012, http://www.nyc.gov/portal/site/nycgov/menuitem.c0935b9a57bb4ef3daf2f1c701c789a0/index.jsp?pageID=mayor_press_release&catID=1194&doc_name=http%3A%2F%2Fwww.nyc.gov%2Fhtml%2Fom%2Fhtml%2F2012a%2Fpr200-12.html&cc=unused1978&rc=1194&ndi=1; Karen Harned, “The Michael Bloomberg Nanny State in New York: A Cautionary Tale,” Forbes, May 10, 2013, http://www.forbes.com/sites/realspin/2013/05/10/the-michael-bloomberg-nanny-state-in-new-york-a-cautionary-tale/#d2424681c6a5/.
27. See Centers for Disease Control and Prevention, “Behavioral Risk Factor Surveillance System,” February 1, 2016, http://www.cdc.gov/brfss/.
28. The CDC reports that one data limitation of the Behavioral Risk Factor Surveillance System is that “Reliance on self-reported heights and weights to calculate the BMI is likely to underestimate average BMI and the proportion of the population in higher BMI categories in population surveys.” See Centers for Disease Control and Prevention, “Diabetes Public Health Resource: Methods and Limitations,” October 15, 2014, http://www.cdc.gov/diabetes/statistics/comp/methods.htm. It is possible that the small, temporary effects of menu mandates are due to temporarily changing social norms or awareness, rather than an actual temporary reduction in body weight. There is little reason to think, however, that people that people in cities with menu mandates systematically differ in their reporting of weight compared to those in other cities. Also, even if people understate their weight in levels, it isn’t clear that changes in weight (i.e., from the difference-in-difference framework) will be affected. If everyone reports their weight as 5 lbs. lower than it really is, the change in body weight pre/post menu mandate will be unaffected. In either case, the effects fade out quickly.
29. See Centers for Disease Control and Prevention, Division of Nutrition, Physical Activity, and Obesity, “About Adult BMI,” May 15, 2015, http://www.cdc.gov/healthyweight/assessing/bmi/adult_bmi/.
30. See Centers for Disease Control and Prevention, Division of Nutrition, Physical Activity, and Obesity, “Adult Obesity Facts,” September 21, 2015, http://www.cdc.gov/obesity/data/adult.html.
31. See Cass Sunstein, “Don’t Give Up on Fast-Food Calorie Labels,” Bloomberg View, November 3, 2013, http://www.bloombergview.com/articles/2015-11-03/don-t-give-up-on-fast-food-calorie-labels.
32. The Annual Survey Data is publicly available at Centers for Disease Control and Prevention, “The Behavioral Risk Factor Surveillance System,” September 15, 2015, http://www.cdc.gov/brfss/annual_data/annual_data.htm.
33. This description comes directly from Centers for Disease Control and Prevention, “Behavioral Risk Factor Surveillance System Overview 2012,” July 15, 2013, http://www.cdc.gov/brfss/annual_data/2012/pdf/overview_2012.pdf.
34. See U.S. Department of Health and Human Services, National Institutes of Health, “Calculate Your Body Mass Index,” http://www.nhlbi.nih.gov/health/educational/lose_wt/BMI/bmicalc.htm.
35. C. Courtemanche and D. Zapata, “Does Universal Coverage Improve Health? The Massachusetts Experience,” Journal of Policy Analysis and Management 33, no. 1 (2014): 39–69.
36. The 2013 and 2014 BRFSS data does not include county identifiers.
37. See U.S. Census Bureau, “American Fact Finder,” http://factfinder.census.gov/faces/nav/jsf/pages/index.xhtml. The cities include New York; Los Angeles; Chicago; Houston; Philadelphia; Phoenix; San Antonio; San Diego; Dallas; San Jose; Austin; Jacksonville; Indianapolis; San Francisco; Columbus; Fort Worth; Charlotte; Detroit; El Paso; Memphis; Boston; Seattle; Denver; Washington, D.C.; Nashville; Baltimore; Louisville; Portland; Oklahoma City; and Milwaukee.
38. U.S. Census Bureau, Population Division, “Annual Estimates of the Resident Population for Incorporated Places Over 50,000, Ranked by July 1, 2012, Population: April 1, 2010 to July 1, 2012,” May 2013.
39. All statistics are unweighted. Other characteristics, such as age, vary within the sample over time. Such characteristics are controlled for in the regressions.
40. See, for example, Aaron Yelowitz, “The Medicaid Notch, Labor Supply, and Welfare Participation: Evidence from Eligibility Expansions.” Quarterly Journal of Economics 110, no. 4 (1995): 909–39; James Marton, Aaron Yelowitz, and Jeffrey C. Talbert, “A Tale of Two Cities? The Heterogeneous Impact of Medicaid Managed Care,” Journal of Health Economics 36, no. 1 (July 2014): 47–68; and James Marton and Aaron Yelowitz, “Health Insurance Generosity and Conditional Coverage: Evidence from Medicaid Managed Care in Kentucky,” Southern Economic Journal 82, no. 2 (October 2015): 535–55.
41. See “Menu-Labeling Laws,” Menu-Calc, http://www.menucalc.com/menulabeling.aspx. Nashville passed, but did not implement, a menu mandate. Several other counties in New York passed menu mandates, but none of the cities in those counties are in the top 30 cities.
42. With the exception of Portland, Oregon, neither Maine’s law nor Oregon’s law affected any of the 30 largest cities.
43. A. Colin Cameron, Jonah B. Gelbach, and Douglas L. Miller, “Robust Inference with Multiway Clustering,” Journal of Business & Economic Statistics 29, no. 2 (2011): 238–49.
44. Bollinger et al., “Calorie Posting in Chain Restaurants.”
45. Ibid.
46. In addition, all specifications have been estimated also including city-specific time trends. The key substantive conclusion—that such mandates have small or insignificant effects on BMI and other outcomes—holds even more forcefully with the inclusion of such trends.
47. See U.S. Department of Health and Human Services, National Institutes of Health, “Calculate Your Body Mass Index,” http://www.nhlbi.nih.gov/health/educational/lose_wt/BMI/bmicalc.htm.
48. Bollinger et al., “Calorie Posting in Chain Restaurants.”
49. Ibid.
50. Ibid.
51. J. A. Driskell, B. R. Meckna, and N. E. Scales, “Differences Exist in the Eating Habits of University Men and Women at Fast-food Restaurants,” Nutrition Research 26, no. 10 (2006): 524–30.
52. E. Kroshus, “Gender, Marital Status, and Commercially Prepared Food Expenditure,” Journal of Nutrition Education and Behavior 40, no. 6 (2008): 355–60.

About the Author
