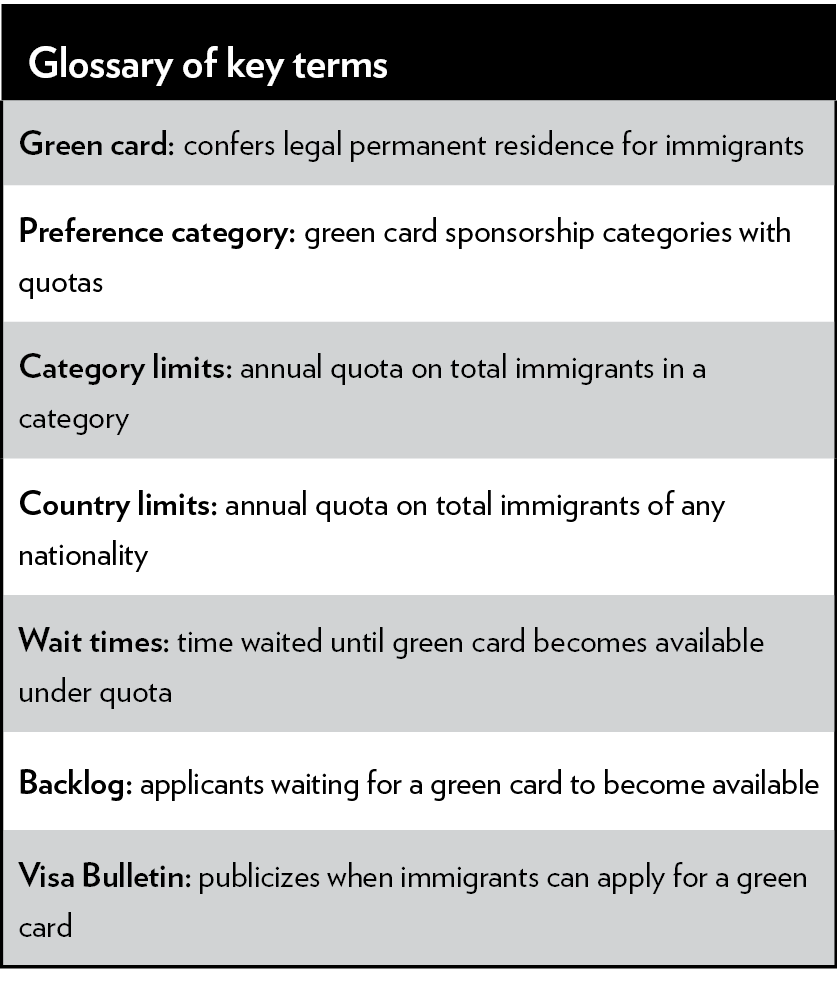
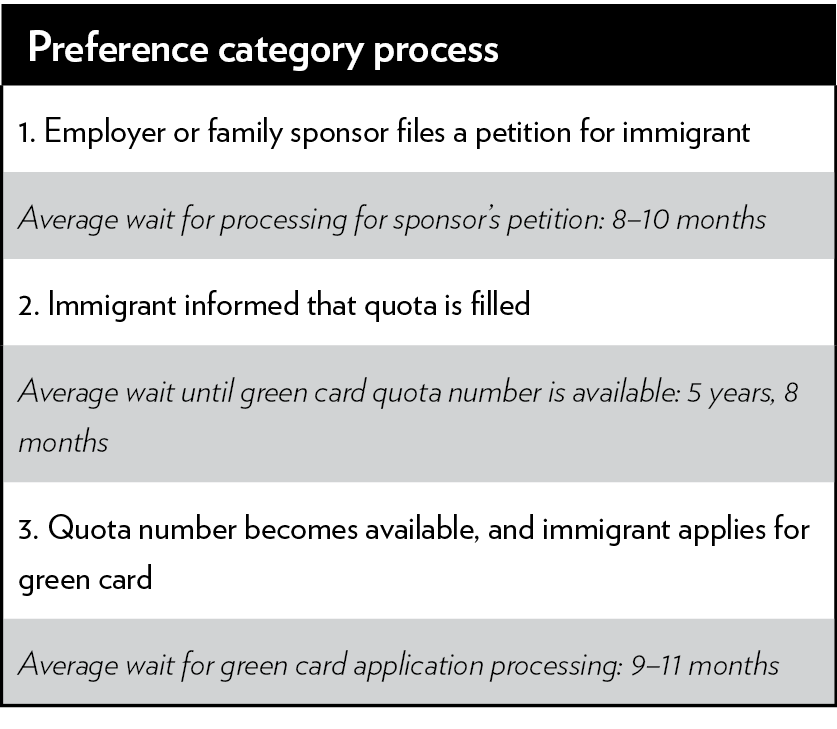
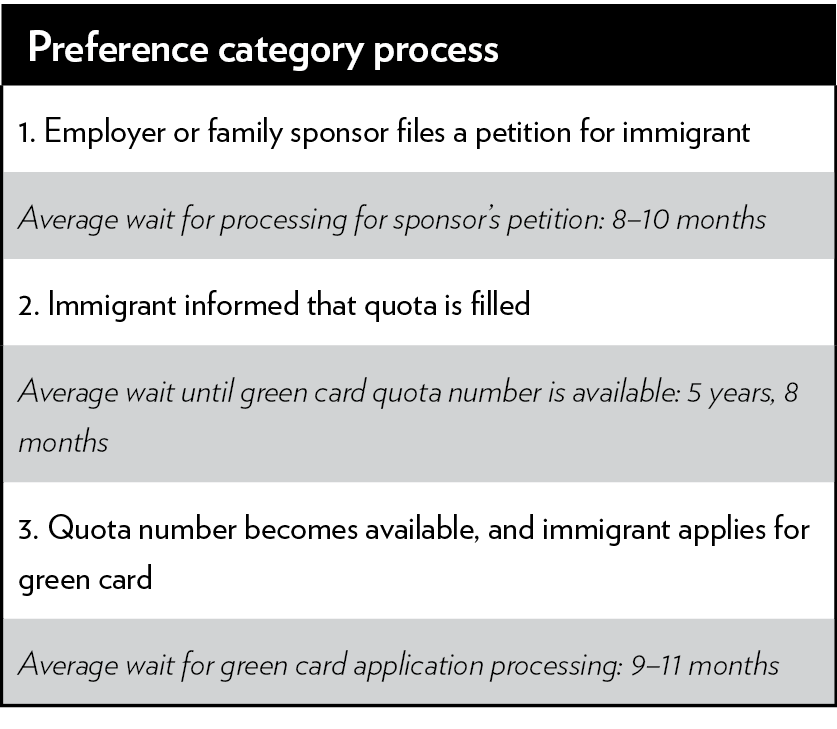
Legal immigrants to the United States can face two different types of waits. Every immigrant must deal with the first type: the time it takes for the government to process petitions and applications for green cards (i.e., legal permanent residence). By itself, the administrative processing wait generally took more than a year and a half in 2018 — first to wait for an approval for the immigrant’s sponsor and then for an approval for the immigrant.1 But a third of all legal immigrants face a second type of wait between their sponsor’s petition and their own application: the time it takes for a green card to become available under the immigration quotas. Because Congress limited the number of green cards for certain types of immigrants, not everyone who receives an approval after the first wait can apply for a green card immediately. Like customers at a deli, they wait for their number to be called.
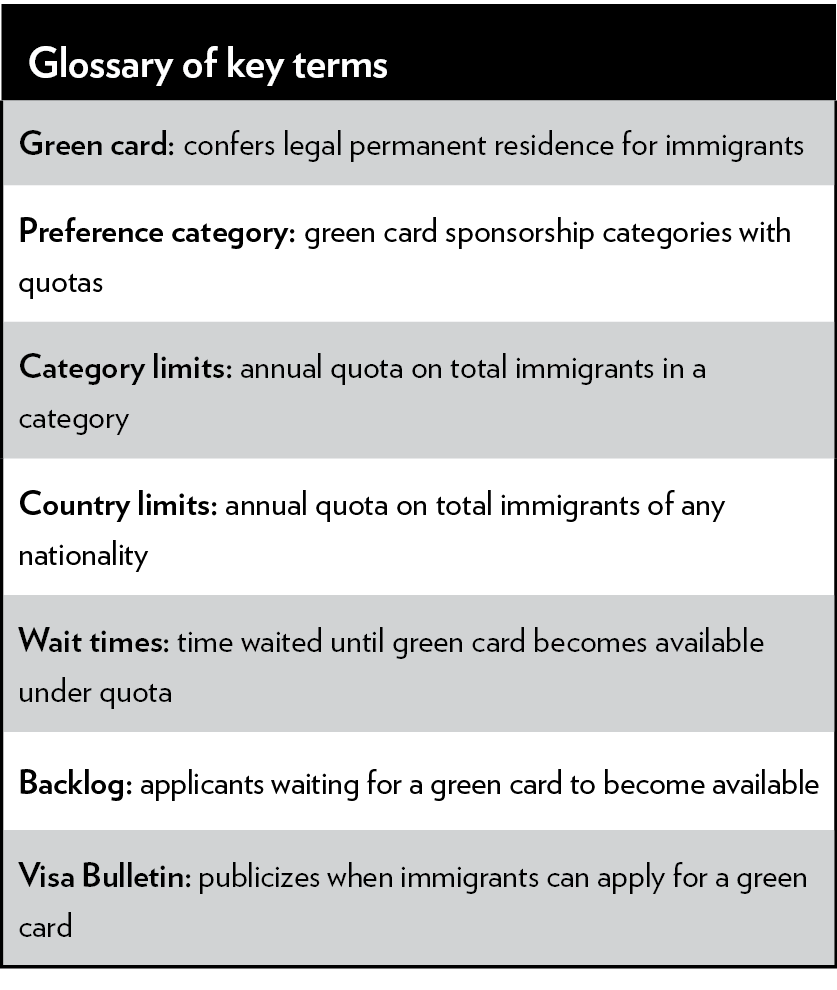
This policy analysis describes the second type of wait: the one caused by the unavailability of green cards due to quotas, not bureaucratic delays. The immigration categories with quotas and waiting lists are the “preference categories.” The preference quota categories account for a third of all permanent immigration to the United States — about 366,000 slots annually.2 These immigration lines are known as preference categories because the system prioritizes applicants according to different family and employment “preferences.”3 Table 1 lists each preference, along with its category limits. The law also limits the number of green cards that any single nationality may receive: no more than 7 percent of the total (25,620), plus any unused green cards distributed to nationals on a first-come, first-served basis in a given category.4
These nationality-based quotas are known as the country limits. The country limits result in each nationality waiting in lines that move at different speeds within each category. The wait time for Mexican siblings of U.S. citizens is different from that of Filipino siblings of U.S. citizens, and both wait times differ from those of Mexican or Filipino spouses of legal permanent residents. For the most part, just four nationalities — Indians, Chinese, Filipinos, and Mexicans — reach the country limits. When a nationality reaches the country limit, nationals of other countries pass them in the line.
Each month, the State Department publishes the Visa Bulletin, which informs immigrants who entered the line before a certain date that they may now apply for a green card. For example, in October 2018, the date for Mexican-born siblings of U.S. citizens was January 22, 1998, meaning that Mexican-born siblings had waited about two decades for the chance to apply for a green card. In October 1991, the date for this category was January 1, 1979, meaning that immigrants applying for green cards in that category had, at that time, waited only about 12 years.5 The average for the entire year provides the basis for the estimates below. The current quotas went into effect in October 1991, so estimates for 1991 are based on October to December of that year.
The average wait time to apply for a green card in all preference categories has doubled since 1991. Although the waits vary across categories, Figure 1 shows the average wait time for all preference immigrants — family-sponsored and employment-based — who applied for a green card in 1991 and 2018 (weighted based on category and country of birth). From 1991 to 2018, the average immigrant in the preference categories waited 4 years and 10 months for a green card. The average wait for all preference immigrants grew from about 2 years and 10 months in 1991 to about 5 years and 8 months in 2018 — a 97 percent increase. Overall wait times for immigrants have grown much longer over the past three decades.
The overall averages disguise significant variation among individual applicants in the backlog. In 1991, 31 percent of immigrants in the preference categories had no wait at all due to the quotas (Figure 2). In 2018, that share had fallen to just 2 percent. In 1991, just 3 percent of applicants waited a decade or more to apply for a green card. By 2018, 28 percent waited a decade or more, and 41 percent waited at least five years. Applicants with exceptionally long waits have become normal in America’s legal immigration system.
The variance in outcomes for individuals in the backlog stems from two sources: different quotas for each category (“category limits”) and identical quotas for each nationality in each category (“country limits”). Both limitations fail to align the supply of green cards with demand for them. This failure produces wildly differing outcomes depending on what category the immigrant is in (i.e., who is sponsoring them) and where the applicant was born.
Figure 3 shows the average wait times for family preference immigrants in 1991 and 2018. The average time waited for all family preference immigrants in 2018 was about 8 years and 1 month, up from about 4 years and 3 months — an 88 percent increase. While the average wait for family-sponsored immigrants nearly doubled, the waits for unmarried adult children of citizens (F1) and those for married adult children of citizens (F3) increased tenfold and sixfold, respectively. In absolute terms, waits for F3 rose the most — by an additional 11 years and 5 months. Meanwhile, the waits for spouses and minor children of legal permanent residents (F2A) actually declined. The category for siblings of adult U.S. citizens (F4) had the longest average wait in 2018: 14 years and 7 months.
The average wait time in the employment-based categories grew more than sevenfold — from just 3 months in 1991 to 1 year and 9 months in 2018 (Figure 4). Only the EB3O category for workers without a college degree saw a decrease in the wait since 1991. The other five categories saw their wait times increase. Among the employment-based categories, bachelor’s degree holders employed by U.S. businesses waited longest: 2 years and 4 months for a green card in 2018. The next-longest average category wait was in the EB5 category for investors creating at least 10 jobs who had waited an average of 1 year and 8 months in 2018.
The country limits — which cap the number of green cards for any particular nationality at 7 percent of the total number — artificially inflate the longest waits, while artificially deflating the average wait. This deflation effect happens because, once a nationality bumps up against the country limit, nationals from other countries pass them in the line. For example, because Indians have reached the country limits in the EB2/EB3 categories for employees of U.S. businesses with bachelor’s and master’s degrees, the law requires them to wait about a decade, while applicants from all other countries except China may apply for their green cards almost immediately, cutting ahead of Indians in the line. Under this inequitable system, the longest wait can grow much longer, but the average wait only increases slightly, since 93 percent of the line may be unaffected by the limits. Ever greater numbers of applicants pile up in the line for the nationalities at the country limit, while nationals of other countries apply for green cards in roughly the same amount of time.
Paradoxically, the longest waits in the employment-based preferences can grow, even while the average wait time actually shortens. This can happen because the law allows nationalities in those categories to receive green cards above their country limits if not all the green cards in the category would otherwise be used. If a nationality goes above the country limit in one year and then more applicants apply from other countries in the next year, the new applicants can cut into the greater numbers that the nationality with the longest wait was previously receiving. Thus, the share of applicants with no wait time increases, while the share with the longest wait time decreases. The result is a shorter average wait time for all applicants but a much longer one for those with the longest wait. From 2017 to 2018, for example, the longest wait in the EB5 category for investors in U.S. businesses grew from 2 years and 6 months to 3 years and 4 months, yet the average wait fell from 1 year and 11 months to 1 year and 7 months because the share of EB5 green cards for Chinese investors dropped from 75 percent to 48 percent.6
The country limits generally affect only four nationalities: Chinese, Indians, Mexicans, and Filipinos.7 Figure 5 highlights the disparity between the average wait times for the top four nationalities and the waits for all other nationalities in 1991 and 2018. The waits grew the most for Indians — 4 years and 6 months since 1991 — followed by Mexicans, whose waits increased by 3 years and 2 months. The average wait for all other nationalities increased by 2 years and 4 months since 1991. In 2018, Indians also waited the longest: 8 years and 6 months — nearly double the average wait of 4 years and 6 months for all nationalities not at the country limits.
The category limits and country limits operate together to create even more widely variant outcomes across the entire immigration system. Figure 6 shows all preference immigrants in categories with waits longer than the average for all categories (5 years and 8 months). Filipino siblings of adult U.S. citizens (F4) who applied for green cards in 2018 waited the longest — 23 years. They originally entered the line for green cards in 1995. Just behind them were F3 Filipino and Mexican adult married children of U.S. citizens who each waited more than 22 years for their green cards. The longest employment-based line was for Chinese and Indian employer-sponsored immigrants lacking a bachelor’s degree (EB3O), Indian professionals with a college degree (EB3), and Indian advanced-degree holders (EB2), who all waited about a decade to apply for their green cards in 2018.
Figure 7 shows how wait times have increased since 1991 for nationalities with the longest wait in each category in 2018. The largest increase — 20 years and 7 months — occurred for F1 Mexican unmarried adult children of U.S. citizens, whose wait time rose from 4 months in 1991 to 20 years and 11 months in 2018. In the employment-based categories, EB3 Indian employees of U.S. businesses saw their wait increase more than any other EB category, from no wait to 10 years and 6 months.
The lengthy wait times cause many applicants to pile up in a backlog awaiting their chance to apply for green cards. The most recent statistics on the number of approved applicants indicate that about 4.7 million applicants are waiting for green cards because of the quotas — 83 percent in the family preferences and 17 percent in the employment-based preferences (Table 2).8 One category — siblings of adult U.S. citizens — accounts for half the entire backlog. As Table 2 shows, there is a significant mismatch between the share of available green cards in each line and the share of applicants in each line.
Table 3 shows the backlogs by nationality. Mexican applicants account for 28 percent of the backlog in the preference categories. Indians accounted for 19 percent, and another 19 percent were born either in the Philippines, China, or Vietnam. Applicants from all other countries amount to about a third of the total. While the distribution in the family preference categories is similar, the employment-based backlogs are filled almost entirely by people born in India (78 percent) or China (17 percent).
The backlog has grown significantly since 1991. While only partial data is available, the number of people waiting for immigrant visas abroad — primarily family-sponsored immigrants — has grown from 2.9 million in 1992 to 3.7 million in 2017.9 These numbers do not include people waiting for green cards in the United States — primarily employer-sponsored immigrants who work on temporary visas while their green card applications are pending. Based on the increases in wait times for these categories, the backlogs for these types of immigrants have also grown significantly.
Whereas it may have taken immigrants an average of 5 years and 8 months to immigrate in 2018, the backlogs mean that immigrants who are applying for the first time right now may have to wait much longer. The government makes no attempt to estimate these future waits. Table 4 highlights how long it would take to process everyone currently in the backlogs by nationality and category if everyone stays in the line. As it shows, applicants in several lines face multidecade waits if they stick it out indefinitely. In fact, EB2/EB3 Indian employees of U.S. businesses who entered the line in 2018 have an impossible half-century-long wait, and Mexican and Filipino married adult children of U.S. citizens and Mexican siblings of U.S. citizens face a full century in the backlog.
The waits are so long that many people waiting for green cards will die before they can even apply. Table 4 also shows how many applicants would die waiting based on the average age distribution of immigrants in 2018 and the average mortality rate by age.10 As the population grows older, the death rate increases with each passing year until all immigrants have either received green cards or died. Altogether, about 675,000 would-be legal immigrants — 14 percent of those waiting in 2018 — will die without seeing a green card if they refuse to give up and stay in the line indefinitely.
Those near the back of the longest lines will have to find another way to receive permanent residence — for example, by marrying a U.S. citizen and thus bypassing the quota categories. Of course, many immigrants will give up rather than wait for a green card that may never come. To account for attrition, Figure 8 projects how long the average preference immigrant will have waited to apply for a green card in 2038, assuming that the linear trends from 2008 to 2018 continue. If current trends continue, the average wait will increase from 5 years and 8 months in 2018 to 7 years and 8 months in 2038.
Waits for specific nationalities will grow even more disproportionate under current trends. Nationalities in about a dozen categories will have waited multiple decades for a green card in 2038 (Figure 9). This means that immigrants entering those lines in 2018 will likely not apply for their green cards until 2038 or later. For F3 Mexican and Filipino married adult children of U.S. citizens, the wait is projected to rise to 36 years, meaning that applicants who applied in 2003 or later will still be waiting for their green cards in 2038. The share of immigrants receiving green cards under the quotas who wait more than two decades will rise from 3 percent to 15 percent by 2038.
The current trends could change, so it is worth making a more detailed assessment to explore how the wait times could change in a couple of specific categories. The following factors all affect how long it will take to process everyone in these backlogs for any particular nationality: (1) marriages, (2) children, (3) deaths, (4) abandonment of applications, and (5) the number of green cards made available for each nationality. Getting married could increase or decrease the waits. Because the law gives spouses of immigrants the same place in line as the primary applicant, getting married to a noncitizen would increase the backlog. On the other hand, if the spouse is a U.S. citizen, the spouse can sponsor the immigrant for a green card immediately, which would reduce the backlog.
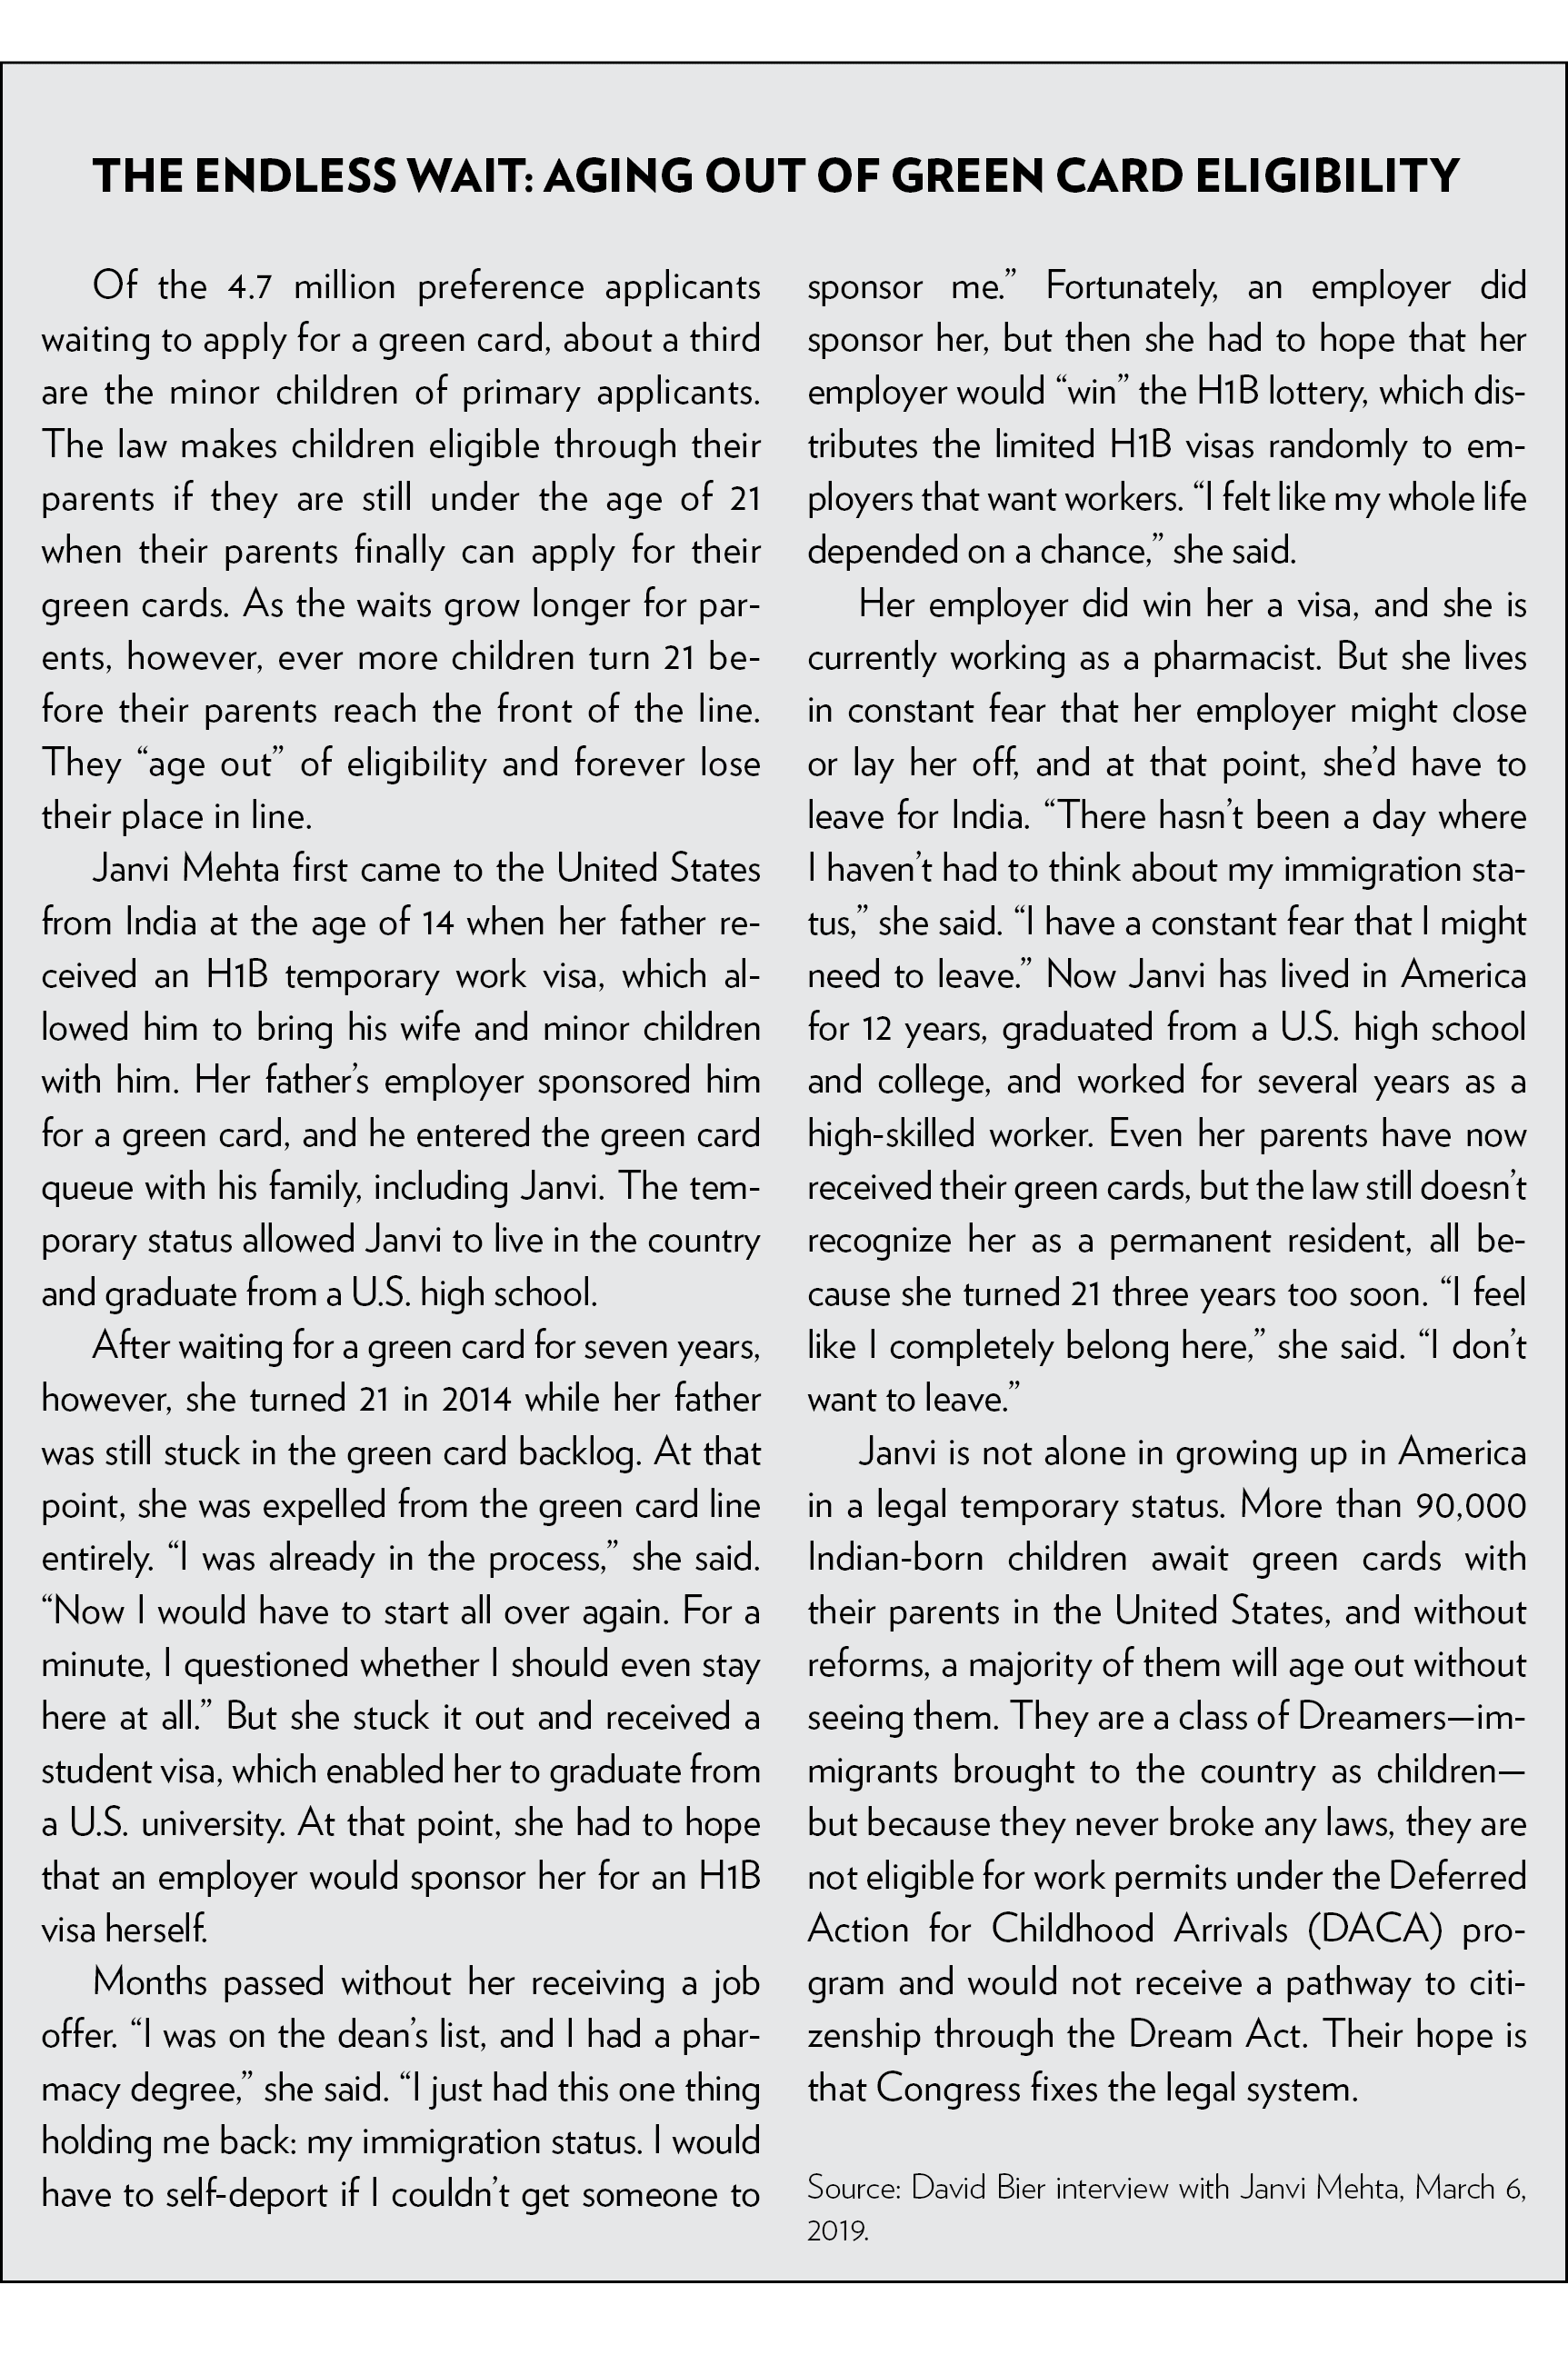
Children also have an equivocal effect on future wait times. The law entitles children under the age of 21 to the same place in line as their parents. This means that, in cases where the child turns 21 before the parent is able to apply for a green card, the child loses eligibility, reducing the wait times (at least for the parent — for the child, the wait becomes infinite, as he or she will have lost eligibility entirely). If children are born in the United States, they are U.S. citizens, and if their parents remain in the United States for more than 20 years legally, the law allows U.S. citizens to sponsor their parents for green cards immediately upon their 21st birthdays, which would also reduce the backlog. On the other hand, giving birth to children outside the United States would increase the backlog because those children would be entitled to the same place in line as their parents. Deaths and abandoned applications obviously reduce the backlog, while the availability of green cards for a particular nationality under the country limit could increase or decrease the projected waits, depending on whether a greater or lesser number of green cards is made available in future years than recently.
To use a concrete example, current EB2 and EB3 immigrants from India — employees of U.S. businesses with bachelor’s or master’s degrees, respectively — have waited 9 and 10 years, respectively. However, about 543,152 applications have been approved for Indian immigrants in the EB2 and EB3 lines, and nearly all of them are working in the United States on work visas that can be renewed indefinitely. About 80 percent of them are in the EB2 line, but because all EB2 applicants can also qualify under EB3 — as EB2 immigrants have both a master’s and bachelor’s — the lines will tend to equalize over time (as they have already). For this reason, it is worth treating them as a single category for purposes of projecting future wait times.
Marriages will have little effect on the EB2/EB3 backlog since most EB2/EB3 employees in the backlog are already married to foreign spouses. Moreover, while marriages to U.S. citizens decrease the backlog, marriages to foreign spouses, which are particularly common among Indian nationals, increase it. Children can have a similarly equivocal effect depending on their places of birth, but the fact that children “age out” of eligibility for derivative permanent residence through their parents’ petitions will reduce the backlog by about 45,000. Deaths will also have only a relatively small effect in the EB2 and EB3 categories over the next couple of decades, though not over the next 50 years (as Table 4 above shows) because most employment-based immigrants are in their prime working years.
The two factors that could most dramatically change the length of future waits for Indian employees of U.S. businesses — at least over the next several decades — are abandoned applications and the availability of green cards for Indians. Because the EB categories allow nationalities to move above the country limit if not all the green cards would otherwise be used, it is impossible to know exactly how many green cards Indians will receive annually going forward. Because the EB2/EB3 lines for India cumulatively used about 10,000 green cards in 2018 — higher than the country limit of 4,900 — the number of green cards for Indians could decrease in the future if demand in the EB2 and EB3 categories rises among other nationalities.
The rate of abandoned applications must be inferred indirectly. Abandoned applications would include deaths, marriages to receive green cards, and emigration due to discouragement. An I-140 petition for employer-sponsored workers starts the employment-based preference green card process, after which point the worker must wait for a green card number to become available. Since 2002 — before the EB2/EB3 backlog built up — there have been about 460,000 more I-140 petitions for employment-based workers than green cards issued. As of April 20, 2018, however, there were just 372,089 non-abandoned pending petitions — a difference of about 89,000.11 This implies an abandonment rate by those who entered the backlog for any amount of time of about 4.75 percent annually. This rate is only for the primary applicants. The rate will be much higher for their children since they would drop out when their parents leave or when they themselves turn 21 and lose eligibility. About half of all the children in the backlog in 2018 will end up aging out.12 More broadly, the total abandonment rate could increase in the future if the waits grow much longer and more people give up and leave the country.
These facts lead to three main scenarios for future wait times. At the high end, scenario 1 sees green card issuances at the country limit (4,900 annually) and the same rate of abandoned applications (4.75 percent annually). Under this scenario, it would take 36 years to process the backlog. In the middle, scenario 2 sees the same rate of abandoned applications but green card issuances above the country cap (10,000 annually). Under the midrange scenario 2, it would take 26 years to process the backlog. At the low end, scenario 3 sees the higher rate of green card issuances, but the rate of abandoned applications gradually rises at 0.2 percent annually to almost double the current rate (9.4 percent annually). Under the low-end scenario 3, it would take 24 years to process the backlog.
Figure 10 provides these three projections compared to the 10- and 15-year trends for wait times for Indians in the EB2 and EB3 lines over the next 20 years. In the low-end scenario — with high attrition and high green card issuances — the wait would increase to 21 years and 3 months by 2038 — meaning that people who applied in 2017 and 2018 would still be waiting at that time. In the midrange scenario, it would increase to 22 years and 3 months, and in the high-end scenario it would increase to 24 years and 5 months. The high-end and low-end scenarios closely align with the 15-year and 10-year linear trends, respectively. All the projections are within a range of less than 5 years. This provides some independent support for the projections based on the current linear trends reported in Figure 6.
The particularities of different categories, however, could result in strange departures from the current trends. For example, waits for EB5 investors from China will almost certainly increase far more than current trends predict. This is because Congress, in 1991, effectively reduced the Chinese EB5 country limit to zero.13 However, because nationalities may exceed their country limits in order to allow for the use of all available green cards, Chinese investors still managed to receive about half the green cards in the category in 2018.14 But the waits for Chinese have already forced firms seeking EB5 investment to look for investors elsewhere, causing demand from the rest of the world to rise. From 2014 to 2018, the share for Chinese fell from 85 percent to 48 percent.15 If the rest of the world continues to increase its share, the 65,953 Chinese investors and their families could be completely shut out of the EB5 program forever.
Lengthy wait times result in several interrelated problems. Wait times reduce the liberty of Americans to associate with people born in other countries. The waits separate U.S. citizens from their family members, prevent U.S. businesses from employing or fully utilizing the skills of foreign workers, and keep U.S. firms from receiving capital from foreign investors. Simultaneously, wait times artificially depress the rate of legal immigration to the United States. America already has a rate of immigration — controlling for population size — lower than much of the developed world, and its net immigration rate and immigrant share of the population ranked in the bottom third of wealthy countries from 2015 to 2017.16
By hampering America’s ability to compete for labor and capital around the world, wait times injure the U.S. economy. Every year that EB5 investors wait is a year in which the United States loses out on billions of dollars in foreign direct investment that grows the economy and increases demand for U.S. workers.17 Both family-sponsored and employment-based immigrants generally have higher college and high school graduation rates than the U.S. public, meaning that legal immigrants are increasing the U.S. skill level.18 According to a 2016 analysis from the National Academies of Sciences, Engineering, and Medicine, better-educated immigrants contribute significantly more in taxes than they receive in benefits, making preference immigrants a net positive to the U.S. Treasury.19 The same analysis concluded that immigrants make the GDP of the United States larger by 11 percent annually — about $2.2 trillion in 2018.20
Particularly lengthy wait times cause some foreign students to leave the United States rather than pursue green cards. As one recent study found, “The stay rate of Chinese graduates [of U.S. universities] declines by 2.4 percentage points for each year of delay, while Indian graduates facing delays of at least five and a half years have a stay rate that is 8.9 percentage points lower.”21 Because foreign students are highly skilled, higher rates of departure result in fewer startups, fewer patents, and less innovation — all of which high-skilled immigrants do at higher rates than the U.S.-born population.22
The country limits exacerbate these trends by concentrating the wait times among certain nationalities. Moreover, they perversely distort the labor market by making people with more experience and skills wait longer than other immigrants. In fact, the country limits depress the average wage offer for new employment-based immigrants by $11,592 in the EB2 and EB3 categories because the average wage offers for Indians and Chinese nationals are $27,649 and $20,750 higher, respectively, than those for other immigrants (Figure 11).23 America benefits from immigrants of all skill levels, but the market should determine which immigrants the economy needs, not government centralized planning based on the birthplace of the applicants.
Finally, foreigners who wish to permanently immigrate to the United States have very few options to do so legally. Some nationalities that are underrepresented in the U.S. immigration system can apply for the diversity visa lottery if they meet the work requirements or have a high school degree. Refugees can hope for a resettlement referral to the United States. But the odds of winning the lottery or getting a referral were just 0.2 percent in 2017.24 Most other immigration channels — like asylum and various forms of relief from deportation — are limited for people already in the United States.
Except for spouses, minor children, or parents of adult U.S. citizens (who have no numerical limits), all other legal immigrants must use the quota system. A main reason that Congress increased the quotas for the preference categories in the Immigration Act of 1990 — particularly for family-sponsored immigrants — was because it believed that this would provide an alternative to illegal immigration.25 Time has proven this theory correct. Immigrants use the preference categories as an alternative to illegal immigration and as a pathway to correct illegal status.26 Wait times undermine the goal of reducing illegal immigration, while also causing damage to the economy and separating Americans from their families.
The United States should adopt four simple reforms to prevent the wait times from growing further. First, Congress should end the country limits. Micromanaging immigration flows in this way results in highly inequitable outcomes. Similarly situated employees of U.S. businesses or family members of U.S. citizens wind up with waits that diverge wildly for no reason other than that one immigrant was born in a country with higher demand than the other. Legal immigration should be a first-come, first-served process without consideration of an immigrant’s nationality.
Removing the country limits would equalize wait times among nationalities, eliminating the extremely long waits for certain immigrants. Repealing the country limits, for example, would make the average time to process everyone in the EB2 and EB3 lines six or seven years — using the same assumptions about abandonment rates as above — compared to 24 to 36 years for Indians and roughly zero for almost everyone else except Chinese. That would produce a fairer process and give all immigrants a reason to advocate for additional reforms. As noted earlier, repealing the country limits would raise the average wage offer of green card recipients by eliminating long waits for the more experienced workers in the backlog. That would improve economic efficiency by ending discrimination against immigrants who would be more productive.
Second, Congress should link the family preference quotas to population growth and the employment quotas to economic growth. Hard caps make little sense in a world that is constantly changing. Since Congress passed the Immigration Act of 1990 that determined the current quotas, the U.S. population has grown by a third and the U.S. economy has more than doubled in size.27 It makes sense to link the overall family preference quotas to population growth because the need for family-sponsored green cards grows with the population. On the other hand, if the U.S. population begins to decline and America’s growing economy needs even more workers, the employment-based preference quotas should be tied to growth in U.S. GDP.
Third, Congress should explicitly exempt derivative applicants — spouses and minor children of primary applicants (e.g., employees of U.S. businesses) — from the quotas. Current law entitles these immediate family members to the same status as their parent or spouse. In 2017, about 45 percent of all green cards in the preference categories went to derivatives, not the primary applicant.28 It makes no sense to lengthen wait times for primary applicants simply because they marry someone or have children while they are waiting for a green card.
Had derivatives not been charged against the green card limits since 1991, the waits and backlogs would have been eliminated. For example, the EB2/EB3 backlog has grown to nearly 600,000 applicants — primary and derivative — which is 810 percent larger than the total number of green cards issued annually in those categories. Yet an average of 52,000 green cards per year have gone to spouses and children of the employees (about 800,000 total), meaning that if the administration had not counted those applicants against the quotas, the backlog would have never developed at all. In 2017, excluding spouses and children of preference category immigrants from the count would have amounted to an increase in overall legal immigration of roughly 318,000 or 28 percent.
Fourth, Congress should enact a guarantee that immigrants will not have to wait longer than five years for a green card. If the measures above do not prevent wait times from creeping back up, the law should automatically grant a green card to someone who has waited for five years or more. That would preserve the viability of each immigration category and prevent immigrants from abandoning the legal option entirely.
The average immigrant’s wait time for a green card was nearly twice as long in 2018 as it was in 1991 when the quotas were first implemented. The share of those waiting more than a decade increased nearly tenfold, and many immigrants already wait more than 20 years because of the quotas. Wait times for immigrants will continue to grow year after year as a result of America’s antiquated legal immigration quotas, and many immigrants who are applying right now will not see their green cards for decades, if ever. Today, almost five million immigrants are waiting for green cards in a fundamentally broken legal system.
The current quotas fail to respond to changes in America’s population or economy, and the waits reflect this disconnect. The country limits create massive inequities between identical immigrants who happen to have different birthplaces. For this reason, these limits have no place in a modern immigration system. Congress should eliminate the country quotas, exempt spouses and minor children from the overall quotas, and instead link quotas to population and economic growth. America needs a flexible and adaptive immigration system for the 21st century.
1 Combined processing times for I-140 Petition for Alien Worker (no premium processing) and an EB I-485 Adjustment of Status was 17 months. Combined processing times for I-130 Petition for Alien Relative and an FB I-485 Adjustment of Status was 20.6 months. U.S. Citizenship and Immigration Services, “Historical National Average Processing Time for All USCIS Offices.”
22017 Yearbook of Immigration Statistics, Table 6, “Persons Obtaining Lawful Permanent Resident Status by Type and Major Class of Admission,” Department of Homeland Security.
3 Under U.S. immigration law, only spouses, minor children, and parents of adult U.S. citizens, as well as a few humanitarian categories, receive green cards without a quota — they face only the first wait. While refugees and diversity lottery applicants do have quotas, the government only accepts applications from the number it plans to admit each year. As a result, no backlog of applicants develops for them. For these reasons, the only major categories of immigrants who deal with quota-caused waits are those entering through the family-sponsored and employment-based “preference” categories.
4 8 U.S. Code § 1152(a).
5 If moving forward the date to apply causes an unexpectedly large surge in applicants — more than the quotas can accommodate — the government will occasionally move the date back suddenly several years. This obviously does not mean that the wait suddenly jumped several years in a single month. It is just the government’s way to stop new applications. To account for this type of movement in the final action dates, this policy analysis uses the annual average to smooth out the changes in the priority dates.
6 The U.S. Department of State released these figures early in response to a lawsuit affecting EB-5 investors. Other 2018 green card numbers are estimated using 2017 figures. Charles Oppenheim, “Declaration of Charles W. Oppenheim,” Feng Wang, et al., v. Michael Pompeo, et al., No. 18-1732, August 24, 2018, p. 4.
7 Vietnam in the EB5 category and Guatemala, Honduras, and El Salvador in the EB4 category are also affected.
8 U.S. Department of State, National Visa Center, “Annual Report of Immigrant Visa Applicants in the Family-Sponsored and Employment-Based Preferences Registered at the National Visa Center as of November 1, 2018.”
9 Cornelius D. Sully, “Various Determinations of Numerical Limits on Immigrants Required under the Terms of the Immigration and Nationality Act as Amended by the Immigration Act of 1990,” Center for Migration Studies, In Defense of the Alien, vol. 16 (1993), p. 13; and U.S. Department of State, “Annual Report of Immigrant Visa Applicants in the Family-Sponsored and Employment-Based Preferences Registered at the National Visa Center as of November 1, 2018.”
10 For employment-based immigrants, this assumes the age distribution of H-1B workers, and for family-sponsored, the age distribution of all legal immigrants in 2017. Number of deaths account for “aging out” in the employment-based lines, but not the family-sponsored lines since every aged-out child will likely be replaced by a child born abroad. This replacement rarely happens in the EB lines because EB workers are almost entirely already in the United States in temporary statuses, so their new children are born in the United States. U.S. Citizenship and Immigration Services, “Characteristics of H-1B Specialty Occupation Workers,” Department of Homeland Security, April 9, 2018; and 2017 Yearbook of Immigration Statistics, Table 8, “Persons Obtaining Lawful Permanent Resident Status by Sex, Age, Marital Status, and Occupation: Fiscal Year 2017.” Deaths estimated based on mortality rates from Felicitie C. Bell and Michael L. Miller, “Life Tables for the United States Social Security Area 1900–2100,” Actuarial Study No. 120, Social Security Administration, August 2005.
11 Green cards for employment-based applicants from Yearbook of Immigration Statistics, 2002–2017. Approved I-140 petitions estimated based on partial year statistics for 2007 and based on total completions for 2008–2011. For I-140 petitions from 2002 to 2007: Citizenship and Immigration Services Ombudsman, “Annual Report 2007,” June 11, 2007. For I-140 petitions from 2008 and 2009: Citizenship and Immigration Services Ombudsman, “Annual Report 2010,” June 30, 2010. For I-140 petitions from 2010 to 2011: U.S. Citizenship and Immigration Services, “Fiscal Year 2011 Highlights Report.” For I-140 petitions from 2012 to 2017: U.S. Citizenship and Immigration Services, “Data Set: All USCIS Application and Petition Form Types,” October 30, 2018.
12 Using the age distribution for children from 2017 Yearbook of Immigration Statistics, Table 8, “Persons Obtaining Lawful Permanent Resident Status by Sex, Age, Marital Status, and Occupation: Fiscal Year 2017.”
13 The Chinese Student Protection Act of 1991, Pub. L. 102-404.
14 The U.S. Department of State released these figures early in response to a lawsuit affecting EB-5 investors. Other 2018 green card numbers are estimated using 2017 figures. Charles Oppenheim, “Declaration of Charles W. Oppenheim,” Feng Wang, et al., v. Michael Pompeo, et al., No. 18-1732, August 24, 2018, p. 4.
15 U.S. Department of State, “Table V (Part 3) Immigrant Visas Issued and Adjustments of Status Subject to Numerical Limitations Fiscal Year 2014,” https://travel.state.gov/content/dam/visas/Statistics/AnnualReports/FY2014AnnualReport/FY14AnnualReport-TableV-PartIII.pdf.
16 David Bier, “America Is One of the Least ‘Generous’ Countries on Immigration,” Cato at Liberty (blog), Cato Institute, January 30, 2018.
17 For a review of studies on EB5 investment see Carla N. Argueta and Alison Siskin, “EB-5 Immigrant Investor Visa,” Congressional Research Service, April 22, 2016, p. 15.
18 David Bier, “Family and Diversity Immigrants Are Far Better Educated Than U.S.-Born Americans,” Cato at Liberty (blog), Cato Institute, January 25, 2018.
19 National Academies of Sciences, Engineering, and Medicine (NASEM), The Economic and Fiscal Consequences of Immigration (Washington: National Academies Press, 2017), p. 349.
20 NASEM, The Economic and Fiscal Consequences of Immigration, p. 215.
21 Shulamit Kahn and Megan MacGarvie, “The Impact of Permanent Residency Delays for STEM PhDs: Who Leaves and Why,” NBER Working Paper No. 25175, October 2018.
22 Alex Nowrasteh, “Boost Highly Skilled Immigration,” Cato Online Forum, Cato Institute, November 17, 2014.
23 David Bier, “Higher-Paid Immigrants Forced to Wait Longer Due to Per-Country Limits,” Cato at Liberty (blog), Cato Institute, October 22, 2018.
24 U.S. Department of State, “Diversity Visa Program, DV 2016-2018: Number of Entries Received during Each Online Registration Period by Country of Chargeability,” November 12, 2018, https://travel.state.gov/content/dam/visas/Diversity-Visa/DVStatistics/DV%20AES%20statistics%20by%20FSC%202016-2018.pdf; U.S. Department of State, Refugee Processing Center, “Admissions & Arrivals,” October 31, 2018; and United Nations High Commissioner for Refugees, “Population Statistics.”
25 For example, Sen. Phil Gramm, 101 Cong. Rec. 7789 (July 12, 1989): “We have tremendous illegal immigration in this country which has not been stopped and yet we are here setting up arbitrary limits that prevent people who came here legally, who have been successful, who have achieved the American dream, from bringing their kinfolk to America. I do not think that is right. I do not think it makes any sense. And I do not think that this is a very bold or daring amendment in terms of doing injustice to the bill before us. I think it is a simple, straightforward amendment. It says that when you reach the point of only 216,000 people left to come in under family preference, after you take out the immediate family, you do not let it go any lower.” The amendment was adopted, and the final bill adopted the 226,000 floor for family preference green cards.
26 Douglas Massey and Nolan Malone, “Pathways to Legal Immigration,” Population Research Policy Review 21, no. 6: 473–504.
27 U.S. Census Bureau, “U.S. and World Population Clock”; World Bank, Data, “Population, Total for United States”; and U.S. Bureau of Economic Analysis, Data, “Gross Domestic Product.”
28Yearbook of Immigration Statistics, 1991–2017.