Many political leaders and pundits consider wealth inequality to be a major economic and social problem. They complain about a shift of wealth to the top at everyone else’s expense and about plutocrats dominating policymaking in Washington.
Is wealth inequality the crisis that some people believe? This study examines six aspects of wealth inequality and discusses the evidence for the claims being made.
Section 1 describes how wealth inequality has risen in recent years but by less than is often asserted in the media. Indeed, wealth inequality has changed surprisingly little given the large economic changes in recent decades from technology and globalization. Furthermore, most estimates overstate wealth inequality because they do not include the effects of social programs.
Section 2 argues that wealth inequality data tell us nothing about levels of poverty or prosperity and thus are not useful for guiding public policy. Wealth inequality may reflect innovation in a growing economy that is raising overall living standards, or it may reflect cronyism that causes economic damage.
Section 3 examines the sources of wealth for the richest Americans. Most of today’s wealthy are business people who built their fortunes by adding to economic growth, and some have created major innovations that benefit all of us. The share of the wealthy who inherited their fortunes has sharply declined in recent decades.
Section 4 looks at cronyism, which refers to insiders and businesses securing narrow tax, spending, and regulatory advantages. Cronyism is one cause of wealth inequality, and it has likely increased over time as the government has grown.
Section 5 explains how the growing welfare state has increased wealth inequality. Government programs for retirement, healthcare, and other benefits have reduced the incentives and the ability of nonwealthy households to accumulate savings and thus have increased wealth inequality.
Section 6 examines whether wealth inequality undermines democracy, which is a frequent claim of the political left. Research shows that wealthy people do not have homogeneous views on policy and do not have an outsized ability to get their goals enacted in Washington.
In sum, wealth inequality has increased modestly but mainly because of general economic growth and entrepreneurs creating innovations that are broadly beneficial. Nonetheless, policymakers should aim to reduce inequality by ending cronyist programs and reducing barriers to wealth-building by moderate-income households.
1. Wealth Inequality Has Increased Modestly
A Washington Post editorial lamented the “ever-higher concentration of national wealth at the top.”1 Similarly, New York Times columnist Paul Krugman expressed concern that “we are once again living in an era of extraordinary wealth concentrated in the hands of a few people … And this concentration of wealth is growing.”2
Sen. Bernie Sanders (D‑VT) claimed that “in the last four decades, there has been a massive shift of wealth from the middle class to the top one percent.”3 Sen. Elizabeth Warren (D‑MA) said that her wealth tax proposal “will help address runaway wealth concentration.”4
Fears about runaway wealth concentration were fueled by economist Thomas Piketty’s 2014 book, Capital in the Twenty-First Century.5 The book claimed that deep economic forces were allowing the rich to amass a rising share of overall wealth at the expense of workers.
Piketty’s narrative has been influential in politics, but his theories and data have not stood up to scrutiny by other economists. Martin Feldstein found that Piketty’s “thesis rests on a false theory of how wealth evolves in a market economy, a flawed interpretation of U.S. income-tax data, and a misunderstanding of the current nature of household wealth.”6 Alan Auerbach and Kevin Hassett found flaws in “the facts, logic, and policy conclusions in Piketty’s book.”7 Richard Sutch called Piketty’s historical data on U.S. wealth “unreliable” and “manufactured,” with some of it “heavily manipulated.”8
Examining the wealth data in Piketty’s book, columnists for the Financial Times found “errors of transcription; suboptimal averaging techniques; multiple unexplained adjustments to the numbers; data entries with no sourcing, unexplained use of different time periods and inconsistent uses of source data.”9 The Cato Institute published a collection of critiques of Piketty’s theories and data in 2017.10
One of Piketty’s main claims in his book was that wealth concentration is rising because returns on capital in the economy are outpacing economic growth (a hypothesis expressed as r > g). But University of Chicago scholars found that more than four-fifths of academic economists they surveyed disagreed with that contention.11 Another of Piketty’s claims was that as capital accumulates, capital income will become a growing share of all income, thus exacerbating inequality. However, excluding housing, the net capital share of U.S. income has actually fallen slightly since the 1950s.12
Subsequent to his book, Piketty teamed with economists Emmanuel Saez and Gabriel Zucman (referred to here as PSZ) to create a World Inequality Database (WID.world), which presents income and wealth data for numerous countries.13 For the United States, the WID data show that the share of wealth held by the richest 1 percent has soared since the 1970s. These data have been the primary source of fears about rising inequality and are frequently cited by politicians and reporters.
Few countries have collected reliable wealth data over time, so PSZ use rough estimates to create the data on their WID website. In a 2018 study, economist James K. Galbraith reviewed the WID data and found it “sparse, inconsistent, and unreliable” and “not very consistent with other reputable sources.” Piketty and colleagues have used assumptions in creating their data that are “beyond heroic,” concluded Galbraith.14 Nonetheless, the WID data are frequently cited, probably because they show the sharpest rise in wealth inequality of any wealth data.
The WID data series are constructed based on income tax return data. But tax returns are an incomplete source of income data, and they do not include any wealth data. Thus, the PSZ approach of using income tax data to measure inequality over time is only a rough estimation for numerous reasons:
- Tax returns include only 60 percent of national income.15 The distribution of the other 40 percent of income across income groups must be estimated. PSZ use the capital income (a flow) reported on tax returns to estimate wealth (a stock).
- Family structures have changed over time. Marriage rates among tax filers fell from 67 percent in 1960 to 39 percent in 2015.16 That change has created large and differential effects on high- and low-income tax returns.
- Tax laws have changed over time, altering the income reported on returns. For example, the growth of 401(k) contributions and employer-provided health benefits has greatly reduced the amount of income included on returns. Since these income sources are relatively more important to middle-income individuals than high-income individuals, top income shares will be biased.17
- Marginal tax rate cuts in the 1980s reduced incentives to avoid and evade taxes by high-earners.18 Thus, part of the reported increase in taxable incomes at the top end after those reforms did not reflect an actual increase in incomes.19
- Tax-law changes have shifted business income from corporate to individual returns over time. The share of overall U.S. business income reported on individual returns rose from 21 percent in 1980 to more than half today.20 That shift has inflated the income reported on individual tax returns particularly at the top end.
- A substantial amount of income goes unreported on tax returns, including small business income. Distribution estimates are sensitive to assumptions about who earned the missing income.21
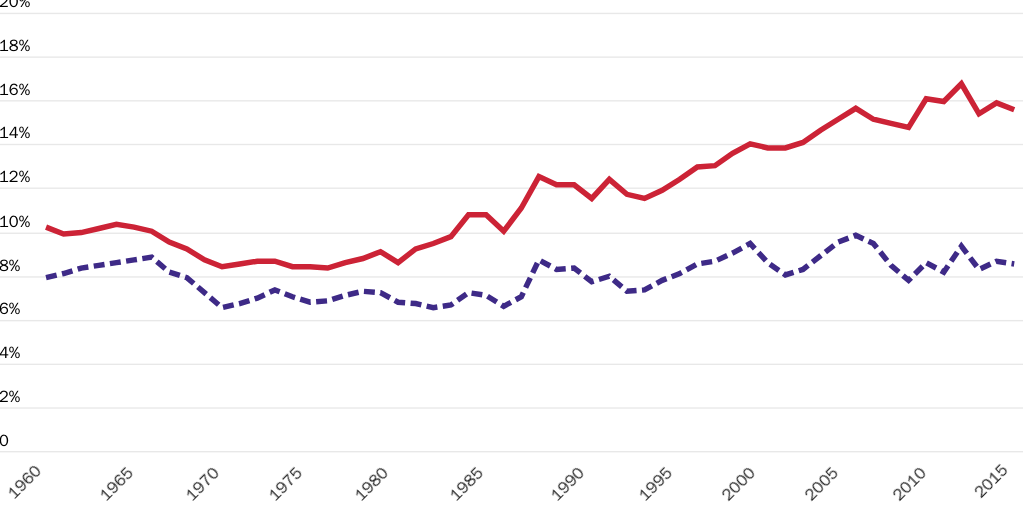
Scholars use estimates to adjust for these and other shortcomings of tax return data. But different adjustments can lead to sharply different results. For example, widely cited data by PSZ show that the top 1 percent’s share of U.S. income increased from 10 percent to 15.6 percent between 1960 and 2015.22 That estimate is after taxes and government benefits.
However, a 2018 study by economists Gerald Auten and David Splinter found very different results, as shown in Figure 1.23 As with PSZ, they started with tax return data, but they produced more precise estimates. They found that the top 1 percent income share increased only slightly, from 7.9 percent in 1960 to 8.5 percent in 2015. They concluded that “changes in the top one percent shares over the last half century are likely to have been relatively modest.24
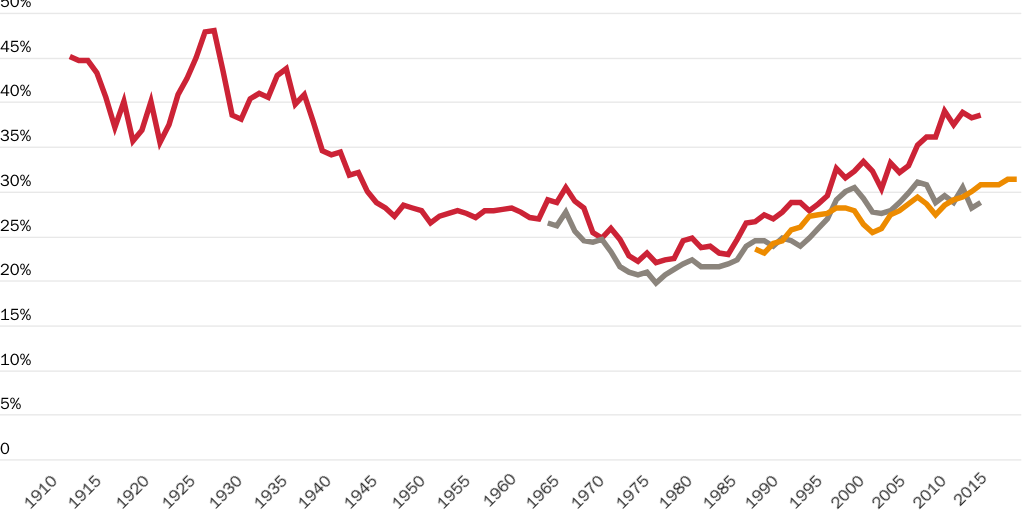
Let’s turn to top wealth shares. Numerous data sources are used to estimate wealth shares, including income tax returns, estate tax returns, and a Federal Reserve household survey. Figure 2 shows different estimates of the share of all U.S. wealth held by the top 1 percent.
One method of estimating wealth shares uses capital income reported on tax returns (such as interest and dividends) to estimate stocks of assets based on assumed rates of return.25 These estimates are heavily dependent on the chosen rates, such that small differences in assumptions create large differences in estimated top 1 percent wealth shares.26
PSZ use this method for wealth estimates on the WID site. They estimate that the top 1 percent share of U.S. wealth has risen sharply since the 1970s, as shown in Figure 2.27 This sharp rise is widely cited in the media.
However, a 2019 study by Matthew Smith, Owen Zidar, and Eric Zwick (SZZ) found that PSZ overstate the increase in top wealth shares because of their faulty assumptions about the rates of return used to estimate assets.28 Using better assumptions, SZZ found that the 1 percent wealth share rose only half as much as PSZ claimed.29 From 1980 to 2014, PSZ found that the top 1 percent share rose from 22.5 to 38.6 percent, but SZZ found that it increased from 21.2 percent to just 28.7 percent.30
A second method uses data from the Survey of Consumer Finances (SCF), produced by the Federal Reserve Board since 1989.31 In 2019, a team of Federal Reserve economists published “distributional financial accounts” based on data from the SCF and the Financial Accounts of the United States.32 These estimates show a similar pattern as the SZZ data—the top 1 percent share is lower and has risen less in recent years than the PSZ data suggested, as shown in Figure 2.
Before 1989, the Federal Reserve completed household finance surveys in 1962 and 1983.33 That data show that the top 1 percent share changed little over that period, edging up from 32 percent in 1962 to 34 percent in 1983. Those shares were higher than the 30 percent share found in the first modern SCF in 1989. Economist Edward Wolff used Federal Reserve data to create his own estimates of the top 1 percent wealth share.34 He found that the share was fairly flat from 1962 to 2010 but then rose after that.
A third method for estimating wealth shares relies on estate tax returns. Using these data, Wojciech Kopczuk and Saez estimated that the top 1 percent share of U.S. wealth was essentially flat from the 1930s all the way through to 2000.35
In sum, the widely cited wealth data created by PSZ are off base. A 2014 study by Kopczuk concluded that “estimates of the distribution of wealth based on the Survey of Consumer Finance and the estate tax method show little or no rise in the share of total wealth held by the top 1 percent of in [sic] the last 30 years, while the capitalization [PSZ] approach finds a substantial rise.”36 Similarly, a 2016 Federal Reserve study found that “the top share estimates derived in this paper show much lower and less rapidly increasing top shares than the widely cited values from the Saez and Zucman (2016) and Piketty and Saez (2003) studies.”37
The 2019 estimates by the Federal Reserve and SZZ show lower figures for the top 1 percent share and a slower rise than the PSZ data. U.S. wealth inequality has risen, but given the huge changes in technology and globalization that have transformed our economy, some changes over the decades are not surprising.
What about the future? Warren Buffett claimed that wealth inequality “has widened and will continue to widen unless something is done about it.”38 That is not clear at all. Buffett is echoing Piketty, but the mechanisms that Piketty claimed in his book would lead to higher inequality (relating to capital dominating labor) are speculative and not supported by most economists.
Numerous factors may move wealth inequality either up or down in the future. For one thing, there is a “race between the stock market and the housing market.”39 Middle-income households gain relative to top groups when housing prices are rising quickly, but top groups do better when the stock market is rising quickly. In recent years, equity prices have risen faster, which has boosted the top 1 percent share, but markets may change direction down the road.40
Another dynamic is the normal functioning of life-cycle finances. Most young people start their careers with little wealth but build a nest egg by their 60s. The SCF data for 2016 show that the mean family net worth for ages 35–44 was $289,000 while the mean for ages 55–64 was $1,167,000.41 As U.S. demographics change over time, so may measures of wealth inequality.
Yet another dynamic regards debt incurred for higher education. A growing share of families—currently 22 percent—owe education-related debt.42 That debt is now the largest part of household debt aside from mortgages, and it substantially reduces net wealth for affected families in the SCF data.43 However, the education investment funded by debt helps people build human capital, which is an asset. But the SCF does not include human capital, so it understates the true wealth of young people who invest in education. The upshot is that the rise in education debt has skewed measured wealth inequality.
Human capital is not the only portion of wealth left out of inequality estimates. Some wealth estimates, including the SCF, exclude defined benefit pension plans, which are owned broadly by the middle class. If defined benefit plans were included in the SCF data, it would reduce the top 1 percent share by 5 percentage points.44
Finally, wealth inequality statistics do not include the “wealth” that individuals hold in Social Security. Social Security is not legally owned wealth, but to individuals, the future benefits are like an asset that is available to fund future consumption. That is also true of other social programs, such as Medicare. Including the effects of Social Security and other social programs would substantially reduce measured wealth inequality, as Section 5 discusses.
To summarize, the estimates from Piketty and colleagues on the WID website showing sharply rising wealth inequality since the 1970s appear to be incorrect. Also, Piketty’s projection of sharply rising wealth inequality in the future is based on flawed theories. The top 1 percent wealth share has risen in recent years, but the change has not been large over the past half century given the large structural changes in the U.S. economy. Finally, published data on wealth inequality leaves out human capital and social programs such as Social Security, which has exaggerated estimates of inequality.
All that said, wealth statistics such as the top 1 percent share have little relevance to the standards of living of U.S. households. While many politicians and pundits seem obsessed with wealth inequality, the following sections argue that such measurements do not reveal anything about the levels of poverty or prosperity of Americans.
2. Poverty Matters, Not Inequality
Measures of wealth inequality do not tell us anything about the well-being of the poor, which is a more important focus for public policy than inequality. Poverty may fall as wealth inequality rises, such as when entrepreneurs build fortunes by generating economic growth. Or poverty may rise as wealth inequality rises, such as when crony capitalists gain preferences that distort the economy and reduce growth.
Poverty and inequality are different things, but they are often conflated in political discussions. High poverty levels, which are clearly undesirable, are often caused by bad policies, such as a lack of open markets and equal treatment. Wealth inequality is different—it cannot be judged good or bad by itself because it may reflect either a growing economy that is lifting all boats or a shrinking economy caused by corruption.
Martin Feldstein was right that “inequality is not a problem in need of remedy.” Instead, he noted that economists start with the “Pareto principle that a change is good if it makes someone better off without making anyone else worse off.”45 An example is an entrepreneur who builds her wealth by making product innovations that reduce prices for consumers.
Consider Brian Acton and Jan Koum, who created WhatsApp, which provides a free phone service for 1.5 billion users globally. Acton and Koum have built combined fortunes of $15 billion. Their success may or may not have widened wealth inequality, but their product has created huge value for consumers by reducing communication costs. America’s economic history is replete with similar stories. Walmart has generated savings for many millions of consumers while making the Walton family rich. Jason Furman, the former chair of President Barack Obama’s Council of Economic Advisers, was right to praise the company as a “progressive success story” for its role in reducing prices.46
Feldstein argued that the real problem we should focus on “is not inequality but poverty.”47 Recent economic data reveal how these two indicators are quite different. U.S. wealth inequality has edged up in recent years, but the poverty rate has declined. Meanwhile, wages are up and unemployment is low. Federal Reserve Board data found that the top 1 percent wealth share increased slightly between 2013 and 2016, but the wealth of the median household jumped 16 percent over that period, with particularly strong gains by less-educated households.48 Clearly, recent gains by the top 1 percent have not come at the expense of other Americans.
We see similar patterns in other growing economies. After China began adopting market reforms in the 1970s, its economy boomed and hundreds of millions of people lifted themselves out of poverty. China’s gross domestic product (GDP) per capita in constant U.S. dollars was more than 10 times higher in 2018 than it was in 1990.49 The share of the Chinese population in severe poverty—measured by the World Bank as income of less than $3.20 per day—fell from 47 percent in 1990 to just 1 percent today.50 Yet the rise in general prosperity may have coincided with increased wealth inequality in China—the top 10 percent wealth share is estimated to have jumped from 41 percent in 1980 to 67 percent today.51
One can see why wealth inequality is a useless measure by examining Gini coefficients across countries. The coefficients are calculated from distributions of income or wealth in populations and indicate the level of inequality in a single number from 0 to 100, with higher numbers indicating higher inequality.52 Wealth inequality is estimated to be high in the United States with a Gini coefficient of 85.53 On the other hand, many poor countries have much lower Gini coefficients, such as Ethiopia (61), Mynamar (58), and Pakistan (65).54 Wealthy countries such as the United States offer more opportunities and higher living standards than these poor countries, yet those countries have “better” Gini coefficients.
The United Nations produces a Human Development Index that measures income, life expectancy, and education levels in over 180 countries.55 A scatterplot of countries in this index and their wealth Gini coefficients shows a modestly positive relationship between the two variables—countries with higher wealth inequality tend to have higher human development. The Gini coefficients for many countries are probably not very accurate, but nonetheless the data do not support the idea that wealth inequality is bad for general prosperity defined in this way.
In some countries, high wealth inequality likely results from corruption. Russia, Kazakhstan, and Ukraine, for example, have wealth Gini coefficients of 88, 95, and 96, respectively, and experts believe many of the richest individuals in those countries gained their wealth from political connections.56 One expert noted that among Russia’s wealthiest individuals, “most have made their money by controlling companies in the natural-resources sector—like gas giant Gazprom, oil companies, or metals firms—and use their political connections with the Kremlin to maintain their fortunes.”57
Wealth inequality by itself provides no guidance on public policy issues because many factors can cause it. And even if it were a useful measure, claims by progressives that there is a global inequality crisis are off base. A Credit Suisse study found that the share of global household wealth owned by the top 1 percent of households worldwide was roughly unchanged between 2000 and 2018.58
The more important development in the world economy in recent years is the dramatic fall in poverty. Many lower-income nations have embraced markets and enjoyed broad-based growth and social progress:
- People living in “extreme poverty” as defined by the World Bank fell from 42 percent of the world’s population in 1981 to just 10 percent in 2015.59
- The share of the world’s population that is undernourished fell from 19 percent in 1991 to 11 percent in 2017.60
- The illiterate share of the world’s population fell from 30 percent in 1980 to 14 percent in 2015.61
- Africa’s average life expectancy increased from 53 years in 2000 to 62 years in 2015.62
Many poorer countries are starting to catch up to the living standards in developed nations as they accumulate wealth. The Credit Suisse study found that lower-income countries accounted for 10 percent of global wealth in 2000 but 25 percent by 2018, with China and India leading the way.63
It is good news that poor countries are pulling themselves up and enjoying rising prosperity. Yet commentators on the political left seem more concerned that some countries with broadly rising incomes have experienced increases in wealth inequality. This seems like “spiteful egalitarianism,” as Feldstein called it.64 That is, a knee-jerk dislike of the wealthy even when their wealth stems from productive activities that benefit the overall economy.
Many progressives seem to view the economy as a zero-sum game. Senator Sanders complained that “in the last four decades, there has been a massive shift of wealth from the middle class to the top one percent.”65 And Dan Riffle, adviser to Rep. Alexandria Ocasio-Cortez (D‑NY), complained that “the bigger Jeff Bezos’s and Bill Gates’s slices of the pie are, the smaller everybody else’s slices of the pie are going to be.”66
That is not true. Innovators such as Bezos and Gates make the pie larger, as have many wealthy Americans, as Section 3 discusses. Market economies are positive sum, not negative sum. The billions of market transactions that take place every day are voluntary and thus mutually beneficial—buyers and sellers each gain value. Entrepreneurs who become wealthy have essentially found ways to generate more transactions. Whatever aggregate statistics—such as wealth distributions—might show, policymakers should remember that the core of market economies is a bottom-up process of value creation.
That does not mean that all wealth is justly obtained. Critics on the left are correct that some businesses and wealthy people get ahead by breaking laws and exploiting government preferences. If Bezos or Gates had instead gained their wealth by means of narrow regulatory advantages, their wealth would represent a negative for the economy. Section 4 addresses such crony capitalism. But first we examine the positive-sum wealth generation at the core of market economies.
3. Most Top Wealth Is Self-Made
Do the wealthy mainly inherit their fortunes or build them through entrepreneurial activities? Some commentators imply the former, but the evidence shows that most of America’s wealthiest people have self-made fortunes.
Former U.S. labor secretary Robert Reich claimed in January 2019 that “even as the ranks of the working poor continue to grow, America is creating a new aristocracy of the non-working super rich with enormous influence over our economy and politics.”67 And New York Times columnist Krugman claimed, “We seem to be heading toward a society dominated by vast, often inherited fortunes.”68
These comments echo a theme in Piketty’s book, which is that economic forces are boosting the power of capital over labor and inherited wealth over self-made wealth. Piketty argued, “It is almost inevitable that inherited wealth will dominate wealth amassed from a lifetime’s labor by a wide margin.”69 Piketty refers in his book to the wealthy as “rentiers” to evoke the image of an idle class of overlords.
Piketty projected that accumulated wealth or capital will increase compared to the size of the economy in coming decades. In turn, he said capital income will become a growing share of overall income as the labor share falls. Since the wealthy receive a large share of capital income, that would boost high-end fortunes and make wealth ownership more concentrated.
However, Piketty’s story is inconsistent with actual U.S. trends. Capital’s share of income has risen since the 1970s but not because of larger accumulations by the wealthy. Rather, Matthew Rognlie found that the rising capital share has been entirely due to the housing portion of capital, which is broadly distributed across income groups.70 Aside from housing, the net capital share of income has fallen slightly since the 1950s.71
Another flaw in Piketty’s narrative regards his assumption that if capital accumulates rapidly, the rate of return to capital would nonetheless remain high, thus boosting the capital income share. But most economists would expect the rate of return to fall in that scenario, thus moderating any increase in capital income.72 Indeed, Rognlie found that “a rising capital-to-GDP ratio is most likely to result in a fall in capital’s share of income, since the net rate of return on capital will fall by an even larger proportion than the capital-to-GDP ratio rises.”73
Rognlie concluded that “capital income is not growing unboundedly at the expense of labor, and further accumulation of capital in fact most likely means a fall in capital’s share of total income—refuting one of the main theories of economist Thomas Piketty’s popular book Capital in the 21st Century.”74 The fears expressed by Piketty, Krugman, Reich, and others about a growing domination of capital over labor are off base.
The related fears about capital ownership becoming dominated by inherited wealth are also misguided. Inherited wealth represents a declining share of high-end fortunes. Most of America’s wealthiest people today are entrepreneurs and business people who built their own fortunes.75 There is dynamism and turnover among the richest Americans rather than a static group of people with growing piles of wealth.
Forbes has published an annual list of the 400 Americans with the highest net worth since 1982.76 By our count, just 21 from 1982 were still on the list in 2019.77 Where have the others gone? Numerous people have died and their wealth divided among heirs. The wealth of many others has stagnated or declined because of income taxes, consumption, charitable giving, and poor investment choices.
Robert Arnott and coauthors examined the Forbes lists and found that of the 400 individuals on the 1982 list, just 69 individuals or their descendants remained on the 2014 list.78 They found that the wealth of those 69 people had grown far more slowly than if they had simply invested passively in stocks and bonds in 1982 and let their holdings grow. They conclude that “dynastic wealth accumulation is simply a myth.”79
Piketty claims the opposite. He argues that the wealthy multiply their money rapidly: “One of the most striking lessons of the Forbes rankings is that, past a certain threshold, all large fortunes, whether inherited or entrepreneurial in origin, grow at extremely high rates.” And he adds that “the largest fortunes grew much more rapidly than average wealth. This is the new fact that the Forbes rankings help us bring to light.”80
Piketty’s claims are false. He seems to have only looked at the winners on the Forbes list and did not account for people who lost wealth and dropped off the list. As one example, the world’s richest man on Forbes global list in 1987 was Yoshiaki Tsutsumi, who was worth $20 billion. His fortune plunged to just $1.2 billion in 2006, and then he dropped off the list.81
William McBride looked at changes in wealth for the 400 individuals on the 1987 Forbes U.S. list through to the 2014 list.82 He calculated the growth in wealth for the 73 people who stayed on the list, and he estimated the growth for those who dropped off by assuming that the drop-offs had barely missed the wealth threshold for the 2014 list. With that assumption, he found that the average annual real wealth growth rate over 26 years for the people on the 1987 list was at most a meager 2.4 percent. (By contrast, the average annual real return on U.S. stocks over the decades has been about 7 percent.)83
McBride found that people on the Forbes lists who had inherited their wealth grew their fortunes more slowly than those with self-made wealth. Active entrepreneurs often generate new wealth, but individuals on the lists who had inherited did not earn outsized returns—instead, their wealth was eaten away over time, as noted, by taxes, consumption, philanthropy, and sometimes bad investment choices.
As many older fortunes decline, new fortunes are being made by entrepreneurs. Among those on the Forbes 2018 list, 43 percent were new in the prior 10 years. Many of the new billionaires have impressive achievements in building companies:
- Jensen Huang cofounded graphics chipmaker Nvidia, which has revenues of $10 billion.
- Shahid Khan built automotive parts maker Flex-N-Gate, which has revenues of $8 billion.
- Judy Faulkner founded medical records software firm Epic Systems, which has revenues of about $3 billion and supports the records of 230 million patients.
- Acton and Koum cofounded WhatsApp, which provides free phone service globally for 1.5 billion users, as noted.
- Reinhold Schmieding founded Arthrex, a surgical tools company that has developed many new products and has revenues of more than $2 billion.
- Robert Pera founded wireless equipment maker Ubiquiti Networks, which specializes in bringing low-cost internet access to rural areas.
- Thai Lee built business IT provider SHI International, which has revenues of $9 billion. Like Huang, Khan, and Koum, Lee is an immigrant to the United States.
Steven Kaplan and Joshua Rauh found that the share of the Forbes 400 who are self-made rose from 40 percent in 1982 to 69 percent by 2011.84 Forbes staff writer Luisa Kroll measured a similar increase and noted, “the number of Forbes 400 members who have forged their own path, using entrepreneurial capitalism as a means to attain a vast fortune, has increased dramatically.”85
The Forbes list of global billionaires shows a similar pattern. Self-made wealth is displacing inherited wealth in most countries, and that pattern is particularly pronounced in the United States. A Peterson Institute for International Economics study examined the Forbes global lists and found that “among advanced countries, the share of self-made billionaires has been expanding most rapidly in the United States.”86
Other analyses of the wealthy show similar patterns. On a Bloomberg’s list of the 100 wealthiest Americans in 2013, 73 are self-made and 27 have inherited wealth. A substantial share of wealthy individuals had humble origins. On the Bloomberg list, 18 had no college degree.87 On the Forbes 400 list, 20 percent grew up poor. Rags-to-riches stories are not uncommon.
Wealth‑X has created a database of the world’s richest people. On its list of 2,604 billionaires, 56 percent are self-made, 31 percent are partly self-made, and 13 percent have purely inherited wealth.88 On its broader list of people with more than $30 million in net wealth, 68 percent are self-made, 24 percent are partly self-made, and just 8 percent inherited all of their wealth.89
Other studies confirm the importance of self-made wealth in today’s economy:
- BMO Private Bank found that 67 percent of Americans with $1 million or more in investible assets are self-made.90
- U.S. Trust found that 70 percent of individuals with investable assets of more than $3 million grew up in middle- or lower-income households.91
- Wolff and Maury Gittleman found that just 15 percent of the top 1 percent’s wealth was inherited in 2007, down from 23 percent in 1989.92
- Lena Edlund and Kopczuk found that the importance of inherited wealth at the top in the United States has been declining since the 1970s based on an analysis of estate tax returns.93
- Tino Sanandaji found that “self-employed business owners account for an astonishing 70 percent of the wealth of the top 0.1 percent” in 2010.94
- Economists at the Federal Reserve Bank of Chicago found that one-third of all household wealth in the United States is owned by self-employed people who actively manage their businesses.95
In sum, the wealthiest Americans are not idle rentiers, as some critics suggest. Rather, as Kopczuk found, “those in the top 1 percent of the U.S. income and wealth distribution have less reliance on capital income and inherited wealth, and more reliance on income related to labor, than several decades ago.”96
Far from being idle, many of the wealthiest people in our society create new products, generate competition in markets, and drive down consumer prices. Their innovations have been diffused across the economy and benefited many millions of people. Most Americans understand this. A 2019 poll found that 69 percent of the public agrees that billionaires “earned their wealth by creating value for others like inventing new technologies or starting businesses that improve lives.”97
In the process of building companies, many entrepreneurs have become wealthy. But are their rewards excessive compared to the value they created?
William Nordhaus explored that question by estimating a model of U.S. business profits and productivity growth over a five-decade period. He concluded that “only a miniscule fraction of the social returns from technological advances over the 1948–2001 period was captured by producers, indicating that most of the benefits of technological change are passed on to consumers rather than captured by producers.”98 He found that businesses received only about 2 percent of the surplus benefits from their innovations, with the rest accruing to consumers.
In sum, ownership of the largest fortunes in the United States is continually changing. The relative importance of inherited wealth has been declining for decades. Inherited wealth is being replaced by new wealth created by entrepreneurs introducing new products and building fortunes while adding overall value to the economy.
4. Cronyism Increases Wealth Inequality
In market economies, the level of wealth inequality reflects many factors, including differences in individual knowledge, effort, luck, and savings behavior. Some individuals with unique talents are able to build large fortunes. Most of the wealthiest Americans today are self-made entrepreneurs and business people, as discussed.
However, governments also play a role in shaping wealth distributions through taxes, spending, and regulations. Many government activities redistribute resources from the rich to the poor, but some do the opposite. A number of broad-based and popular programs undermine the ability of moderate-income Americans to build wealth, as Section 5 discusses.
This section explores an unpopular way that governments increase wealth inequality—cronyism, which generally means gaining narrow government benefits through lobbying or connections. The word “cronyism” is similar in meaning to crony capitalism, corruption, corporate welfare, and rent-seeking. It usually entails businesses gaining benefits at the expense of consumers or taxpayers.99
Former presidential candidate Beto O’Rourke said that we have “an economy that is rigged to corporations and to the very wealthiest.”100 That overstates the problem, but it is a commonly held view. Most income in America is generated in competitive markets, and most people admire individuals who gain wealth through talent and effort. In a 2019 poll, the great majority of the Americans surveyed think that there is “nothing wrong with a person trying to make as much money as they honestly can.”101 The key word is “honestly.” As economist Greg Mankiw noted, “The high incomes that generate anger are those that come from manipulating the system.”102
More than two centuries ago, Adam Smith recognized that businesses often gained privileges from the government that undermined the public interest. He warned:
The interest of the dealers, however, in any particular branch of trade or manufactures, is always in some respects different from, and even opposite to, that of the public. To widen the market and to narrow the competition, is always the interest of the dealers. To widen the market may frequently be agreeable enough to the interest of the public; but to narrow the competition must always be against it, and can serve only to enable the dealers, by raising their profits above what they naturally would be, to levy, for their own benefit, an absurd tax upon the rest of their fellow-citizens.
The proposal of any new law or regulation of commerce which comes from this order ought always to be listened to with great precaution, and ought never to be adopted till after having been long and carefully examined, not only with the most scrupulous, but with the most suspicious attention. It comes from an order of men whose interest is never exactly the same with that of the public, who have generally an interest to deceive and even to oppress the public, and who accordingly have, upon many occasions, both deceived and oppressed it.103
Smith is right that it is unjust when the government helps businesses “raise their profits” by imposing “an absurd tax” or burden on the public. Such crony policies likely raise wealth inequality. Smith described in the 18th century how trade barriers create monopoly power for producers and harm consumers, and that is still a major problem today.104
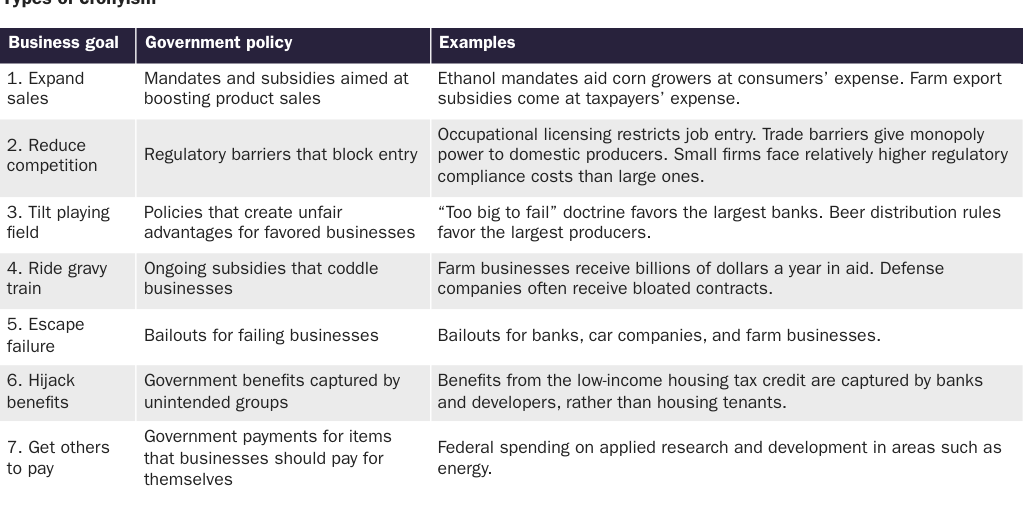
Governments are much larger now than in Smith’s time, and they manipulate the economy in more ways. There is no hard definition of cronyism, but Table 1 suggests various types of tax, spending, and regulatory schemes in the United States that fit the bill. Some of the categories overlap. The general problem summarized in the table is that some businesses pursue their goals by harnessing government power to favor their interests over the interests of taxpayers, consumers, and other businesses.
To what extent might such cronyism exacerbate wealth inequality? There are no overall estimates of the costs of cronyism or its effects on inequality, but we can put figures on some items.
Federal farm subsidies cost taxpayers more than $20 billion a year, and the benefits are skewed toward the wealthy.105 The average income of farm households is 40 percent higher than the average of all U.S. households, and 60 percent of farm subsidies go to the largest 10 percent of farm businesses. Even some billionaire landowners receive farm subsidies.106
Federal sugar regulations and trade barriers increase sugar costs for U.S. consumers by up to $4 billion a year.107 U.S. sugar producers gain wealth because the sugar protections give them monopoly power. The Fanjul family of Florida, for example, has built a net worth of about $8 billion in the sugar industry partly off the backs of U.S. consumers who face artificially high prices. To protect their interests, the Fanjuls have maintained close political ties to presidents and members of Congress.108
State occupational licensing reduces job opportunities while raising consumer prices. Licensure boards are often dominated by existing providers who seek to exclude new entrants—classic cronyism. About one-quarter of Americans work in occupations that require licenses. These rules raise incomes in protected professions but increase costs to U.S. households by about $1,000 annually on average, which is a heavy burden on low-income families in particular.109
Yale University law professor Jonathan Macey describes these sorts of policies as “wholesale” cronyism.110 In addition, he says there is “retail” cronyism, which involves particular individuals and businesses using connections to unethically gain excess benefits from programs.
Government contracting is rife with retail cronyism. In the recent “Fat Leonard” scandal, for example, Leonard Glenn Francis cozied up to U.S. Navy leaders in the Pacific to win hundreds of millions of dollars in lucrative deals to resupply Navy ships.111 He made large profits by overpricing contracts and submitting fraudulent invoices. Francis had numerous moles inside the Navy steering government contracts his way. He wined and dined Navy officers, providing them with gifts, prostitutes, and other favors to get their help and protection. The scandal exposed “a staggering degree of corruption within the Navy,” concluded a Washington Post investigation.112
The Solyndra scandal was also classic cronyism.113 The Department of Energy (DOE) gave solar panel maker Solyndra a $535 million loan guarantee in 2009. Solyndra was a spendthrift company and its products were uncompetitive. It went bankrupt and closed its doors in 2011 with taxpayers footing the bill for the failed loan.
Why did the DOE give Solyndra a big loan guarantee? Solyndra’s largest investor had ties to billionaire George Kaiser, who was also a major fundraiser for President Barack Obama. The New York Times found that Solyndra “spent nearly $1.8 million on Washington lobbyists, employing six firms with ties to members of Congress and officials of the Obama White House.”114 Similarly, the Washington Post found that the “main players in the Solyndra saga were interconnected in many ways, as investors enjoyed access to the White House and the Energy Department.”115
President Obama visited Solyndra and at a press conference called the firm an “engine of economic growth.”116 At the time, a Solyndra board member wrote to George Kaiser, “The DOE really thinks politically before it thinks economically.”117 The White House pressured the DOE to approve the subsidy, and that appeared to tip the scales.118
As the federal government has grown larger, both wholesale and retail corruption have likely increased, thus contributing to wealth inequality. The larger that subsidies, procurement, and other government spending are, the more likely people will abuse the system and live high on the hog at taxpayer expense.
At the same time, the experts who know how to manipulate the government have prospered. Six of the 10 highest-income counties in the nation are now suburbs of Washington, DC.119 That wealth is partly driven by highly paid federal government workers but also by the many high-paid lobbyists and federal contractors who live in the DC region.120
Today, the federal government funds about 2,300 different subsidy programs, more than twice as many as in the 1980s.121 The number of pages of accumulated federal regulations has increased from 55,000 in 1970 to 127,000 in 1990, to 165,000 in 2010, and to 185,000 today.122 The growing volume of programs and regulations provide many ways that lobbyists can twist the rules and gain unfair advantage over consumers and other businesses. Some share of lobbying stems from businesses protesting misguided regulations that in themselves create unfair restrictions, such as various barriers to competitive entry.
People may believe that regulations fix failures in the economy and improve our standard of living. Some do, but many regulations serve narrow private ends and do not improve economic or social outcomes. Economist George Stigler’s celebrated essay “The Theory of Economic Regulation” in 1971 argued that “as a rule, regulation is acquired by the industry and is designed and operated primarily for its benefit.”123 By “acquired,” he meant that businesses are able to influence the design of regulations so that they benefit industry incumbents and undermine the broad public interest.
This idea has become known as “regulatory capture.” At the time of Stigler’s writing, heavy regulations on trucking, railroads, and airlines protected businesses from competition and raised prices. The regulatory agency for the railroads was the Interstate Commerce Commission, which Milton Friedman said “started out as an agency to protect the public from exploitation by the railroads” but ended up as “an agency to protect railroads from competition by trucks and other means of transport.”124 Similarly, the Civil Aeronautics Board “managed and enforced a cartel among air carriers” to the detriment of the general public between 1940 and 1978, noted economist James Miller.125
Bipartisan deregulatory efforts in the 1970s and 1980s increased competition in transportation and drove down prices, thus benefiting consumers and likely reducing wealth inequality. Unfortunately, many self-serving regulations remain in other industries, although the overall harm done by anti-competitive or crony regulations is difficult to quantify.
A number of studies have compared corruption across countries, so we can get an idea of the relative extent of the U.S. cronyism problem. The United States ranks as the 22nd least corrupt country of 180 countries on Transparency International’s “corruption perceptions index.”126 This index draws from various surveys and expert views on government bribery, misuse of funds, financial disclosure rules, and other measures of clean administration.
The United States ranks 25th least corrupt of 213 countries on the World Bank’s “control of corruption” index.127 And the United States ranks 20th of 126 countries on the World Justice Project’s “Rule of Law” index, which includes measures such as the use of public office for private gain and the number of government officials sanctioned for misconduct.128 Overall, these indexes show that the United States is one of the less corrupt countries but that there is room for improvement.
It is widely recognized that corruption undermines economic growth. Experts agree that rampant corruption in countries such as Russia damages those countries’ economies. The average GDP per capita in the bottom half (most corrupt) of the Transparency International countries in 2017 was $9,300, while the GDP per capita in the top half was $34,400.129 A scatterplot of these corruption ratings and GDP per capita shows a strong relationship across countries.
If the United States took steps to reduce corruption or cronyism, it would likely boost overall income levels by reducing economic distortions. But given that we are one of the less corrupt countries, it seems unlikely that corruption or cronyism is a major driver of U.S. income levels or wealth inequality.
Economists Sutirtha Bagchi and Jan Švejnar investigated the cross-country relationship between corruption and the type of wealth held by billionaires.130 Using the Forbes list, they separated the billionaires who made their wealth from political connections from those who did not. Let’s call those bad and good billionaires, respectively. Across countries other than the United States, 17 percent of billionaires were bad and 83 percent were good. In the United States, just 1 percent were bad and 99 percent were good.131 Thus, American billionaires overwhelmingly earned their wealth in productive and noncorrupt ways, according to this metric.
Bagchi and Švejnar found that countries with high shares of bad billionaires rank poorly on indexes of corruption—countries such as Malaysia, Indonesia, Thailand, Colombia, and Mexico. By contrast, countries with few politically connected billionaires rank well on corruption indexes—countries such as Britain, Singapore, Sweden, Switzerland, and the United States. The findings indicate that corruption is not related to the amount of top-end wealth generally but rather to how people at the top made their wealth. Countries should focus on equal treatment and uniform laws so that people gravitate toward productive ways of generating wealth and not unproductive cronyist ways.
Bagchi and Švejnar also compared country shares of good and bad billionaires to economic growth and found that countries with large numbers of bad billionaires experienced weaker economic growth. That result is not surprising because cronyism often entails regulations and subsidies that restrict competition and misdirect investment.
The Economist created its own cross-country “crony capitalism index.”132 It uses the Forbes list to estimate billionaire wealth in each country obtained from sectors said to be prone to crony capitalism.133 Each billionaire is classified as either crony or not based on the industry they are most active in. The magazine compared its cronyism measure to economic performance and found that billionaire wealth in crony sectors as a share of GDP is about three times higher in low-income countries than in high-income countries. Again, cronyism appears to undermine economic performance.
As with the Bagchi and Švejnar analysis, the United States scored quite well on The Economist’s index. In 2016, it had crony billionaire wealth of 1.8 percent of GDP, which was the seventh least corrupt of 22 countries. In the United States, billionaire wealth earned in crony sectors is only about one-sixth as large as billionaire wealth earned in non-crony sectors.
The Economist argues, “Over two decades, crony fortunes leapt relative to global GDP and as a share of total billionaire wealth.”134 If true, that may help explain changes in wealth distribution in some countries that have high levels of cronyism, such as Russia. It is less relevant in countries that have lower levels of corruption, such as the United States.
With all this in mind, the mistake made by politicians such as Senators Sanders and Warren is to imply that most fortunes owned by America’s wealthy are ill-gotten. They tend to conflate wealth in general with cronyist wealth. Sanders lambastes all wealth inequality as “obscene” in his speeches.135 Both Sanders and Warren would impose their wealth taxes on every wealthy individual, including entrepreneurs who create innovations that benefit the poor.
Most wealth at the top in the United States is earned in open and competitive industries, not through cronyism. It is true that the government intervenes in many U.S. industries, but most of the profiles on the Forbes list of the wealthiest Americans indicate people who have created value that benefits the general public.
Nonetheless, cronyism is an important problem, which probably does increase wealth inequality to an extent. Surveys show that Americans are concerned about cronyism. According to a recent poll, 67 percent of voters surveyed said they believe that big businesses and government regulators often work together to create rules that are harmful and unfair to consumers.136
So how do we address the problem? Table 1 indicates the types of cronyism that we should target for reform. Our goal should be to allow open competition in every industry so that entrepreneurs can challenge established businesses on a level playing field. Adam Smith stressed the benefits of competition:
All systems either of preference or of restraint, therefore, being thus completely taken away, the obvious and simple system of natural liberty establishes itself of its own accord. Every man, as long as he does not violate the laws of justice, is left perfectly free to pursue his own interest his own way, and to bring both his industry and capital into competition with those of any other man, or order of men.137
The public should press policymakers to eliminate the subsidies, regulations, and tax preferences that fuel cronyism. If the government reduced its interventions in the economy, there would be fewer levers for special interests to pull. Interventions often begin with good intentions, but businesses twist and exploit policies to gain unfair advantage. As Adam Smith noted, we should give “most suspicious attention” to intervention schemes that businesses promote.
Cronyism distorts the economy and likely increases wealth inequality. It erodes confidence in government and is rejected by the general public. The problem the nation faces is not wealth inequality per se. Rather, the problem is government policies that protect and subsidize favored businesses and unjustly aid the wealthy.
5. Government Undermines Wealth-Building
Federal and state governments run many social programs that support lower- and middle-income households. One cost of these programs is that they undermine the incentives and the means for people to accumulate personal savings. Effectively, they displace or “crowd out” wealth-building by households, particularly those with moderate incomes.
As government programs for retirement, healthcare, unemployment, and other items have expanded over the decades, there has been less need for people to save for those expenses themselves. At the same time, people are less able to save because higher taxes are required to pay for the programs. This has undermined wealth accumulation by the nonrich and thus increased wealth inequality.
The government creates other hurdles to wealth-building. A number of social programs have asset tests, which discourage savings by disallowing benefits if household assets rise above set amounts. Also, numerous government policies raise costs for people with moderate incomes, which reduces earnings available for savings.
Therefore, wealth inequality statistics do not just reflect the workings of markets but also the negative effects of government policies on private savings. Politicians complain about wealth inequality, but their own policies are partly responsible.
Displacement of Personal Savings
The largest federal program, Social Security, is a prominent example of crowding out. The program is a tax-funded benefit program, not a savings plan. Many Americans rely on Social Security for most or all of their retirement income. The program discourages workers from saving for their own retirement, and it reduces their ability to do so with its heavy 12.4 percent tax on wages up to a dollar cap.
In pioneering studies in the 1970s, Martin Feldstein explored how Social Security displaced private savings.138 He found that every dollar increase in benefits reduced private savings by about 50 cents.139 Studies since then have generally confirmed the substantial displacement effect, although the magnitudes of the estimated effects have varied.140
Social Security represents a much larger share of retirement resources for the non-rich than the rich, and the program’s benefits cannot be inherited. The result is that the program’s crowding-out effect increases wealth inequality. Jagadeesh Gokhale and Laurence Kotlikoff modeled a simulated population to estimate that Social Security raises the Gini coefficient on wealth by one-fifth and increases the share of wealth held by the top 10 percent by more than one-quarter.141 This occurs because Social Security leaves the non-rich with “proportionately less to save, less reason to save, and a larger share of their old-age resources in a nonbequeathable form than the lifetime rich. In doing so, Social Security denies the children of the poor the opportunity to receive inheritances.”142
The fact that Social Security increases wealth inequality may surprise people because the program is thought to be a progressive achievement. While the program may reduce income inequality, it raises wealth inequality. Other social programs create similar effects. Medicare provides large resources to retirees and thus also reduces incentives to save for retirement. Unemployment insurance, welfare, education aid, and other programs reduce incentives for people to save for midlife expenses. In general, when the government provides income and other social benefits to people, savings incentives are reduced. Higher government aid results in lower private wealth.
Barış Kaymak and Markus Poschke built a model of the U.S. economy to estimate the causes of changing wealth inequality in recent decades. They found that the main factor raising wealth inequality has been technological change that has increased wage dispersion. But they also found that the expansion of Social Security and Medicare has had a large effect:
By subsidizing income and healthcare expenditures for the elderly, these programs curb incentives to save for retirement, a major source of wealth accumulation over the life-cycle. Furthermore, since both programs are redistributive by design, they have a stronger effect on the savings of low- and middle-income groups. By contrast, those at the top of the income distribution have little to gain from these programs. We argue that the redistributive nature of transfer payments was instrumental in curbing wealth accumulation for income groups outside the top 10% and, consequently, amplified wealth concentration in the U.S.143
Kaymak and Poschke found that the expansion of Social Security and Medicare caused about one-quarter of the rise of the top 1 percent share of wealth in recent decades.144 Social Security and Medicare spending increased from 3.5 percent of GDP in 1970 to 8.3 percent by 2018.145
Those are the two largest federal social programs, but other programs have likely added to this wealth inequality effect. Total federal and state social spending as a share of GDP more than doubled from 6.8 percent in 1970 to 14.3 percent by 2018.146 That large increase was over the period that Thomas Piketty and some other economists claim that there was a large increase in wealth inequality. Section 1 argues that the increase has been modest, but however large, a substantial share stemmed not from market forces but from expansion in government social benefits.
Generations of Americans have grown up assuming that the government will take care of them when they are sick, unemployed, and retired. They have responded by putting aside less of their earnings for their own future expenses. Financing social programs requires not just the federal payroll tax but also a large share of other federal and state taxes. American families are less able to save because of higher taxes, and they have a reduced incentive to do so because of the expectation of receiving government benefits.
Further evidence for the displacement effect of the welfare state comes from cross-country studies. In an early study comparing national levels of Social Security benefits to private savings, Feldstein found that higher benefits had a “powerful effect” in reducing private savings.147
More recently, a 2015 study by Pirmin Fessler and Martin Schürz for the European Central Bank used a large survey database across European countries to explore the relationship between the level of social spending and wealth distribution. Their statistical results showed that “the degree of welfare state spending across countries is negatively correlated with household net wealth.”148 They explained:
The substitution effect of welfare state expenditures with regard to private wealth holdings is significant along the full net wealth distribution, but is relatively lower at higher levels of net wealth. Given an increase in welfare state expenditure, the percentage decrease in net wealth of poorer households is relatively stronger than for households in the upper part of the wealth distribution. This finding implies that given an increase of welfare state expenditure, wealth inequality measured by standard relative inequality measures, such as the Gini coefficient, will increase.149
Based on Fessler and Schürz’s data, countries such as Germany and the Netherlands have relatively high social spending and relatively low private wealth holdings by less well-off households. But other countries such as Luxembourg and Spain have relatively low social spending and relatively high private wealth holdings by less well-off households.150 Consistent with those findings, a 2018 Organisation for Economic Co-operation and Development study shows relatively higher wealth inequality in Denmark, Germany, and the Netherlands and relatively lower wealth inequality in Luxembourg and Spain.151
The Gini coefficient for wealth is similar in the United States (85), Denmark (84), Norway (79), and Sweden (87), which people usually think of as egalitarian nations.152 Credit Suisse’s Global Wealth Databook 2014 explained:
Strong social security programs—good public pensions, free higher education or generous student loans, unemployment and health insurance—can greatly reduce the need for personal financial assets, as Domeij and Klein (2002) found for public pensions in Sweden. Public housing programs can do the same for real assets. This is one explanation for the high level of wealth inequality we identify in Denmark, Norway and Sweden: the top groups continue to accumulate for business and investment purposes, while the middle and lower classes have a less pressing need for personal saving than in many other countries.153
Another way to think about the effect of social programs on wealth is to estimate the present value of future promised government benefits as if it were real wealth. A 2019 study by John Sabelhaus and Alice Henriques Volz calculated Social Security “wealth” for U.S. households compared to the wealth held in private defined benefit and defined contribution retirement plans.154 It found that Social Security wealth is twice as large as the combined wealth in private retirement plans and is heavily skewed toward lower-income households.155 For the least-wealthy one-quarter of U.S. households, Social Security wealth is five times larger than private retirement plan wealth, whereas for the most-wealthy one-quarter of households, Social Security wealth is less than half as large as private retirement wealth.
Social Security and other entitlement programs loom large in household finances for the nonwealthy and thus likely displace a large amount of private wealth. As a result, all the widely cited statistics about wealth distribution—including Gini coefficients and top 1 percent shares—substantially overstate wealth inequality because they exclude Social Security. In a 2016 analysis, Sabelhaus, Henriques Volz, and Sebastian Devlin-Foltz concluded, “Claims to future Social Security benefits are a key component of retirement wealth, and thus failure to include Social Security leads to a biased assessment of the overall distribution of retirement wealth.”156
That is true of Medicare benefits as well. Future Social Security and Medicare benefits represent “wealth” typically worth hundreds of thousands of dollars to individuals. A 2018 Urban Institute study found, for example, that an average-income single man retiring at age 65 in 2020 could expect to receive $318,000 in Social Security benefits and $229,000 in Medicare benefits in present value terms.157 Those are large figures compared to the amount of financial assets the average person holds. Laurence Kotlikoff notes that if claims to future Social Security, Medicare, and Medicaid benefits were included in wealth estimates, we “might find declining wealth inequality in recent decades.”158
To individuals, Social Security and other entitlements seem like wealth, but they only represent promises of future benefits, and those benefits are in jeopardy because these unfunded programs are driving huge and rising government deficits and debt. As currently structured, Social Security will only be able to pay a fraction of promised benefits down the road. The Cato Institute has long argued that the United States should move to a retirement system based on private savings accounts, as numerous other countries have done.159 Traditional benefits would be phased out over time as younger workers built up savings in private accounts with a portion of their earnings that currently go to federal payroll taxes.
Other social programs could be transitioned to a savings basis as well. Feldstein modeled how the United States could move toward a savings-based Medicare system.160 The nation of Chile has a savings-based unemployment insurance system that is integrated with its savings-based Social Security system.161 Such savings accounts would be inheritable, unlike the benefits from current social programs. They would also be more secure because they would not depend on political promises of a massively indebted government.
If the United States transitioned to savings-based social programs, it would dramatically reduce measured wealth inequality as the non-rich built up financial assets. A sad irony in public policy debates is that the politicians—such as Senators Sanders and Warren—who complain the loudest about wealth inequality also oppose moving toward the savings-based social programs that would reduce measured wealth inequality.
Asset Tests
Government social programs do not just displace private savings by changing incentives to save; some programs actively deter private saving. Numerous means-tested welfare programs impose both income and asset tests, the latter of which cut off benefits if a measure of personal assets rises above statutory thresholds.162 Asset tests are in place for Temporary Assistance for Needy Families, Supplemental Nutrition Assistance Program, Medicaid, Supplemental Security Income, and other programs.163 Both federal and state governments play a role in setting these rules, and there is substantial variability between the states.
The purpose of asset tests is to limit program costs and to target benefits to the people most in need. Asset tests help to prevent abuse by people gaining benefits who do not really need them. However, a harmful side effect is that asset tests help to trap people in poverty by discouraging a culture of personal saving. If assets rise above capped levels, the tests act as a 100 percent tax rate on additional wealth accumulation. The caps are sometimes as low as $3,000, although there has been a loosening of rules in many states in recent years.
A number of economic studies have documented the negative effects of asset tests.164 The important point with respect to wealth inequality is that asset tests are one mechanism by which governments, not markets, skew economic outcomes to intensify wealth inequality.
Government-Created Costs
Social programs are not the only government policies that can widen wealth inequality. Federal, state, and local governments raise living costs for moderate-income households, which reduces funds available for savings. Housing, food, transportation, apparel, and footwear together account for 59 percent of spending by the average household in the bottom 20 percent, or quintile, of the income distribution, and government policies raise prices in those sectors.165
Consider housing, which accounts for 25 percent of total expenditures for the average household in the poorest quintile.166 Land-use and zoning regulations that constrain housing supply raise housing costs in many cities. Ed Glaeser, Joseph Gyourko, and Raven Saks estimated that such regulations push up condominium prices by 53 percent in San Francisco, 50 percent in Manhattan, 34 percent in Los Angeles, 22 percent in Washington, DC, and 19 percent in Boston.167 High housing costs reduce the funds that individuals would have available to save.
Housing-supply restraints may also increase wealth inequality between existing homeowners and others and between homeowners in different regions. A concern of Piketty’s was that as capital accumulates, capital income would become a growing share of all income, thus exacerbating inequality. But Matthew Rognlie disaggregated capital income for the United States and found that only returns to housing have been contributing to rising inequality in recent decades.168 French economists found similar results.169
Economists David Albouy and Mike Zabek conclude that U.S. housing price inequality has risen to pre–World War I levels, driven by the rising value of land and by a growing relative price gap between inner cities and metro areas.170 Rising house price inequality also causes a rising wealth gap between homeowners and renters.
Restrictive land-use and zoning rules may worsen wealth inequalities in other ways. The rules tend to be the tightest in economically prosperous areas with good opportunities for high-wage jobs. The laws also tend to be the most restrictive on forms of housing demanded by first-time homebuyers, who typically have less accumulated wealth. Economist Lawrence Summers concluded that “an easing of land-use restrictions that cause the real estate of the rich in major metropolitan areas to keep rising in value” could help address concerns about rising wealth inequality.171
Poorer households spend a higher share of their incomes not just on housing but also on food, clothing and footwear, transportation, and childcare. Ryan Bourne found that government regulatory and trade policies in these areas can cost low-income households anywhere from $830 to $3,500 per year through higher prices.172 Government housing and transportation policies can also reduce mobility toward better-paying jobs.
In sum, numerous government policies—often well-meaning—have the effect of raising wealth inequality. Reductions to social spending, taxes, regulations, and trade barriers would reduce costs and increase incentives for families to build wealth. When it comes to government, less is often more for American families.
6. Inequality Does Not Erode Democracy
A popular idea on the political left is that wealth inequality undermines democracy. New York Times columnist Krugman asked, “Can anyone seriously deny that our political system is being warped by the influence of big money, and that the warping is getting worse as the wealth of a few grows ever larger?”173 And Senator Warren exhorted: “You’ve got things that are broken in your life; I’ll tell you exactly why. It’s because giant corporations, billionaires have seized our government.”174
A former lead economist at the World Bank, Branko Milanović, claimed:
In every political system, even a democracy, the rich tend to hold more political power. The danger is that this political power will be used to promote policies that further cement the economic power of the rich. The higher the inequality, the more likely we are to move away from democracy toward plutocracy.175
The designers of Senator Warren’s wealth tax plan—economists Saez and Zucman—favor higher taxes on the rich to resist a supposed “oligarchic drift that, if left unaddressed, will continue undermining the social compact and risk killing democracy.”176 Similarly, Vanessa Williamson of the Brookings Institution argues that “the purpose of high tax rates on the rich is the reduction of vast fortunes that give a handful of people a level of power incompatible with democracy.”177
Are such fears justified? No, for numerous reasons. The political views of the wealthy are not homogeneous, and on many issues, they track the views of the rest of the population. When the preferences of the wealthy are different, they are often not followed by policymakers, who ultimately need votes, not money. Finally, the empirical evidence is complex, but it appears that money does not buy elections, and wealthy self-funded candidates often do poorly.
The Preferences of the Wealthy
Do the wealthy have different policy preferences than the rest of us? If they do not have different policy preferences, then even if they had large political clout, it would not affect policy outcomes.
The breakdown of policy views of broad lower‑, middle‑, and higher-income groups are quite similar. Alexander Branham, Stuart Soroka, and Christopher Wlezien note that empirical research generally shows that “preferences across economic groups, especially the middle and rich, do not differ much in many policy areas. In these instances, it does not matter whether public policy is more responsive to one group—policy will end up in the same place.”178 In their 2017 analysis of 1,779 poll questions on policy, they found, “in nearly 90 percent of cases, majorities of the middle and rich are in agreement.”179 On 80 percent of questions, majorities of all three income groups agreed, albeit with differing degrees of enthusiasm.
Political scientist Martin Gilens notes that “the affluent are no more (or less) likely to be of one mind on the proposed policy changes in my dataset than are Americans within low and middle incomes.”180 Pew Research found that individuals with family incomes above $150,000 are equally likely to identify as Republican or Democrat (33 percent to 32 percent).181
Within every income group there is, of course, a broad range of policy views. Jonah Goldberg noted the diversity among billionaires: “George Soros, Tom Steyer, and other liberal billionaires are in a hammer-and-tongs political battle with Sheldon Adelson, Charles and David Koch, and other conservative or libertarian billionaires.”182 Similarly, the top 10 wealthiest members of Congress are five Democrats and five Republicans. There is little class solidarity among the wealthy.
We used Roll Call’s “Wealth of Congress” database to compare support for social programs in roll call votes from 2009 through 2018 with the net worth of House and Senate members.183 In Figure 3, each dot is a member of Congress. Support for redistribution is modeled by examining how members of Congress voted in roll calls on subjects containing the following terms: Medicare, Medicaid, Social Security, Welfare, Entitlement, CHIP, or SNAP. The figure and a simple regression reveal that there is a correlation between politicians’ wealth and their support of social programs among Democrats, but there is no correlation among Republicans.184
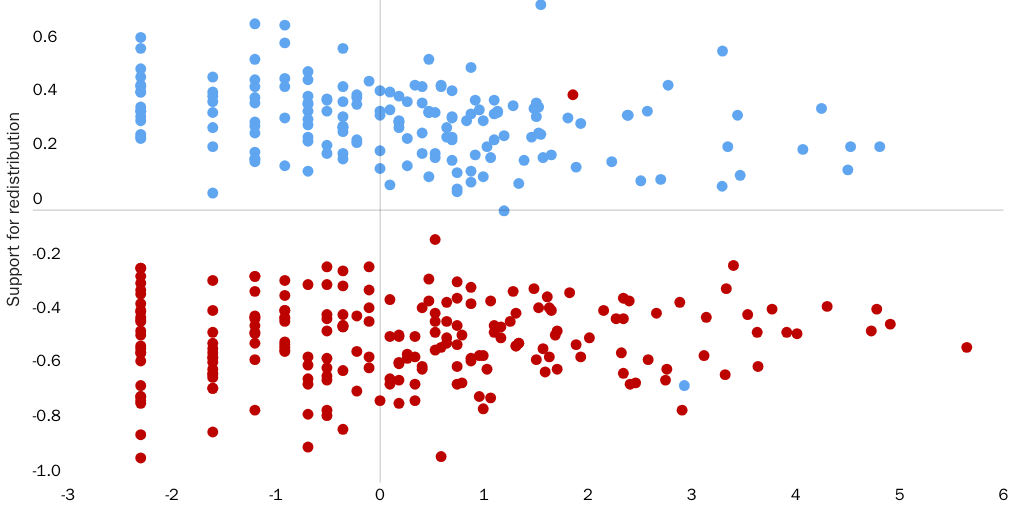
The figure shows that party label is a much more important factor than wealth in explaining the votes. Democrats are much more supportive of social programs and clustered at the top of the chart, while Republicans are clustered at the bottom. The key determinant of their voting records on these issues is party affiliation, not wealth.
Clearly then, being wealthy does not by itself determine one’s political preferences. However, subcomponents of the wealthy may lean in particular political directions. A recent study looking at campaign contributions estimated that 57 percent of S&P 500 chief executives are Republicans and only 19 percent Democrats.185 Also, Gilens’s work on the preferences of the top 10 percent of income earners found some differences in political preferences compared to the rest of the population.186 The top 10 percent have somewhat stronger opposition to taxes and business regulation. They also tend to be less protectionist on trade policy; less conservative on religious and moral issues; and more supportive of foreign aid, top income and capital gains tax cuts, gas tax increases, and restraint in Social Security and Medicare spending.
Evidence on the views of the extremely wealthy is scarcer. But a survey by Benjamin Page, Larry Bartels, and Jason Seawright of 104 wealthy individuals in Chicago in 2011 found differences in political preferences from the rest of the population for those with a net worth of $40 million or more.187 This group was more likely than others to think excessive government spending and budget deficits were the most important economic problem the country faced. They were also more likely to want to cut Social Security, healthcare, food stamps, and homeland security spending than the rest of the public and less likely than the broader public to support a federal jobs guarantee and more redistribution.
However, even this elite group supported progressive taxation at about current rates. They also wanted a progressive Social Security system but were split on whether high earners should pay more to fund it. On regulation, they favored intervention in areas where scandals have occurred but considered small businesses to be overregulated. There are some differences within this top group—professionals generally had more liberal views than business owners, managers, and investors.
Do the Rich Have Disproportionate Political Power?
On many issues where the wealthy do have different preferences than the rest of us, it does not appear that they get their way in policy. Data show that the wealthy are very concerned about federal budget deficits, yet today’s deficits are massive, and neither party seems interested in tackling the problem. Donald Trump won the presidency promising trade protectionism, unreformed entitlement programs, reducing immigration, and putting conservative judges into courts. None of those positions are particularly popular among the very wealthy.
However, Trump does support deregulation and tax cuts, which the wealthy have a relative preference for. But interestingly, not one CEO in the Fortune 100 had donated to Trump’s election campaign by September 2016. His victory did not stem from influence by the wealthy but more from grassroots opposition to wealthy coastal elites. The rich have less direct influence on electoral outcomes or policy platforms than is commonly believed.188
Some scholars disagree with that view. Using a data set primarily covering 1981–2002, Gilens analyzed the relative influence of high earners in situations when opinions between income groups differed.189 He concluded that the federal government is responsive to the public’s preferences, but it is more strongly responsive to the preferences of the most affluent. He focused on issues with an average preference gap in survey data of at least 10 percentage points between the rich and the rest and concluded:
When less-well-off Americans hold preferences that diverge from those of the affluent, policy responsiveness to the well-off remains strong but responsiveness to lower-income groups all but disappears.190
However, Gilens’s methodology is problematic.191 He admits there are exceptions to his conclusions, and we think those exceptions are large. On Social Security, Medicare, education, and public works spending, for example, policy outcomes appear more responsive to the preferences of the poor and middle class than the rich. Those policy areas account for about half of all federal spending.192 Adding in defense spending, which research suggests the super-wealthy also favor cutting, brings that share to more than 60 percent. Thus, for most of the federal budget, the reform approach relatively favored by the wealthy is generally not followed.
Gilens’ study exaggerates the influence of the rich for another reason. By looking at differences in the relative strength of support for policies, “a federal policy enacted with the support of 80 percent of the wealthy and 70 percent of the middle and lower class would count as evidence of the upper class’s greater political clout.”193 But that would be a policy that is strongly supported by all income groups.
In their 2017 study, Branham, Soroka, and Wlezien looked at policy outcomes just on those issues where majorities of the middle class and rich disagree.194 In these situations, the rich got their way 53 percent of the time versus 47 percent of the time for the middle class. That is a fairly small difference, though one that increases slightly in favor of the rich when there are stronger differences in opinion. In other words, when the majority of the rich favors a policy and a majority of the middle class opposes it, the policy is adopted 37 percent of the time, compared to 26 percent of the time when the rich oppose and the middle favor. Over the 22-year period examined by the authors, that means the rich got their way 11 more times than the middle class, equivalent to just one bill every two years. This indicates that the rich’s views may be favored in federal policy outcomes, but the size of the effect is small.
Finally, a statistical study by Eric Brunner, Stephen Ross, and Ebonya Washington found that the views of the rich were not favored in legislation. They created a unique data set based on 77 times from 1991 to 2008 that California state legislators voted on the same proposal as the public voted on in a referendum. They compiled information on the ballot votes by neighborhood income levels and found:
Contrary to popular view, we do not find that less income means less representation. Analyzing the voting behavior of state legislators on 77 proposals on which both the legislature and the public cast ballots, we find first that the opinions of higher and lower income voters within a district are highly correlated on these issues and thus it is impossible to represent the views of one group and not also represent the views of the other.
What differences there are in representation do not result in lower income voters’ consistent disadvantage. While Republican legislators more frequently vote congruently with the view of their highest income constituents, Democrats are more likely to vote the view of their lowest income constituents… . What is clear is that our findings on representation by income group have more to do with party than with income.195
Does Rising Wealth Inequality Undermine Democracy?
There is little evidence that wealth inequality undermines democracy today, but is there reason to worry about the future? Pessimists such as Milanović see us drifting toward plutocracy if wealth inequality rises and the wealthy take greater control of politics.
The wealthy have always been involved in politics, but politicians ultimately need votes, not money, and billionaires represent few votes. Consider that wealth inequality was higher across many Western countries in the 19th century and early 20th century to the extent we can measure it, but that was precisely when many nations were widening the voting franchise under pressure from the general public.
People, including rich people, vote based on many factors, not just their economic self-interest.196 Voters make choices based on ideological beliefs, personalities of politicians, and the stances of their favored parties, which stand on a bundle of electoral promises. Special interests influence politics, but that usually comes from organized groups representing substantial numbers of voters, such as industries and unions.
Little evidence exists that rising wealth inequality leads to political outcomes less representative of ordinary peoples’ preferences. Gilens’ work purports to show that the wealthy’s influence on policy outcomes has been rising since the 1960s, coinciding with rising inequality that has made campaign contributions from the rich more important.
However, Gilens’ results suggest that a party’s degree of political control is a far more important determinant of responsiveness than income levels. When a U.S. political party has a strong majority and political gridlock is low, policy outcomes are only weakly related even to the rich’s preferences and unrelated to the least well-off. Parties instead deliver on their activists’ preferences. Unsurprisingly, it is when elections are close or control of government uncertain that politicians appear to respond more closely to the public’s preferences.
Liberals worry that political contributions from the wealthy may buy politicians’ votes, but substantial evidence rejects that idea. In the final term of members of Congress, we might expect voting patterns to change as members have less need to attract donations. But economists Stephen Bronars and John Lott found no change in politicians’ recorded voting patterns in politicians’ final term.197 This supports the idea that donors donate to members they agree with, rather than donating in expectation of changing member votes.
Summarizing recent academic research, economist Thomas Stratmann found it showed that “campaign contributions have not had much of an effect on legislative voting behavior.”198 Similarly, a study by Stephen Ansolabehere, John M. de Figueiredo, and James M. Snyder Jr. examined 40 statistical studies on whether campaign contributions affected voting in Congress. They found, “contributions show relatively few effects on voting behavior. In three out of four instances, campaign contributions had no statistically significant effects on legislation or had the ‘wrong’ sign.”199 In their own statistical analysis, they found:
Overall, our findings parallel that of the broader literature. As regressions like these make clear, the evidence that campaign contributions lead to a substantial influence on votes is rather thin. Legislators’ votes depend almost entirely on their own beliefs and the preferences of their voters and their party. Contributions explain a miniscule fraction of the variation in voting behavior in the U.S. Congress. Members of Congress care foremost about winning reelection. They must attend to the constituency that elects them, voters in a district or state, and the constituency that nominates them, the party.200
Liberals also worry that wealthy people are more likely to favor cuts to social programs and that if wealthy people gain more political power, the welfare state would be cut. Yet, as wealth inequality has risen modestly since the 1980s, federal social spending has grown substantially, not shrunk. Total federal and state social spending as a share of GDP has risen from 9.6 percent in 1980 to 14.3 percent by 2018.201
Across countries there is no correlation between the wealth share of the top 1 percent and social spending as a percentage of GDP. This is clear in Figure 4 and confirmed by a simple regression analysis.202 Note that “social spending” is a broad measure created by the Organisation for Economic Co-operation and Development and includes “cash benefits, direct in-kind provision of goods and services, and tax breaks with social purposes.”203
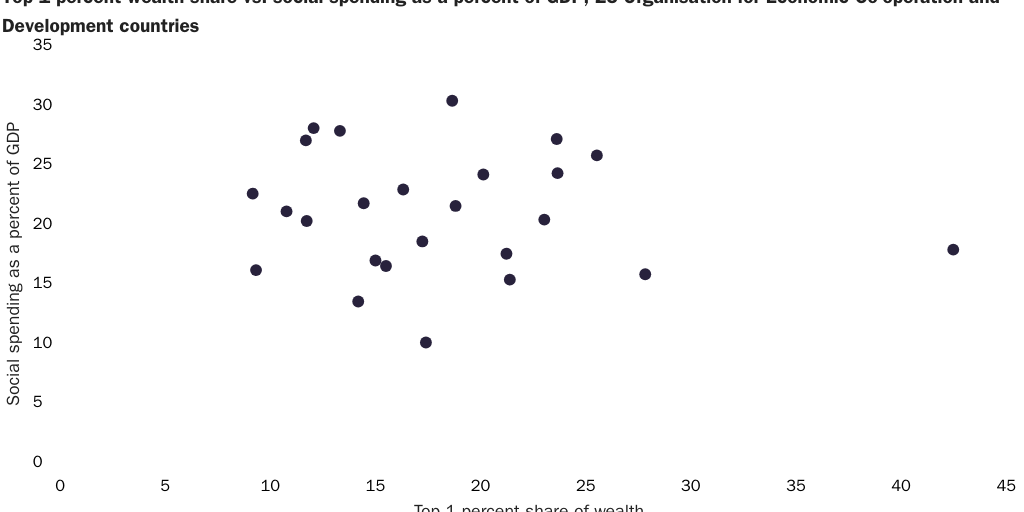
Another worry is that money “buys” elections and that since the wealthy have lots of it, they have inordinate ability to move elections. Money is an important campaign resource, but it certainly does not guarantee outcomes.204 Donald Trump won the White House in 2016 even though his official campaign raised and spent just over half that of Hillary Clinton’s campaign.205 In the 2008 GOP primary, wealthy Mitt Romney spent more than twice as much as John McCain—much of it his own money—but McCain won the contest.206
The 2012 congressional elections are a prime example of the impotence of money when election winds are blowing the other way. The public swung to the Democrats that year, and GOP lobby groups spent huge amounts of money to dismal results. Karl Rove’s American Crossroads spent $104 million backing and opposing candidates and was successful in very few of the races it targeted.207 GOP-oriented lobby groups—such as the National Rifle Association and U.S. Chamber of Commerce—also did poorly.208
The Washington Post summarized the role of money in the 2012 election:
A clutch of billionaires and privately held corporations fueled more than $1 billion in spending by super PACs and nonprofits, unleashing a wave of attack ads unrivaled in U.S. history. Yet Republican groups, which dominated their opponents, failed to achieve their two overarching goals: unseating President Obama and returning the Senate to GOP control.
… Even in the House, which remains comfortably in Republican hands, GOP money groups struck out repeatedly in individual races they targeted … In 24 of the most competitive House contests, Democratic candidates and their allies were outspent in the final months but pulled out victories anyway.
… Wealthy donors were so central to Romney’s campaign that a swarm of private luxury jets caused a traffic jam at Boston’s airport Tuesday just before the nominee’s election-night party.
But conservative super PACs and secretive nonprofit groups—which spent up to $10 million a day on the presidential race alone—couldn’t move the needle far enough to prevail in almost any of the major races they targeted.
… Indeed, if election investments are like the stock market, a lot of billionaires just lost their shirts. American Crossroads, co-founded by GOP political guru Karl Rove, and Restore Our Future, which focused on supporting Romney in the presidential race, together spent more than $450 million, with little to show for it in the end. The groups relied on six- and seven-figure checks from energy executives, hedge-fund managers and other wealthy donors eager to oust Obama and congressional Democrats.209
Studies appear to show that even though money raised correlates with electoral outcomes, it is not the causal factor. Large amounts of campaign money do not buy elections, rather what usually happens is that highly electable candidates have an easier time raising money.210 Note that self-financed wealthy candidates tend to do relatively poorly at elections.211
Some liberals think that today’s level of wealth inequality is by itself evidence of the wealthy capturing the democratic process. They cannot see any other reason why policymakers have not voted for higher taxes on the rich or more generous social programs than we already have. They seem to surmise that the rich must have lobbied to distort the public debate.
Instead, polling shows that many voters do not agree with more redistributionist policies or that they give it low priority. Two percent or less of the public say “the gap between rich and poor” is the “most important issue” facing the country.212 Even those who express concern disagree about what to do about it. Using surveys back to 1966, Graham Wright found that when concern for inequality rises, support for redistributive policies does not follow suit.213 Voters may not trust the government to effectively address the issue, or they blame government for creating the inequality. Polls also show that the public dislikes certain leveling policies, such as estate taxes on the wealthy.214 Many people seem to have views about what is “fair” that are unrelated to their level of income or wealth.
In sum, there is no clear evidence that wealth inequality undermines democracy in the United States. The wealthy do not have homogeneous political views, and where their views as a group do diverge from others, their preferences do not dominate legislative outcomes. The wealthy help fund campaigns and lobby groups, but the role of money in politics is complex. Studies and anecdotal evidence indicate that it is not easy to buy elections or votes in Congress.
Despite the anti-wealth rhetoric on the presidential campaign trail today, most Americans admire honest top earners and do not believe they are ruining democracy. A 2019 Cato-YouGov poll found that 62 percent of Americans surveyed do not believe that “billionaires are a threat to democracy” and 69 percent agree that billionaires “earned their wealth by creating value for others.”215
Nonetheless, the poll found that there is a large partisan divide over many issues regarding the wealthy. Political liberals tend to believe that political connections and luck are key factors in the success of the wealthy, while conservatives tend to think that hard work is more important.216 Some of the reforms we have suggested in this study—such as cutting cronyist subsidies and removing barriers to middle-class wealth-building—would help respond to liberal concerns but without undermining economic growth and incentives for wealth creation.
Citation
Edwards, Chris, and Ryan Bourne. “Exploring Wealth Inequality.” Policy Analysis No. 881, Cato Institute, Washington, DC, November 5, 2019. https://doi.org/10.36009/PA.881.

About the Authors


This work is licensed under a Creative Commons Attribution-NonCommercial-ShareAlike 4.0 International License.