The federal government spent more than $2.3 trillion in 2016 on the welfare state, an amount equal to approximately 60 percent of all federal outlays in that year. About $1.6 trillion of those expenditures went to Social Security and Medicare, and the other roughly $700 billion was used to fund means-tested welfare benefits. Based on data from the Survey of Income and Program Participation, we find that immigrants consume 21 percent less welfare and entitlement benefits than native-born Americans on a per capita basis. The per capita cost of providing welfare to immigrants is substantially less than the per capita cost of providing welfare to native-born Americans.
Background
Immigrant consumption of welfare benefits has been a contentious policy issue for decades. This brief updates previous Cato policy briefs on immigrant welfare consumption in an attempt to supply better evidence to policymakers.1 The federal government spent more than $2.3 trillion in 2016 on the welfare state, an amount equal to approximately 60 percent of all federal outlays in that year.2 About $1.6 trillion of those expenditures went to Social Security and Medicare, whose intended beneficiaries are the elderly, while the other $700 billion went to means-tested welfare benefits, whose intended beneficiaries are the poor.3
Eligibility for means-tested programs and the value of their benefits are based on a variety of factors including recipients’ immigration status, income, and employment. For the purposes of this brief, means-tested programs include Medicaid, the Supplemental Nutrition Assistance Program (SNAP), Supplemental Security Income (SSI), Temporary Assistance for Needy Families (TANF), and Women, Infants, and Children (WIC).
Entitlement programs are intended to aid the elderly, and age is the primary eligibility requirement for entitlements. The amount of tax recipients paid into the program and the number of years they worked also affect their eligibility and the value of benefits they receive. For the purposes of this brief, Medicare and Social Security benefits (SSB) are entitlement programs. Social Security benefits include self-benefits and benefits on behalf of children. The Survey of Income and Program Participation (SIPP) doesn’t survey every welfare or entitlement program, but the programs that it does survey cover 93 percent of American welfare state spending in 2016.
Methodology and Data Sources
This brief uses Wave 4 microdata from the 2014 Census Bureau’s Survey of Income and Program Participation that covers the use rates and dollar values of means-tested welfare and entitlement programs from January to December 2016. SIPP is a household-based survey constructed from a series of national panels, which represent respondents interviewed over a multiyear period who provided information on the relationship between their household income, participation in government programs, and household demographic data.4 Cato’s earlier policy brief on immigrant welfare consumption relied on data from the Census Bureau’s Annual Social and Economic Supplement of the Current Population Survey (CPS) for the year 2016. This brief reexamines the year 2016 with SIPP data because it is superior to CPS data: SIPP accounts for more welfare programs than the CPS, includes more-detailed demographic data, and is less subject to underreporting of welfare use and benefit levels.
There are several steps to calculating the value of per capita welfare consumption by both immigrants and native-born Americans. First, SIPP is used to calculate the total dollar value of welfare per program used by immigrants and native-born Americans. Second, the SIPP population data is used to produce the per capita amount of welfare consumed for each program. Third, the weighted proportion of all welfare benefits used by immigrants and native-born Americans is calculated. Fourth, adjustments are made for underreporting of welfare consumption—a major problem in all surveys—by multiplying the weighted proportion in step three by the actual budget outlays for welfare programs in 2016 according to the U.S. budget.5 Step four assumes that native-born Americans and immigrants underreport welfare consumption at the same rate. Fifth, the product from the fourth step is divided by the real population of native-born Americans and immigrants as reported by the Current Population Survey. The result is the per capita welfare cost for immigrants and native-born Americans for each welfare and entitlement program.
In order to understand our results, it is necessary to account for nuances in welfare program eligibility in the SIPP dataset. Program eligibility and the value of benefits received are based on either the individual level or the household level, a concept known as the unit of assistance. Individuals are the unit of assistance for Medicaid, SSI, SSB, and Medicare. The household is the unit of assistance for WIC, TANF, and SNAP. The SIPP data set does not allow us to divide the welfare benefits legally received by the members of a household for programs with a household unit assistance, so we divide the benefits from WIC, TANF, and SNAP equally among all members of the household.
Other studies evaluating immigrant welfare participation and consumption use the household as the unit of analysis.6 We dispute this approach because many spouses and children of immigrants are native-born Americans. Counting native-born welfare consumption as immigrant consumption improperly inflates estimates of immigrant welfare use and deflates native-born consumption. Moreover, this approach reduces use rates and benefit levels for means-tested welfare and entitlement programs that have an individual unit of assistance.7 A recent rule by the Homeland Security Department firmly sides with our preferred measure of using an individual unit of assistance rather than the flawed household approach.8
Because SIPP does not record the dollar amount of Medicaid and Medicare benefits expended per user, we relied on the 2016 Medical Expenditure Panel Survey (MEPS) to quantify the per user expenditure rate. We first selected individuals who reported Medicare and/or Medicaid coverage in 2016. We then identified the individuals who reported consuming healthcare services that account for most healthcare expenditures: hospital stays, prescription medication use, and physician visits.9 The per user expenditure rate for Medicaid and Medicare benefits did not alter our results.10
Results
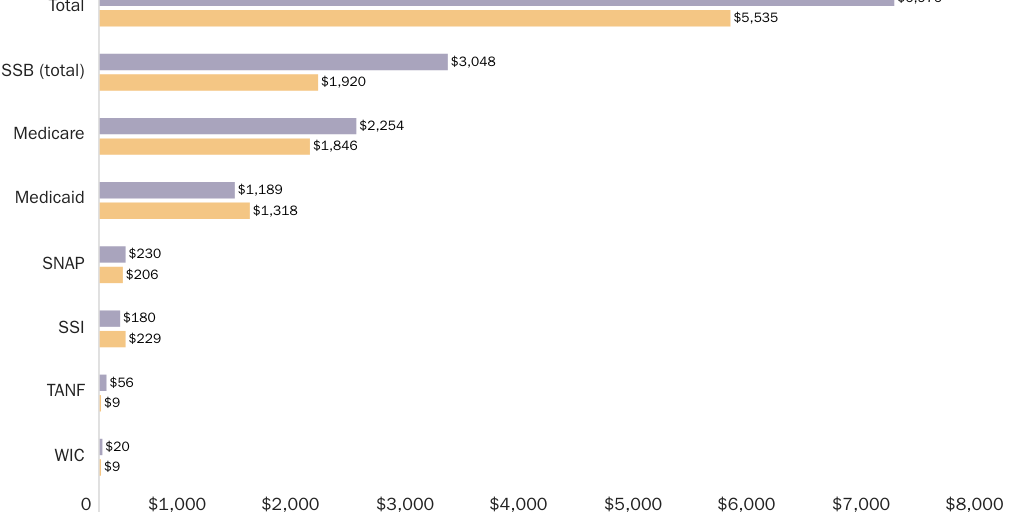
Figure 1 shows the average per capita welfare costs by program for all native-born Americans and all immigrants. The average value of welfare benefits per immigrant was $5,535 in 2016, about 21 percent less than the $6,976 average value of welfare benefits per native-born American. The average immigrant consumed $129 more in Medicaid and $48 more in SSI benefits than the average native-born American, but the average native-born American consumed more benefits in all other welfare programs than the average immigrant.
Per capita welfare costs vary considerably by age and program. Figure 2 shows the per capita welfare cost for native-born American and immigrant children aged 0–17. Immigrant welfare costs for children in this age bracket are 16 percent lower than native-born welfare costs in the same age bracket. Figure 2 evaluates fewer welfare programs than Figure 1 because children in the 0 to 17 age bracket do not fulfill eligibility requirements for many means-based welfare programs.
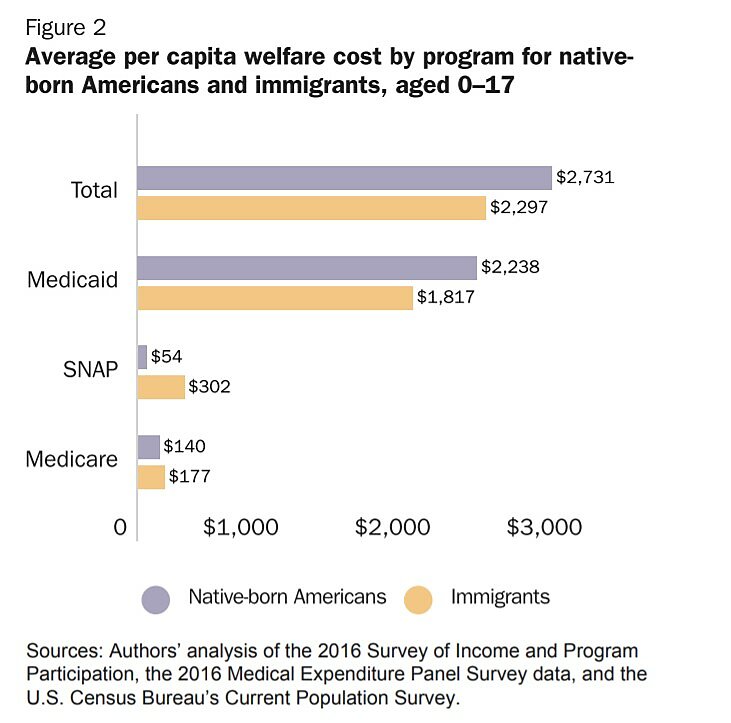
Figure 3 shows the per capita welfare cost for working-age (18–64) immigrants and native-born Americans. The value of welfare benefits consumed by immigrants is about 35 percent less than the value of benefits consumed by native-born Americans in that age bracket. WIC and Medicaid are the only programs where the average value of welfare benefits consumed per immigrant is higher than the average value of welfare benefits consumed per native-born American, probably because more immigrants are legally eligible to receive benefits from those programs.
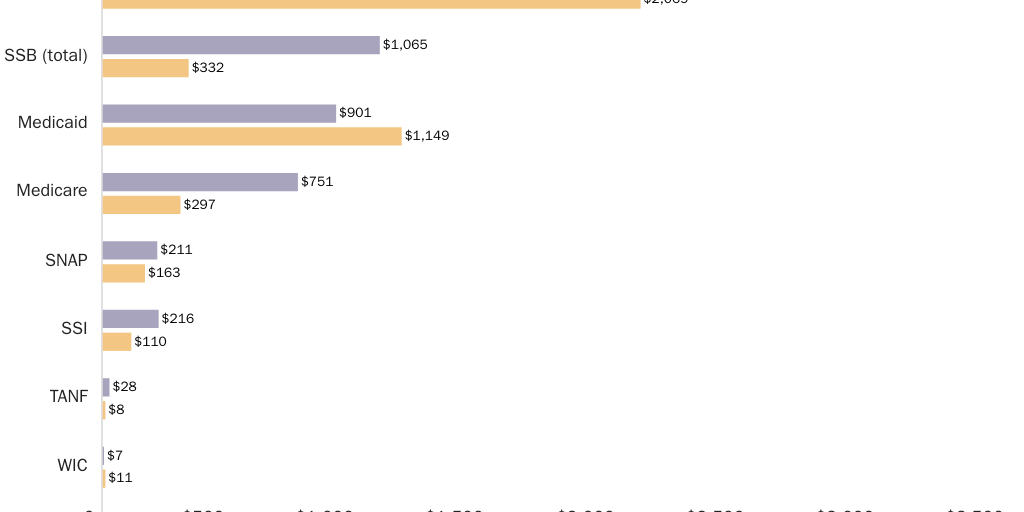
Figure 4 displays the per capita welfare cost for native-born Americans and immigrants aged 65 and above. Elderly immigrants aged 65 and above, on average, consume about 8 percent less welfare benefits than native-born Americans of the same age. When compared to Figures 2 and 3, Figure 4 shows that the average per capita cost for Medicare, SSI, SNAP, and SSB for elderly immigrants is higher than the average per capita cost for younger immigrants. That difference is probably the result of elderly immigrants having less access to Medicare and SSB, which pay out more in benefits. Figure 4 contains fewer welfare programs because the average dollar value of welfare consumption for the excluded programs is close to zero.
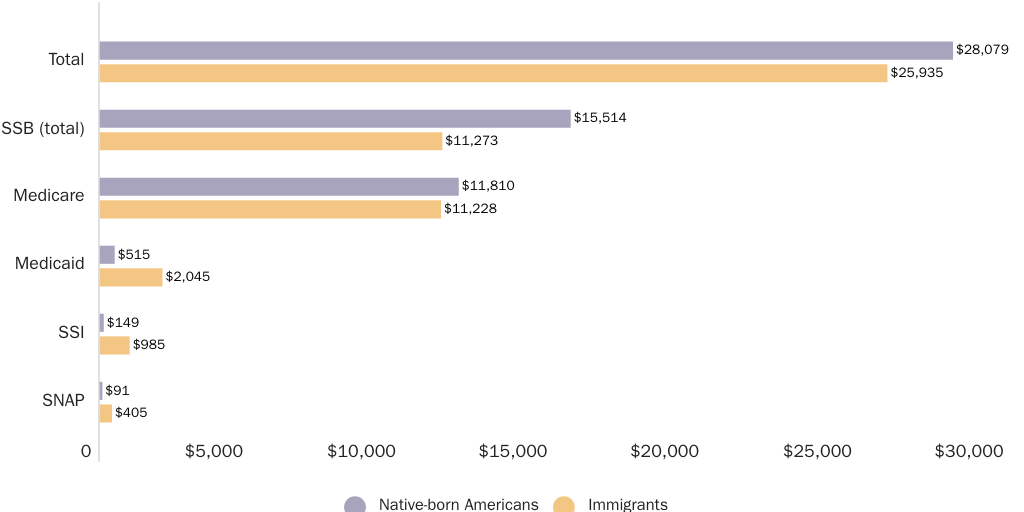
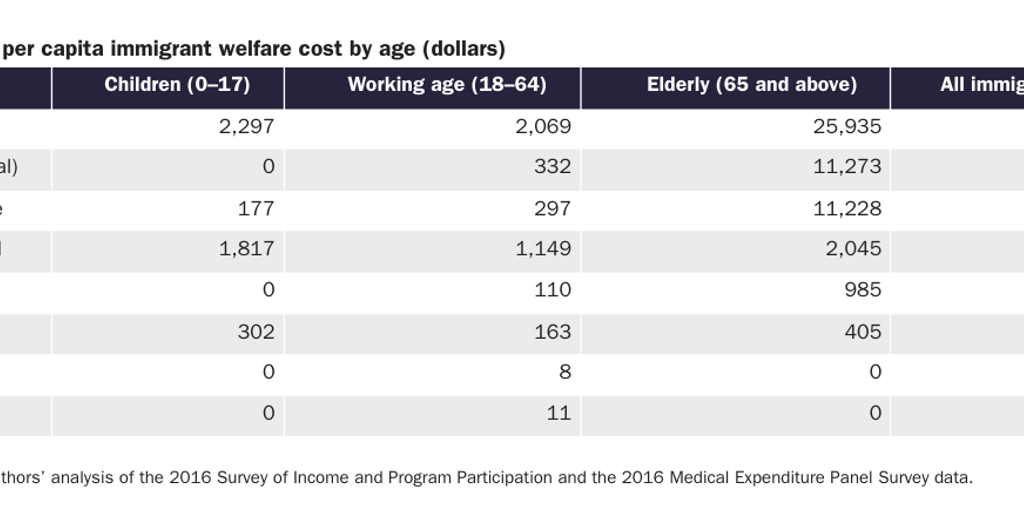
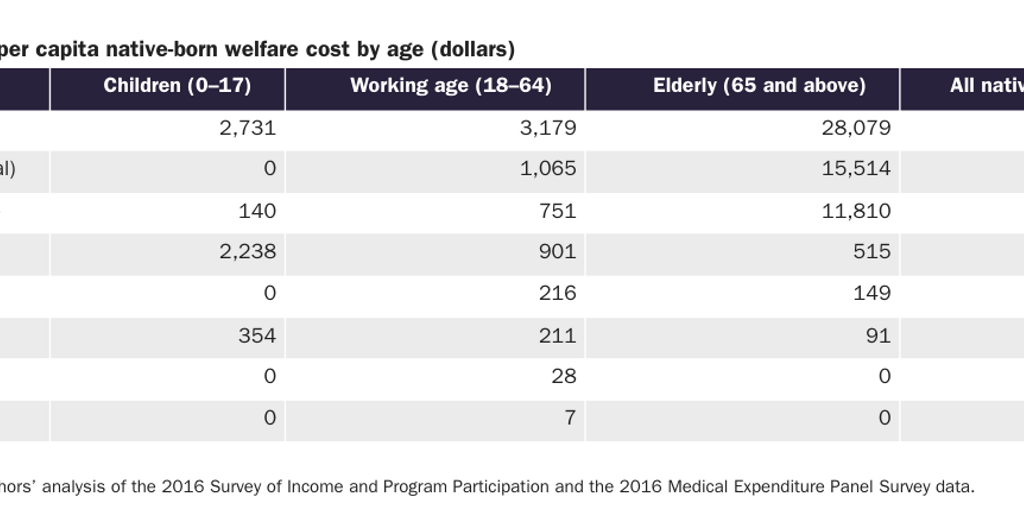
Table 1 shows the average per capita immigrant welfare cost by program and age. Immigrant age significantly alters the per capita welfare cost: elderly immigrants aged 65 and above consume about 12.5 times more welfare benefits than immigrants aged 18–64 and about 11.3 times more welfare benefits than immigrant children aged 0–17. Reducing the welfare consumption of elderly immigrants aged 65 and older will yield the largest per capita fiscal benefits. Table 2 shows the same numbers for native-born Americans by age.
Welfare Use Rates
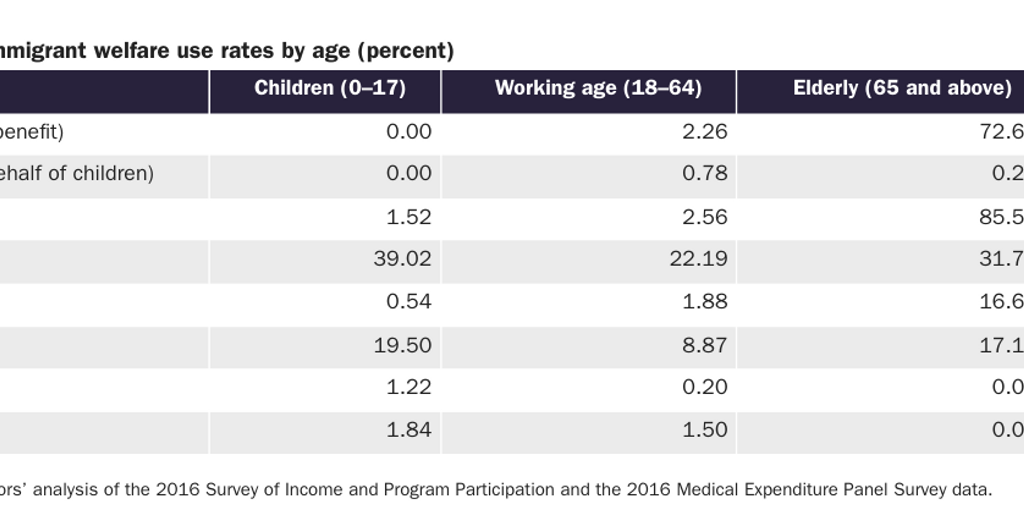
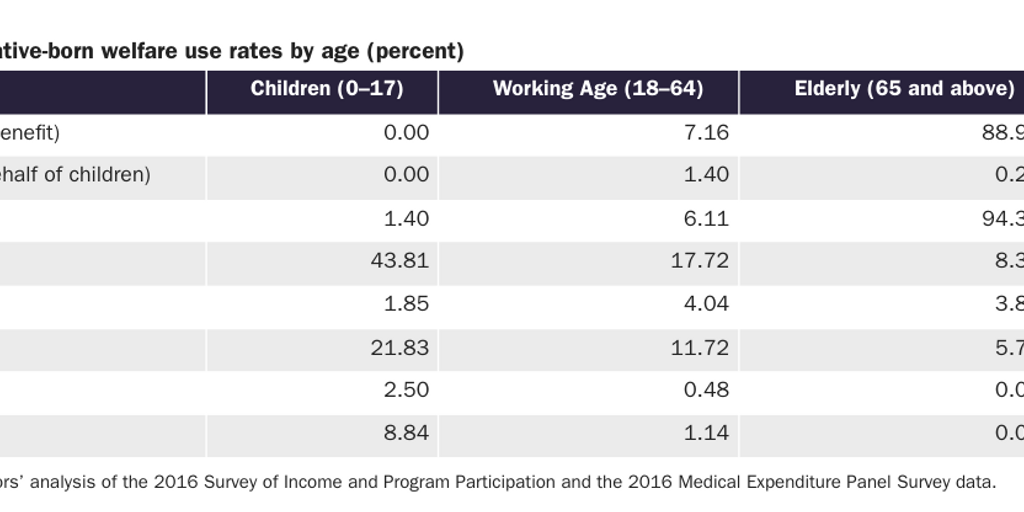
The figures and tables above present the weighted average value of welfare benefits consumed per capita. Tables 3 and 4 show the use rates for each age group of native-born Americans and immigrants by welfare program. We consider a person to have used the welfare program if the welfare benefit was consumed at any point during the 2016 calendar year. The specific definition of the Social Security benefit in both Table 3 and Table 4 are divided slightly differently than the earlier reported tables and figures.
Discussion
Overall, immigrants consume about 21 percent fewer welfare and entitlement benefits than native-born Americans. Immigrants tend to consume more SSI and Medicaid benefits than native-born Americans, possibly due to a substitution effect. Fewer immigrants qualify for the more expensive entitlement programs such as Medicare, while more have legal access to Medicaid. For instance, states have the option of providing Medicaid to pregnant lawful permanent residents, immigrant children, and in emergency situations.11 Refugees and asylum seekers also have access to means-tested welfare benefits for their first seven years that they are in the United States.12 Minor legal changes can significantly reduce immigrants’ access to all of these programs.13
Our findings here are similar to earlier Cato research, which used the CPS instead of the SIPP data.14 Evaluating individual welfare use—the correct methodology according to the Department of Homeland Security and most other researchers in the field—is superior to the flawed household approach and yields directionally similar results regardless of whether the CPS or SIPP data are used.15 In other words, other evaluations of immigrant welfare use based on the household methodology found that immigrants use more welfare because they counted the welfare use of non-immigrants in the household.
Conclusion
Native-born Americans consume, on an average per capita basis, more welfare and entitlement benefits than immigrants. The dollar differences are most pronounced for the entitlement programs of Medicare and Social Security benefits, which are the two largest programs in the American welfare state. The largest percentage difference in per capita welfare consumption is between working-age immigrants and working-age native-born Americans. Although immigrants, on a per capita basis, consume more Medicaid and SSI than native-born Americans, those are the exceptions.

About the Authors
Tu Le has an MS in economics from Texas A&M University. Alex Nowrasteh is the director of immigration studies at the Cato Institute’s Center for Global Liberty and Prosperity.

This work is licensed under a Creative Commons Attribution-NonCommercial-ShareAlike 4.0 International License.