President Trump is considering a cancellation of the Deferred Action for Childhood Arrivals (DACA) program. DACA grants temporary work permits and lawful immigration presence to many young illegal immigrants who were brought to the United States as children.1 At last count, 886,814 of these young illegal immigrants received DACA since President Barack Obama created the program through executive action on June 15, 2012.2 A potential DACA beneficiary is called a DREAMer, a term derived from the 2001 Development, Relief, and Education for Alien Minors (DREAM) Act, a popular piece of legislation designed to legalize many illegal immigrants who were brought to the United States at a young age.3 News of individual DREAMers committing crimes contributed to the public perception that DREAMers are disproportionately crime prone and may influence President Trump’s decision to cancel or continue DACA.4 In fact, DREAMers have lower incarceration rates than native-born Americans of the same age and education level.
BACKGROUND
President Barack Obama created DACA on June 15, 2012, to shield DREAMers from deportation, grant them lawful presence, and issue them temporary work permits.5 This brief defines DREAMers as illegal immigrants who were brought here as children and who meet DACA’s age, residency, educational, and other qualifications, ignoring the bar on criminals, as are detailed by the U.S. Citizenship and Immigration Services (USCIS).6 The estimated size of the DREAMer population who could apply for DACA varies from about 1.1 million, according to the Pew Research Center, to about 1.9 million, according to the Migration Policy Institute.7
There is a vast body of empirical literature showing that legal and illegal immigrants do not increase local crime rates, are less likely to commit crimes than their native-born peers, and are less likely to be incarcerated than are native-born Americans.8 There are two broad strands in this research: (a) an area approach that analyzes how immigrants affect crime rates in locations where they settle, and (b) immigrant incarceration rates.9 This is the first brief that estimates the DREAMer incarceration rate.
METHODOLOGY
This brief uses the United States Census’s American Community Survey (ACS) to estimate the nationwide incarceration rate for DREAMers for 2015. ACS inmate data are high quality, and they count the incarcerated population by their nativity and citizenship status but do not ask whether those individuals are or ever have been illegal immigrants.10 As a result, we employ a common residual statistical technique to identify illegal immigrant prisoners who are DREAMers.11 We do not consider criminality when estimating the size of the DREAMer population as doing so would show that they have an incarceration rate of roughly zero because they are excluded from DACA if they are convicted of a felony, a significant misdemeanor, or three or more misdemeanors. Thus, a DREAMer is a respondent who meets all the qualifications for DACA without regard to criminal convictions. We define a DACA-ineligible illegal immigrant as an illegal immigrant in the 18-to-34 age range with at least a high school education who does not meet one of the other noncriminal qualifications as defined by USCIS.12
There are three steps in the residual statistical technique that we apply to investigating DACA incarceration rates. The first step is to identify incarcerated illegal immigrants by counting those who are foreign-born and who entered after 1982 (the cutoff date for the 1986 Reagan amnesty), who are not receiving Social Security or Railroad Retirement Income, who are not covered by Indian Health Services, who are not citizens of the United States, who are not living in a household where somebody received food stamps (unless the individual has a child living with him or her, as the child may be eligible if he or she is a U.S. citizen), and who are not of Puerto Rican or Cuban descent. In an earlier brief, we excluded those who served in the military, but some DREAMers can enlist, so we removed that filter.13
The second step is to shrink that pool of likely incarcerated illegal immigrants to those who are DREAMers on the basis of whether they meet the DACA eligibility requirements. On the basis of the USCIS guidelines for DACA, we counted only prisoners who were younger than age 31 on June 15, 2012, came to the United States before reaching their 16th birthday, and graduated from high school or its equivalent.14 The other DACA requirements are not recorded in the Census. We then used the DACA education, age, and residency qualifications to create a comparison group of nonincarcerated DREAMers to estimate their incarceration rate.15
The third step is to estimate the number of incarcerated and nonincarcerated native-born Americans, DACAineligible illegal immigrants, and legal immigrants to create comparison groups. For each of these three categories, we include only respondents who have at least a high school degree and are ages 18 to 34 because education and age are important predictors of incarceration.
There are a few downsides to this approach. One downside is that our estimate of the illegal immigrant and DREAMer populations will include some legal immigrants who are here on other visas but whose ACS responses are consistent with those of illegal immigrants.16 Another downside is that the ACS data also include those incarcerated in mental health, handicapped, or elderly care institutions alongside prisoners in adult correctional facilities. This complicating factor will only slightly overstate the number of DREAMer prisoners because (a) the majority of those counted in the public-use microdata version of the ACS are in correctional facilities, (b) we are able to exclude students, and (c) the age is limited to those in the 18-to-34 range, which means that nobody in elderly care facilities and few in mental health institutions are included.17
INCARCERATIONS
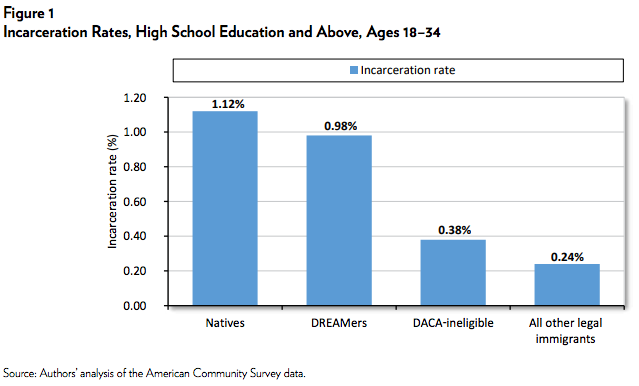
We estimate that DREAMers had an incarceration rate of 0.98 percent in 2015 compared to a native-born incarceration rate of 1.12 percent, a DACA-ineligible illegal immigrant incarceration rate of 0.38 percent, and a legal immigrant incarceration rate of 0.24 percent (Figure 1). The native-born incarceration rate is 14 percent higher than the DREAMer incarceration rate, while DACA-ineligible illegal immigrants and legal immigrants have the lowest rates of all. Our residual statistical technique estimates that there are about 1.4 million DREAMers in the United States, which increases our confidence in this estimate because it lies right between the DREAMer population estimates made by the Pew Research Center and the Migration Policy Institute.18
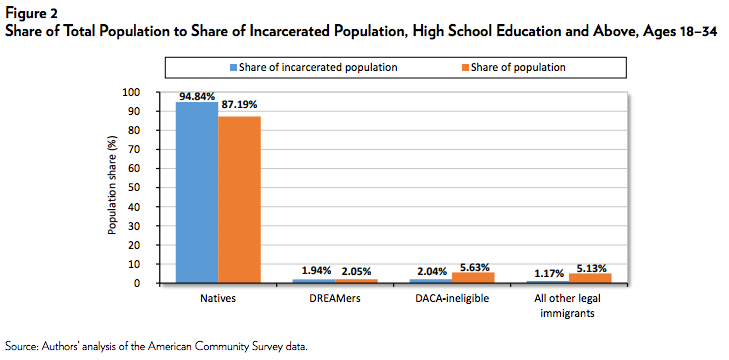
DREAMers are underrepresented in adult correctional facilities because they make up 2.05 percent of the total U.S. population in the 18-to-34 age range with at least a high school or equivalent degree but are only 1.94 percent of the incarcerated prisoners with those same characteristics (Figure 2). By contrast, natives in that range are overrepresented in adult correctional facilities because they make up 87.19 percent of the population but are 94.84 percent of all prisoners. DACAineligible illegal immigrants and all other legal immigrants are underrepresented in adult correctional facilities relative to their percentage of the population.
DEMOGRAPHIC AND SOCIAL CHARACTERISTICS
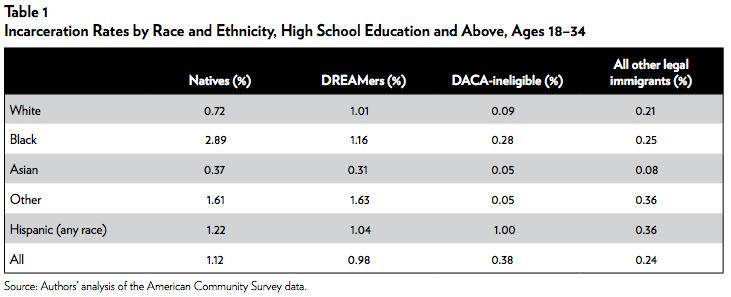
Incarceration rates by race and ethnicity paint a more nuanced picture (Table 1). DREAMers who are black, Asian, or Hispanic of any race have lower incarceration rates than natives of the same ethnicity, race, education, and age. However, white DREAMers and those who selfidentify as other have higher incarceration rates than their native-born peers. Furthermore, DACA-ineligible illegal immigrants and all other legal immigrants have lower incarceration rates than natives or DREAMers in every racial and ethnic category.
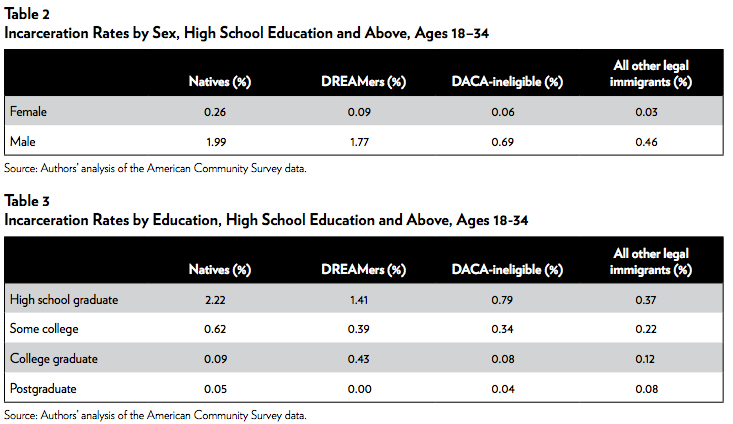
The incarceration rate for DREAMers and natives varies tremendously by sex (Table 2). The native-born female incarceration rate is an astounding 2.86 times as great as the female DREAMer incarceration rate, which is below one-tenth of one percent. The native-born male incarceration rate is 12.5 percent higher than the DREAMer rate. Like the previous tables and graphs, the incarceration rates of DACA-ineligible illegal immigrants and of all other legal immigrants is even lower when compared to natives, especially for women. The incarceration rate by education shows that natives are more likely to be incarcerated than DREAMers except for those with only a college education—an odd anomaly (Table 3). Meanwhile, the incarceration rates for DACA-ineligible illegal immigrants and all other legal immigrants are generally below those of natives and DREAMers.
CONCLUSION
DREAMers are less likely to be incarcerated than nativeborn Americans with the same age and education. DACAineligible illegal immigrants and all other legal immigrants are even less likely to be incarcerated. The incarceration rate for DREAMers is closer to that of native-born Americans because they came here at a younger age and are more assimilated into American culture.19 This brief provides demographic information to better inform the public policy debate over DACA and a broader legalization. In fact, the even-lower incarceration rate for DACA-ineligible illegal immigrants suggests that Congress should expand the parameters of any future legalization because the beneficiaries are less crime prone than either DREAMers or natives. Despite individual news stories and anecdotes to the contrary, DREAMers are less crime prone than native-born Americans.
NOTES
1 “Consideration of Deferred Action for Childhood Arrivals (DACA),” U.S. Citizenship and Immigration Services, https://www.uscis.gov/humanitarian/consideration-deferred-actionchildho….
2 Data Set: Form I‑821D Deferred Action for Childhood Arrivals, https://www.uscis.gov/tools/reports-studies/immigration-formsdata/data-….
3 Development, Relief, and Education for Alien Minors Act, S. 1291, 107th Cong. (2001).
4 Alicia A. Caldwell, “15 Immigrants Protected from Deportation Arrested in Sweep,” Associated Press, March 13, 2015, https://apnews.com/c21ea7a60a7f46aba7749e869ca2e4b9/15-immigrants-prote…; Ronald W. Mortenson, “DACA: Granting Amnesty to Dreamers Committing Crimes While Abandoning Their Victims,” Center for Immigration Studies blog, March 10, 2017, https://cis.org/Mortensen/DACA-Granting-Amnesty-Dreamers-Committing-Cri…; Jenny Jarvie, “Deportations of ‘Dreamers’ Who’ve Lost Protected Status Have Surged Under Trump,” Los Angeles Times, April 19, 2017, http://www.latimes.com/nation/la-na-daca-deportations-20170419-story.ht….
5 Tom Cohen, “Obama Administration to Stop Deporting Some Young Illegal Immigrants,” CNN, June 16, 2012, http://www.cnn.com/2012/06/15/politics/immigration/index.html.
6 There are other illegal immigrants who were brought here as children who commonly call themselves and are referred to as DREAMers, but for the purposes of this brief, we count only those who meet all noncriminal DACA qualifications, https://www.uscis.gov/humanitarian/consideration-deferred-actionchildho….
7 Migration Policy Institute, “Deferred Action for Childhood Arrivals (DACA) Data Tools,” Data Hub, http://www.migrationpolicy.org/programs/data-hub/deferred-actionchildho…; Jens Manuel Krogstad and Ana Gonzalez-Barrera, “If Original DACA Program Is a Guide, Many Eligible Immigrants Will Apply for Deportation Relief,” Pew Research Center, FactTank, December 5, 2014, http://www.pewresearch.org/fact-tank/2014/12/05/if-original-daca-progra….
8 Michelangelo Landgrave and Alex Nowrasteh, “Criminal Immigrants: Their Numbers, Demographics, and Countries of Origin,” Immigration Research and Policy Brief no. 1, Cato Institute, March 15, 2017; Kristin F. Butcher and Anne Morrison Piehl, “The Role of Deportation in the Incarceration of Immigrants,” in Issues in the Economics of Immigration, ed. George J. Borjas (Chicago: University of Chicago Press, 2000), pp. 351–86; Kristin F. Butcher and Anne Morrison Piehl, “Why Are Immigrants’ Incarceration Rates So Low? Evidence on Selective Immigration, Deterrence, and Deportation,” NBER Working Paper no. 13229, National Bureau of Economic Research, July 2007; Alex Nowrasteh, “Immigration and Crime—What the Research Says,” Cato at Liberty, July 14, 2015, https://www.cato.org/blog/immigration-crime-what-research-says.
9 Butcher and Piehl, “The Role of Deportation in the Incarceration of Immigrants”; Butcher and Piehl, “Why Are Immigrants’ Incarceration Rates So Low?”; Walter A. Ewing, Daniel E. Martinez, and Ruben G. Rumbaut, “The Criminalization of Immigration in the United States,” American Immigration Council Special Report, July 2015.
10 The 2000 Census for Group Quarters was plagued with sampling problems that seriously diminished its accuracy. However, those problems were resolved in subsequent American Community Surveys. See Constance F. Citro, Daniel L. Cork, and Janet L. Norwood, The 2000 Census: Counting Under Adversity (Washington, D.C.: National Research Council, 2004), pp. 297–301, for a discussion of the problems in the 2000 Census; ee Constance F. Citro and Graham Kalton, Using the American Community Survey: Benefits and Challenges, (Washington, D.C.: National Research Council, 2007), pp. 170–72 for a description on how the deficiencies in the 2000 Census were remedied in the ACS; see Steven A. Camarota and Jessica Vaughan, “Immigration and Crime: Assessing a Conflicted Issue,” Backgrounder, Center for Immigration Studies, November 18, 2009, n. 16, for further confirmation that the ACS provides much better long-form data than the 2000 Census does.
11 For more on these methods, see Jeffrey S. Passel and D’Vera Cohn, “Overall Number of U.S. Unauthorized Immigrants Holds Steady Since 2009,” Pew Research Center, September 20, 2016, pp. 22–32; Kristin F. Butcher and Anne Morrison Piehl, “The Role of Deportation in the Incarceration of Immigrants,” in Issues in the Economics of Immigration, ed. George J. Borjas (Chicago: University of Chicago Press, 2000), pp. 351–86; Enrico A. Marcelli and David M. Heer, “The Unauthorized Mexican Immigrant Population and Welfare in Los Angeles County: A Comparative Statistical Analysis,” Sociological Perspectives 41, no. 2 (1998): 279–302; Robert Warren, “Democratizing Data about Unauthorized Residents in the United States: Estimates and Public-Use Data, 2010 to 2013,” Journal on Migration and Human Security 2, no. 4 (2014): 305–28; Pia M. Orrenius and Madeline Zavodny, “Do State Work Eligibility Verification Laws Reduce Unauthorized Immigration?” IZA Journal of Migration 5, no. 1 (2016): 1–17.
12 Consideration of Deferred Action for Childhood Arrivals. (DACA).
13 Landgrave and Nowrasteh, “Criminal Immigrants.”
14 Consideration of Deferred Action for Childhood Arrivals (DACA).
15 Landgrave and Nowrasteh, “Criminal Immigrants.”
16 Ibid.
17 Many of the incarcerated respondents who are under the age of 18 are in mental health facilities, and very few are in prisons or jails. Many of those above the age of 54 are in elderly care institutions, but this cutoff does not affect the number of DACAeligible incarcerations because they must be under the age of 35 in 2012.
18 Migration Policy Institute, “Deferred Action for Childhood Arrivals (DACA) Data Tools,” Data Hub, http://www.migrationpolicy.org/programs/data-hub/deferred-actionchildho…; Jens Manuel Krogstad and Ana Gonzalez-Barrera, “If Original DACA Program Is a Guide, Many Eligible Immigrants Will Apply for Deportation Relief,” Pew Research Center, FactTank, December 5, 2014, http://www.pewresearch.org/fact-tank/2014/12/05/if-original-dacaprogram….
19 Rich Morin, “Crime Rises among Second-Generation Immigrants as They Assimilate,” Pew Research Center, FactTank, October 15, 2013, http://www.pewresearch.org/ fact-tank/2013/10/15/crime-rises-among-second-generationimmigrants-as-they-assimilate/.

About the Authors


This work is licensed under a Creative Commons Attribution-NonCommercial-ShareAlike 4.0 International License.