Many people believe that global population growth leads to greater poverty and more famines, but evidence suggests otherwise. Between 1960 and 2016, the world’s population increased by 145 percent. 1 Over the same time period, real average annual per capita income in the world rose by 183 percent. 2
Instead of a rise in poverty rates, the world saw the greatest poverty reduction in human history. In 1981, the World Bank estimated, 42.2 percent of humanity lived on less than $1.90 per person per day (adjusted for purchasing power). In 2013, that figure stood at 10.7 percent .3 That’s a reduction of 75 percent. According to the Bank’s more recent estimates, absolute poverty fell to less than 10 percent in 2015. 4
Rising incomes helped lower the infant mortality rate from 64.8 per 1,000 live births in 1990 to 30.5 in 2016. That’s a 53 percent reduction. 5 Over the same time period, the mortality rate for children under five years of age declined from 93.4 per 1,000 to 40.8. That’s a reduction of 56 percent. 6 The number of maternal deaths declined from 532,000 in 1990 to 303,000 in 2015 — a 43 percent decrease. 7
Famine has all but disappeared outside of war zones. In 1961, food supply in 54 out of 183 countries was less than 2,000 calories per person per day. 8 That was true of only two countries in 2013. 9 In 1960, average life expectancy in the world was 52.6 years. In 2015, it was 71.9 years — a 37 percent increase. 10
In 1960, American workers worked, on average, 1,930 hours per year. In 2017, they worked 1,758 hours per year — a reduction of 9 percent. 11The data for the world are patchy. That said, a personal calculation based on the available data for 31 rich and middle-income countries suggests a 14 percent decline in hours worked per worker per year. 12
Enrollment at all education levels is up. For example, the primary school completion rate rose from 74 percent in 1970 to 90 percent in 2015 — a 20 percent increase. 13 The lower secondary school completion rate rose from 53 percent in 1986 to 77 percent in 2015 — a 45 percent increase. 14 Tertiary school enrollment rose from 10 percent in 1970 to 36 percent in 2015 — a 260 percent increase. 15
Even our air is getting cleaner. In the United States, for example, aggregate emissions of six common pollutants (i.e., carbon monoxide, lead, nitrogen dioxide, ozone, fine and coarse particulate matter, and sulfur dioxide) fell by 67 percent between 1980 and 2016. 16
And, in spite of a recent increase in terrorist killings and the number of civil wars, the world is still much safer than it was at the height of the Cold War. 17 Last but not least, an ordinary person has greater access to information than ever before. All in all, we live on a safer, cleaner, and more prosperous planet than was the case in 1960.
How can one explain this unprecedented improvement in global well-being? Some of it must be attributed to technological and scientific progress. Also, specialization and trade played a vital role in improving the state of the world. Globalization ensured that an increase in the world’s population translated to an increase in the world’s productivity.
Of course, growth required the use of massive amounts of natural resources. How much of our natural wealth remains? Although we do not know the size of most reserves of natural resources, we can ascertain their scarcity or abundance by looking at prices. As this paper shows, after 56 years of human use and exploration, the vast majority of the commodities tracked by the World Bank are cheaper than they used to be — either absolutely or relative to income.
These findings would come as no surprise to the late Julian Simon (1932–1998), who years ago explained and predicted the happy confluence of growing population, increasing wealth, and falling commodity prices. In his 1981 book The Ultimate Resource, Simon noted that humans are intelligent animals who innovate their way out of scarcity through greater efficiency, increased supply, or development of substitutes. Human ingenuity, in other words, is “the ultimate resource” that makes other resources more plentiful. 18
An aluminum can, for example, weighed about 3 ounces in 1959. Today, it weighs less than half an ounce. 19 In other cases, we have replaced scarce resources with those that are more plentiful. Instead of killing whales for lamp oil, for instance, we burn coal, oil, and gas. In fact, humanity is yet to run out of a single nonrenewable resource.
Although past performance does not guarantee future results, constant predictions of doom and gloom should be put in perspective. Humanity has solved many challenges in the past, and there is no reason to believe that we will not be able to solve problems in the future. Put differently, there is no compelling evidence to support calls for mandatory curbs on human reproduction and consumption.
Methodology
To see what has been happening to world commodity prices, I looked at the World Bank’s Commodity Price Data, which include prices for 72 commodities (see Appendix). The data set needed some consolidation because some data sets started very late (e.g., 1996) or were repetitive (e.g., there were four different tea price data sets). As a consequence, I was left with 42 distinct data sets.
More specifically, I eliminated three crude oil data sets (Brent, Dubai, and WTI) because the data contained therein were already reflected in “Crude oil, average.” Because no measure of the price of coal goes back to 1960, I kept “Coal, Australian,” which goes back to 1970 and contains the most data. (Incidentally, “Crude oil, average” and “Coal, Australian,” have both appreciated more than was the case with prices in the eliminated data sets.)
In the case of natural gas, prices in the United States and Europe diverged significantly. 20 However, since I am trying to compare global prices and global income, I created an average price of natural gas consisting of both the American and European prices. To simplify matters further, I created a single average for the prices of coffee (combining Arabica and Robusta) and retained just one measure of the price of tea, which is, in any case, the average of the prices in Colombo, Kolkata, and Mombasa.
I also combined coconut oil and copra (from which coconut oil is derived). I eliminated groundnuts, for which price tracking did not start until 1980, with groundnut oil serving as a proximate measure of the price of groundnuts. I eliminated palm kernel oil because its price tracking doesn’t start until 1996, and I combined all soybean price measures into one. I eliminated all prices for rice except for the one measure that actually starts in 1960, “Rice, Thai 5 percent.”
Similarly, I retained the only measure of wheat (Wheat, U.S. HRW) that goes back to 1960. I eliminated “Banana, Europe” because it didn’t start until 1997. I eliminated sugar prices in the United States and Europe, retaining “Sugar, world” instead. I eliminated “Logs” and “Sawn wood” from Cameroon because both data sets start in 1970. “Rubber, TSR20” was eliminated because of its start in 1999. I also eliminated “DAP” (i.e., diammonium phosphate) because it started in 1967, and I combined the other four fertilizers (phosphate rock, triple superphosphate, urea, and potassium chloride) into one price measure called “Fertilizer.”
Findings
Between 1960 and 2016, world population increased by 145 percent and average income per capita adjusted for inflation increased by 183 percent. Out of the 42 distinct commodity prices measured by the World Bank, 19 have declined in absolute terms. In other words, adjusted for inflation, those commodities were cheaper in 2016 than in 1960. Twenty-three commodities have increased in price over the past 56 years. However, of those 23 commodities, only 3 (crude oil, gold, and silver) appreciated more than income. In a vast majority of cases, therefore, commodities became cheaper either absolutely or relatively (see Table 1 and Figure 1).
Table 1: Commodity Prices, 1960–2016 (2010 U.S. dollars)
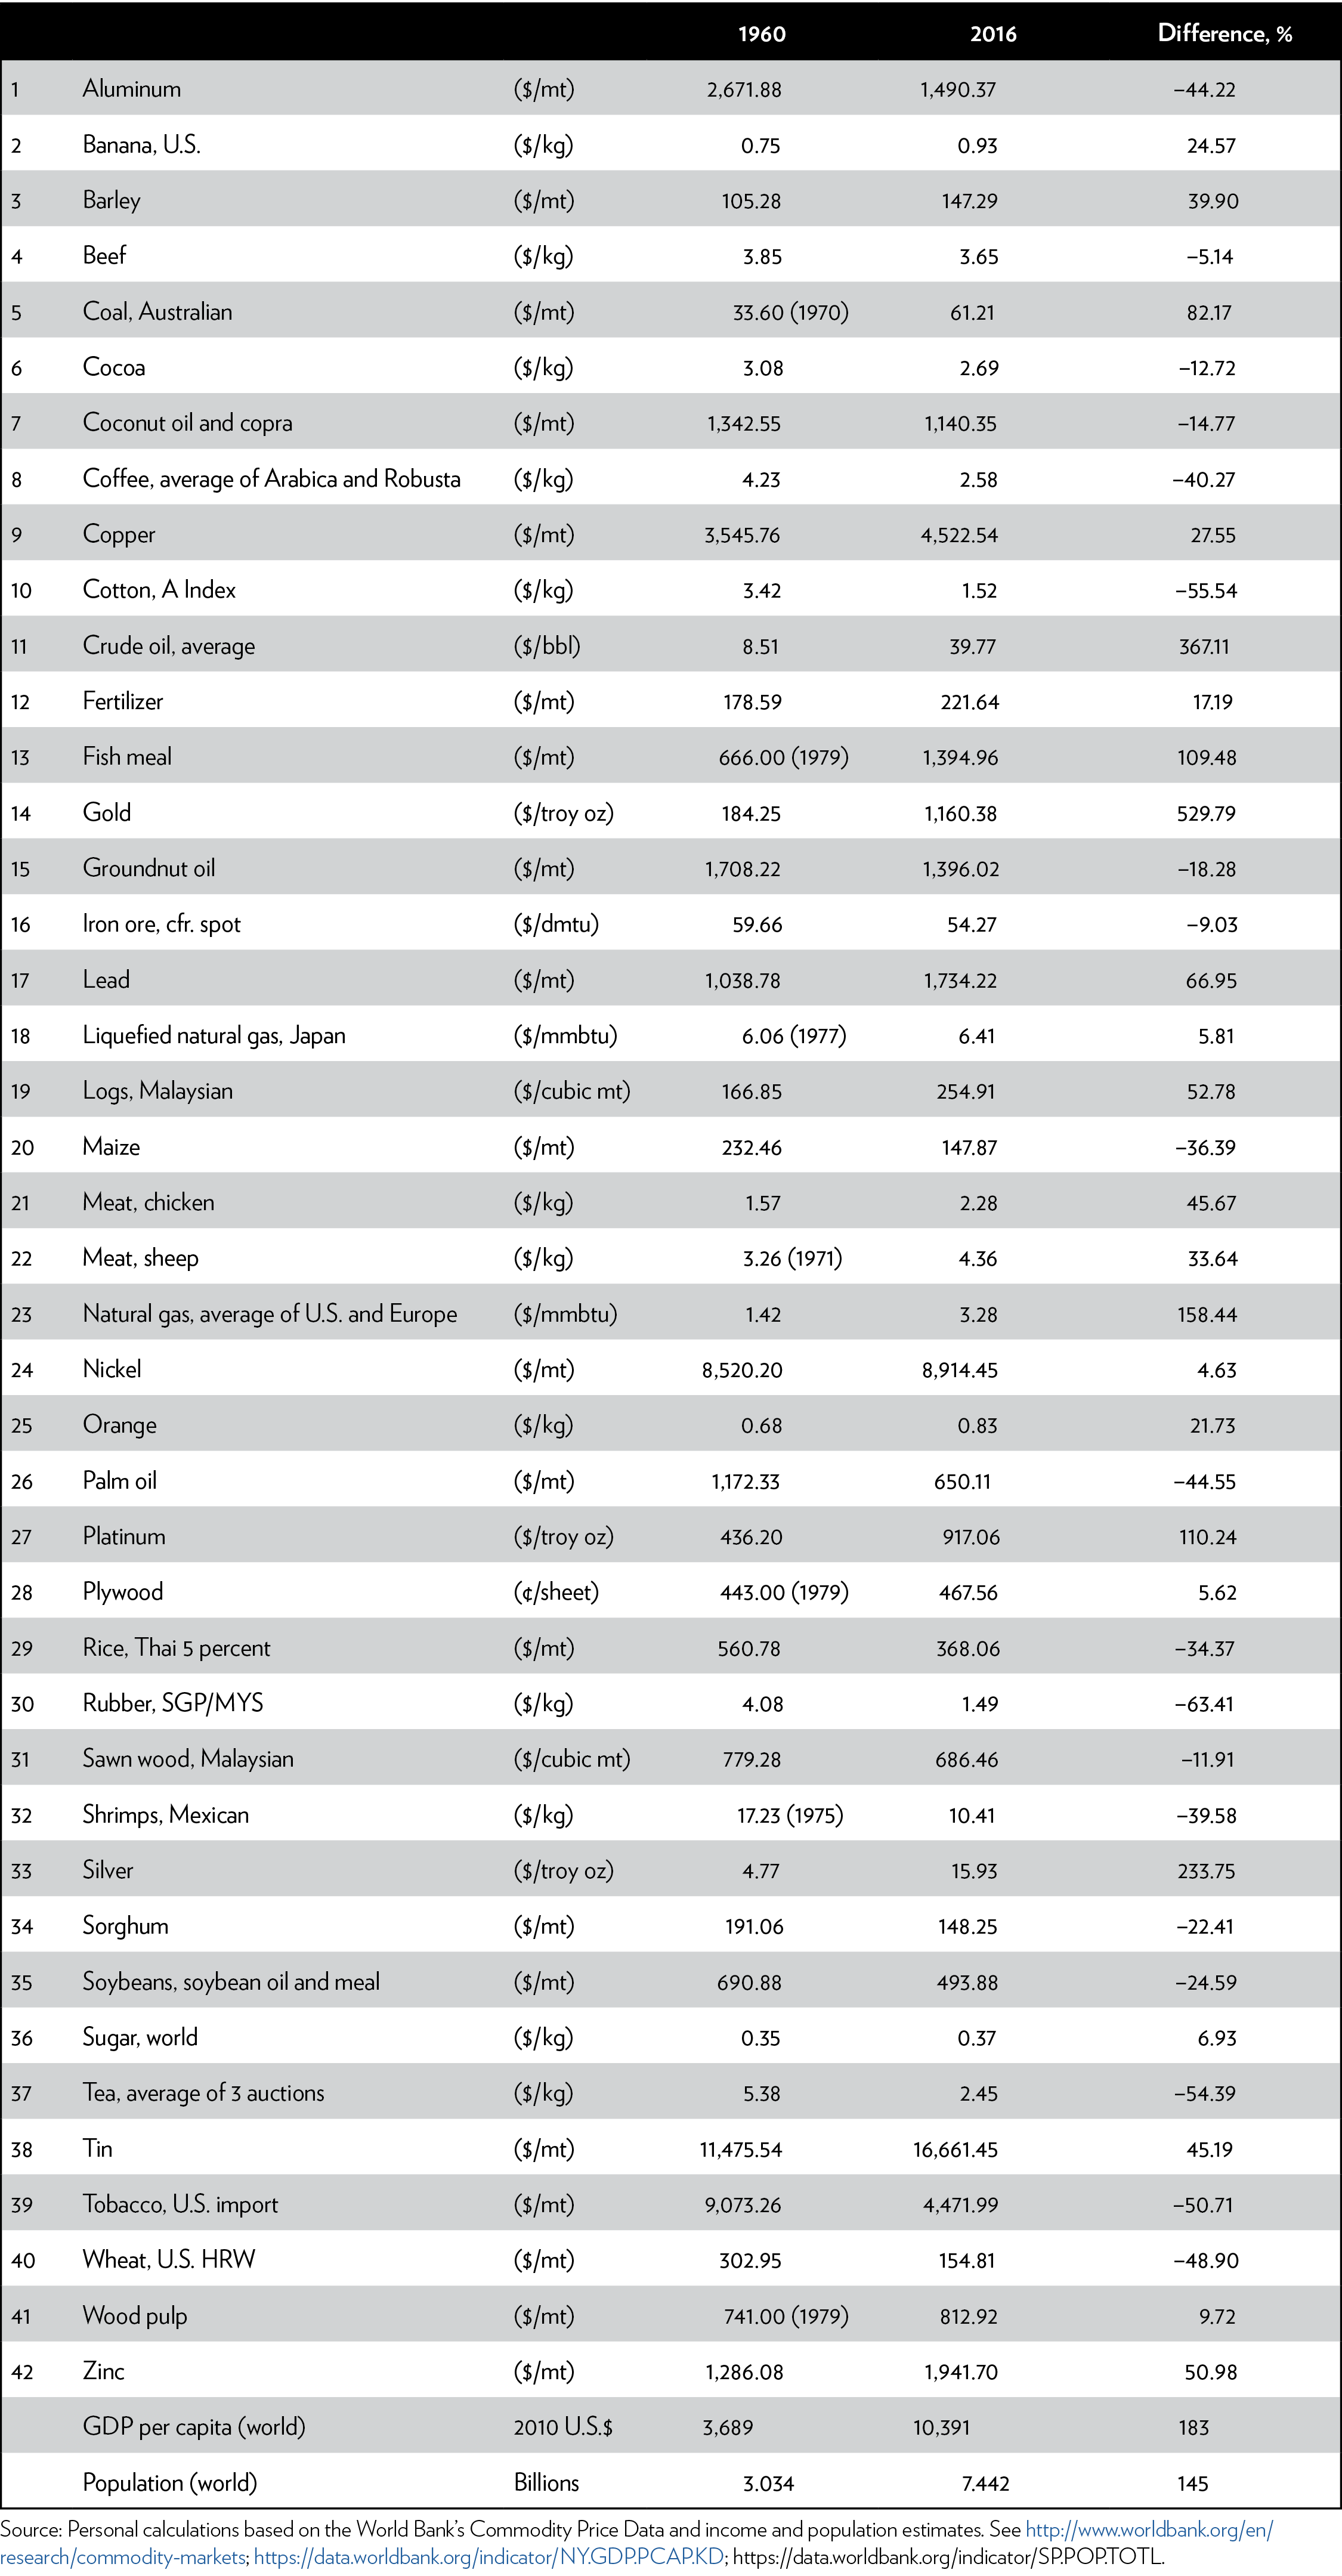
Note: bbl = barrel; cfr = cost and freight; dmtu = dry metric tonne unit; HRW = Hard Red Winter; kg = kilogram; mmbtu = million British thermal units; mt = metric ton; MYS = Malaysia; oz = ounce; SGP = Singapore; troy oz = troy ounce.
Figure 1: Commodity Prices, Population and Income, Percent Change, 1960–2016
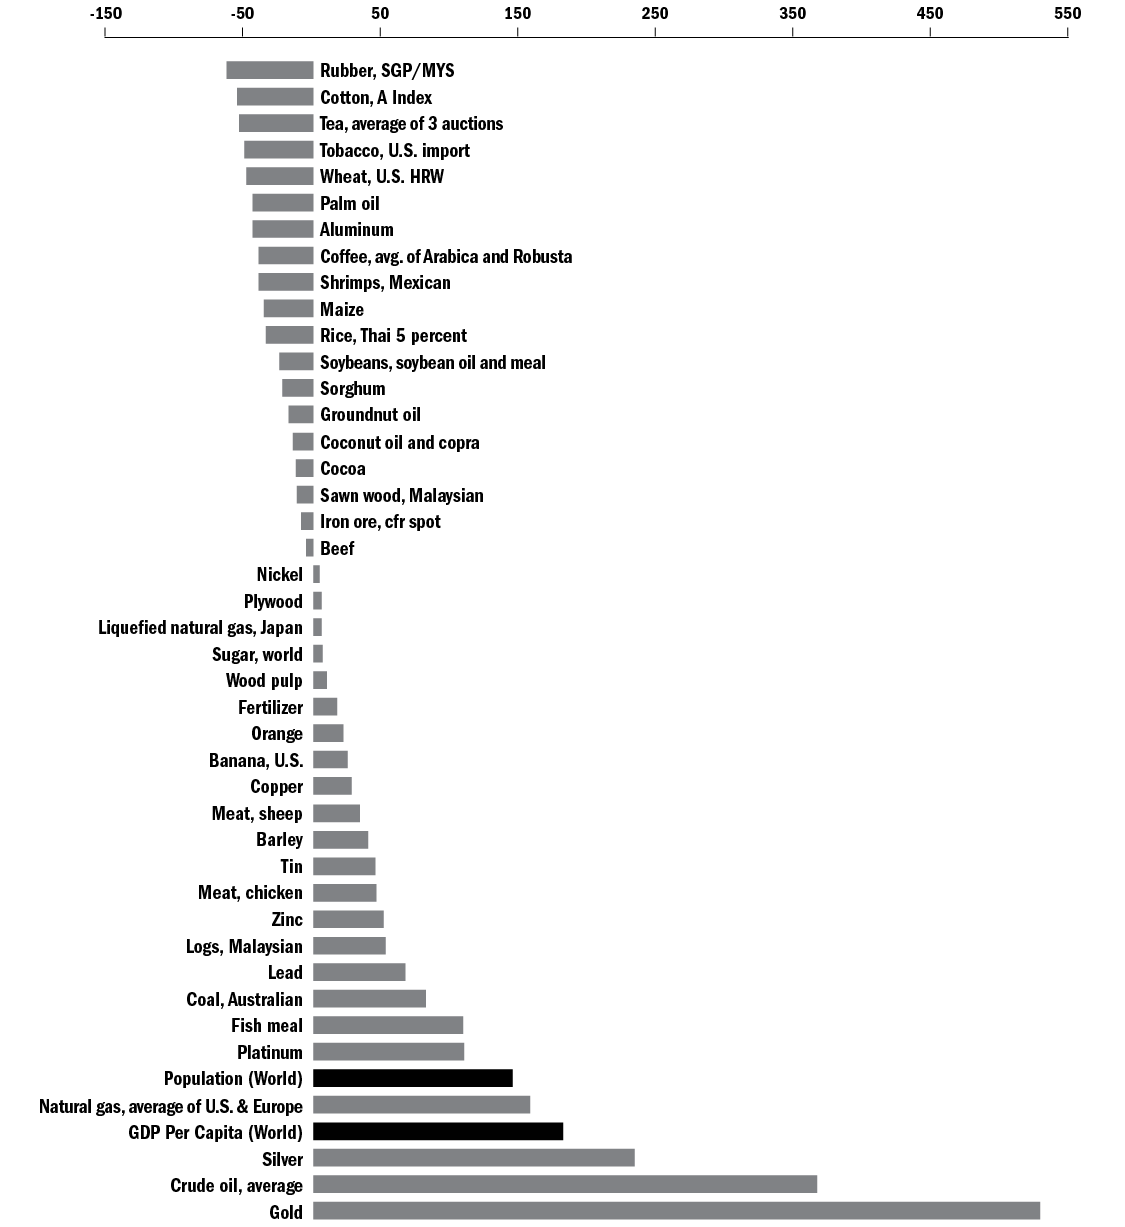
Source: Personal calculations based on the World Bank’s Commodity Price Data and income and population estimates. See http://www.worldbank.org/en/research/commodity-markets; http://data.worldbank.org/indicator/NY.GDP.PCAP.KD; https://data.worldbank.org/indicator/SP.POP.TOTL.
Note: cfr = cost and freight; HRW = Hard Red Winter; kg = kilogram; MYS = Malaysia; SGP = Singapore.
Simon’s Wisdom in Historical Perspective
It is often posited that population growth must inevitably result in the exhaustion of natural resources, environmental destruction, and even mass starvation. Take, for example, the report The Limits to Growth, which was published by the Club of Rome in 1972. 21 The report, which was based on Massachusetts Institute of Technology computer projections, looked at the interplay between industrial development, population growth, malnutrition, the availability of nonrenewable resources, and the quality of the environment. It concluded that “If present growth trends in world population, industrialization, pollution, food production, and resource depletion continue unchanged, the limits to growth on this planet will be reached sometime within the next one hundred years. . . . The most probable result will be a rather sudden and uncontrollable decline in both population and industrial capacity. . . . Given present resource consumption rates and the projected increase in these rates, the great majority of currently nonrenewable resources will be extremely expensive 100 years from now.” 22
That kind of alarmism is not ancient history. A recent article in the journal Nature Sustainability argued that
Humanity faces the challenge of how to achieve a high quality of life for over 7 billion people without destabilizing critical planetary processes. Using indicators designed to measure a “safe and just” development space, we quantify the resource use associated with meeting basic human needs, and compare this to downscaled planetary boundaries for over 150 nations. We find that no country meets basic needs for its citizens at a globally sustainable level of resource use. Physical needs such as nutrition, sanitation, access to electricity and the elimination of extreme poverty could likely be met for all people without transgressing planetary boundaries. However, the universal achievement of more qualitative goals (for example, high life satisfaction) would require a level of resource use that is 2–6 times the sustainable level, based on current relationships.… [O]ur findings suggest that the pursuit of universal human development … has the potential to undermine the Earth-system processes upon which development ultimately depends.… [I]f all people are to lead a good life within planetary boundaries, then the level of resource use associated with meeting basic needs must be dramatically reduced.23
The above arguments are strikingly similar to those made in The Limits to Growth report 46 years ago. Yet none of the dire predictions made by the authors of the latter publication have come to pass. On the contrary, we have seen an overall decline of commodity prices relative to income — in spite of a growing global population. Can this happy trend continue? To get a glimpse of the future, we must first understand the concept of scarcity.
Scarcity, or “the gap between limited — that is, scarce — resources and theoretically limitless wants,” is best ascertained by looking at prices. 24A scarce commodity goes up in price, whereas a plentiful commodity becomes cheaper. That was the premise of a famous bet between Stanford University professor Paul Ehrlich and University of Maryland professor Julian Simon. Ehrlich shared the gloomy predictions of the Club of Rome. In his best-selling 1968 book, The Population Bomb, Ehrlich reasoned that overpopulation would lead to exhaustion of natural resources and mega-famines. “The battle to feed all of humanity is over. In the 1970s hundreds of millions of people will starve to death in spite of any crash programs embarked upon now. At this late date nothing can prevent a substantial increase in the world death rate,” he wrote. 25
Simon, in contrast, was much more optimistic. In his 1981 book The Ultimate Resource, Simon used empirical data to show that humanity has always gotten around the problem of scarcity by increasing the supply of natural resources or developing substitutes for overused resources. Human ingenuity, he argued, was “the ultimate resource” that would make all other resources more plentiful. In 1980, the two thinkers agreed to put their ideas to a test.
As Ronald Bailey wrote in his 2015 book The End of Doom: Environmental Renewal in the 21st Century:
In October 1980, Ehrlich and Simon drew up a futures contract obligating Simon to sell Ehrlich the same quantities that could be purchased for $1,000 of five metals (copper, chromium, nickel, tin, and tungsten) ten years later at inflation-adjusted 1980 prices. If the combined prices rose above $1,000, Simon would pay the difference. If they fell below $1,000, Ehrlich would pay Simon the difference. Ehrlich mailed Simon a check for $576.07 in October 1990. There was no note in the letter. The price of the basket of metals chosen by Ehrlich and his cohorts had fallen by more than 50 percent. The cornucopian Simon won. 26
Simon’s critics, Ehrlich included, have since argued that Simon got lucky. Had his bet with Ehrlich taken place over a different decade, the outcome might have been different. Between 2001 and 2008, for example, the world had experienced an unprecedented economic expansion that dramatically increased the price of commodities. But Simon’s larger point concerning the long-term decline in the price of commodities still stands. According to Simon, when a particular resource becomes scarcer, its price increases, and that change incentivizes people to discover more of the resource, ration it, recycle it, or develop a substitute for it. As such, population growth and resource use do not automatically lead to higher commodity prices in the long run.
Let’s look at a concrete example. Research suggests that commodity prices move in so-called super-cycles that last between 30 and 40 years. 27During periods of high economic growth, demand for commodities increases. When that happens, commodities go up in price. It is during this period that high commodity prices encourage the discovery of new supplies and the invention of new technologies. Once new supplies come online, prices of “now copiously supplied commodities” fall. 28
Accordingly, the current commodity cycle seems to have peaked in 2008. In June 2008, for example, the spot price of West Texas Intermediate crude oil reached $154 per barrel (2016 U.S. dollars). By January 2016, it stood at $29. 29 However, the high price of oil has led to fracking (hydraulic fracturing), which has revolutionized the oil industry. In late 2017, with the global economy on the mend, the price of oil hovered around $60 per barrel. Fracking, which enables people to gain access to previously inaccessible oil reserves in record volumes, seems to be keeping a lid on massive price increases. The so-called shale band refers to “a price level at which most North American deposits . . . can be accessed with hydraulic fracturing technology [and] become profitable.” 30Currently, the shale band moves in a range of between $40 and $60. When the price of oil moves much below $40, U.S. oil rigs shut down. As it moves close to $60, U.S. oil rigs go back to work, thus lowering the price of oil. 31
In fact, humanity has yet to run out of a single nonrenewable resource. Unfortunately, many people still believe that the answer to scarcity is to limit consumption of natural resources. This group includes Paul Ehrlich and his wife, Anne, who revisited the Stanford University professor’s dire warnings in a 2013 Proceedings of the Royal Society article titled “Can a Collapse of Global Civilization Be Avoided?” Undeterred by a half-century of evidence to the contrary, they came to conclusions similar to those that Paul Ehrlich had originally proposed in the 1960s. 32The Club of Rome is still around and publishing. In 2017, it published a new report titled Come On! Capitalism, Short-termism, Population and the Destruction of the Planet, which insisted that “the Club of Rome’s warnings published in the book Limits to Growth are still valid” and warned that the “current worldwide trends are not sustainable.” 33
To these warnings about humanity’s future, a veritable smorgasbord of similar publications may be added. They include Naomi Klein’s 2015 book This Changes Everything: Capitalism vs. The Climate, in which the Canadian author argues that “our economy is at war with many forms of life on earth, including human life. What the climate needs in order to avoid collapse is a contraction in humanity’s use of resources,” and Rob Dietz and Dan O’Neill’s 2013 offering, Enough Is Enough: Building a Sustainable Economy in a World of Finite Resources. According to the American and Canadian economists, “We’re overusing the earth’s finite resources, and yet excessive consumption is failing to improve our lives.” 34
But consumption limits are unpopular and difficult to enforce. More often than not, their effects fall hardest on the most vulnerable. A switch from fossil fuels to “renewable” sources of energy, for example, has increased the price of gas and electricity in many European countries to such an extent that a new term, energy poverty, was coined. 35 According to the German magazine Der Spiegel, “Germany’s aggressive and reckless expansion of wind and solar power has come with a hefty price tag for consumers, and the costs often fall disproportionately on the poor.” 36In democracies, such policies are, in the long run, unsustainable. More important, they are unnecessary, because real solutions to future scarcity are more likely to come from innovation and technological change.
Oil, Gold, and Silver
As previously noted, three commodities are outliers and rose in price more than income. Between 1960 and 2016, gold rose by 530 percent, silver by 234 percent, and oil by 367 percent. Does that disprove Simon’s thesis? Far from it. For many decades, the oil market was partly shielded from competitive forces by the Organization of Petroleum Exporting Countries (OPEC), a cartel of oil-producing countries. The OPEC nations frequently colluded to restrict production of oil in order to keep its price artificially high. The extent to which OPEC was able to achieve its goal in the past is subject to much debate, but many experts have come to believe that OPEC’s ability to affect the future price of oil is in decline. 37 That’s partly because of fracking of previously inaccessible oil reserves in non-OPEC countries, such as the United States, and partly because of technological developments, such as the accelerating move away from combustion engine vehicles. 38 In expectation of permanently low oil prices, oil companies, such as Shell, and oil-producing countries, such as Saudi Arabia, are slowly diversifying to reduce their dependence on oil production. 39 Put differently, people with a stake in oil now assume that oil prices will follow Simon’s prediction in the future.
Gold and silver have more unusual characteristics. In addition to their commercial uses, such as serving as conductors of electricity in switches and cell phones, gold and silver are also “stores of value” or assets that can be saved, retrieved, and exchanged at a later time. Historically, people of all income groups used gold and silver to hide their wealth from rapacious government officials and in the time of war. More recently, both metals rose in price during the inflationary 1970s, when many of the world’s most important currencies, including the U.S. dollar, were rapidly losing their value because of monetary mismanagement. They spiked again after the outbreak of the Great Recession and the subsequent uncertainty about the soundness of the financial system.
Conclusion
The discussion in this paper is not meant to trivialize the challenges that humanity faces or imply that we will be able to solve all of the problems ahead. Instead, it is meant to show that the human brain, the ultimate resource, is capable of solving complex challenges. We have been doing so with disease, hunger, and extreme poverty, and we can do so with respect to the use of natural resources.
Thomas Babington Macaulay, a 19th-century British historian and politician, once asked, “On what principle is it that when we see nothing but improvement behind us, we are to expect nothing but deterioration before us?” 40In 1830, when Macaulay penned those words, the world was just beginning to industrialize. One hundred eighty-eight years later, humanity is not only still here, but it is flourishing like never before. Few people today would forgo the life expectancy, nutrition, health care, and education they now enjoy in exchange for those experienced by Macaulay’s contemporaries.
Appendix: The World Bank’s Commodity Price Data, 1960–2016 (2010 U.S. dollars)
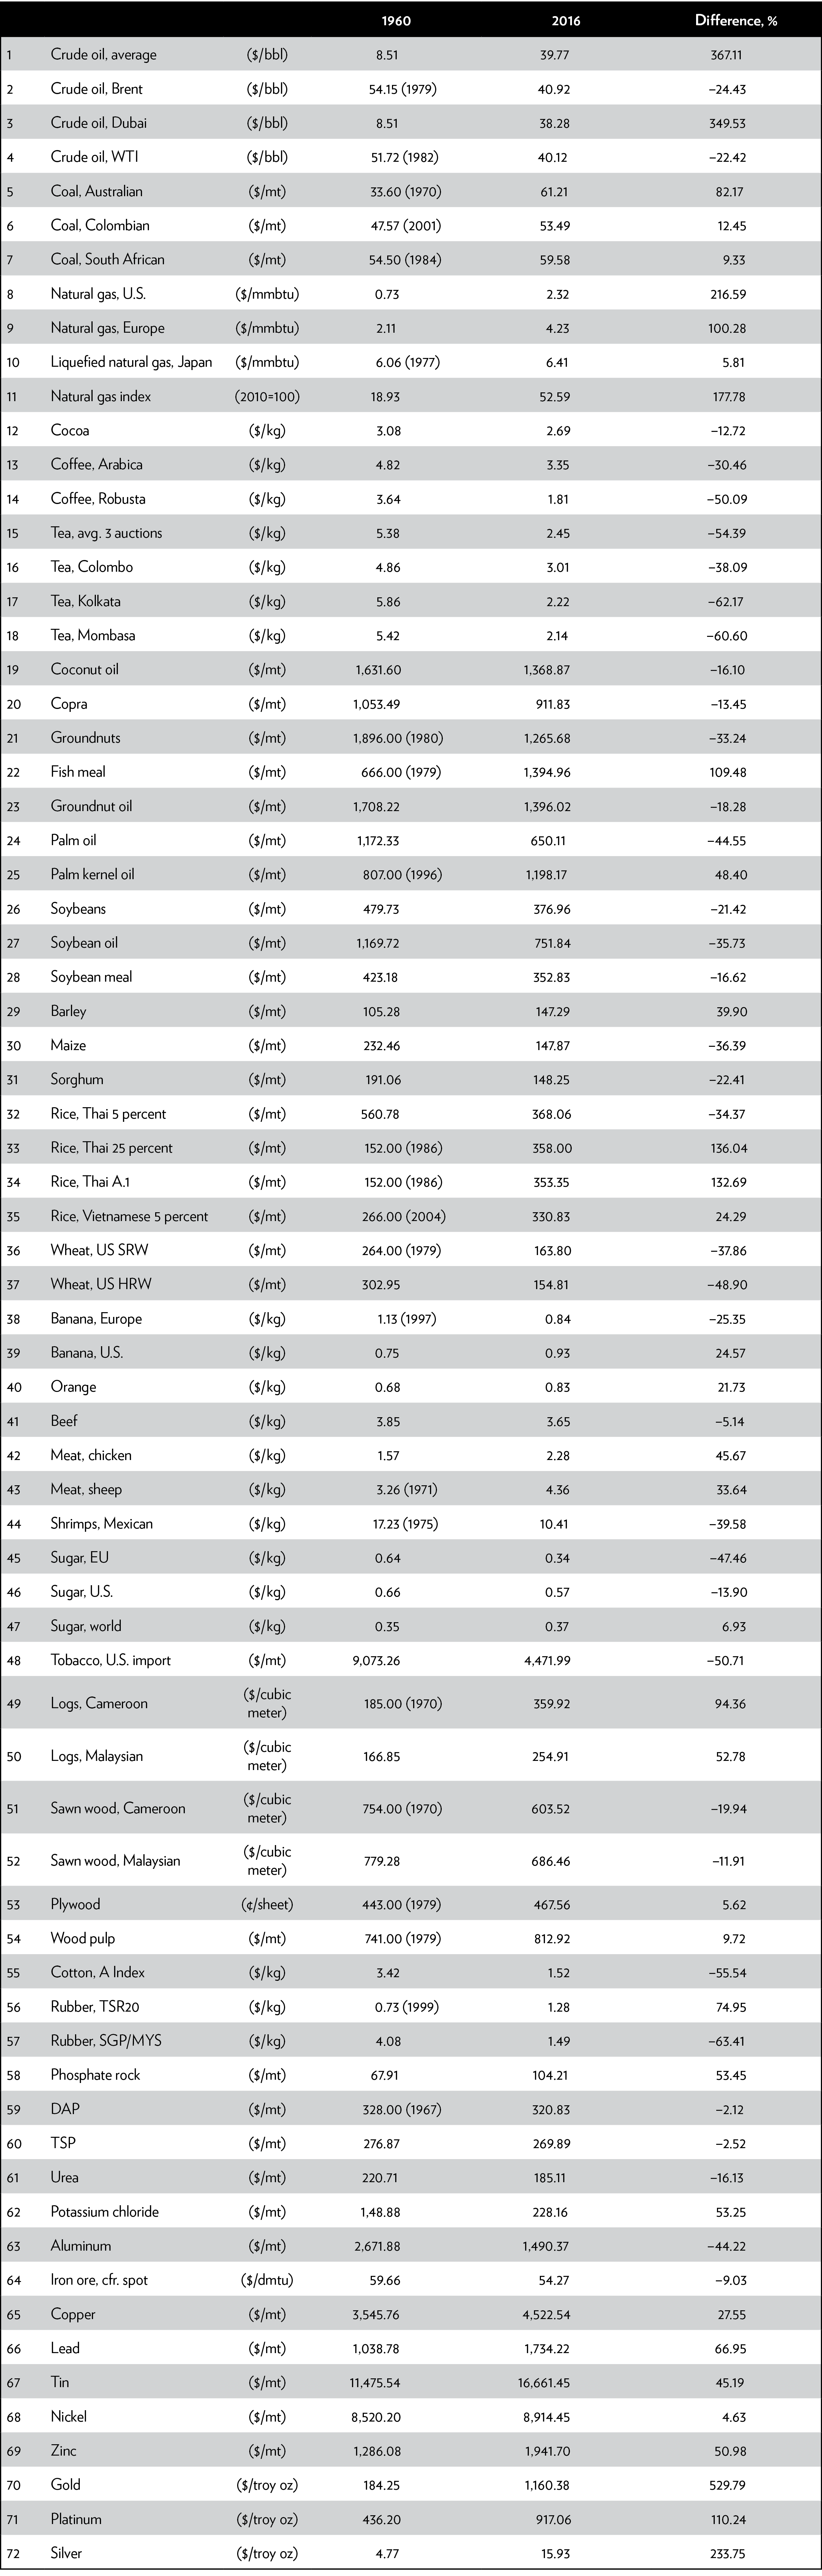
Source: World Bank, Commodity Price Data, http://www.worldbank.org/en/research/commodity-markets.
Note: bbl = barrel; cfr = cost and freight; DAP = diammonium phosphate; dmtu = dry metric tonne unit; EU = European Union; HRW = Hard Red Winter; kg = kilogram; mmbtu = million British thermal units; mt = metric ton; MYS = Malaysia; oz = ounce; SGP = Singapore; SRW = Soft Red Winter; TSP = triple superphosphate; TSR = technically specified rubber; WTI = West Texas Intermediate; troy oz = troy ounce.
Notes
- “Population, Total,” World Bank, https://data.worldbank.org/indicator/SP.POP.TOTL.
- “GDP Per Capita (constant 2010 US$),” World Bank, http://data.worldbank.org/indicator/NY.GDP.PCAP.KD.
- “Poverty Headcount Ratio at $1.90 a Day (2011 PPP) (% of population),” World Bank, https://data.worldbank.org/indicator/SI.POV.DDAY?end=2014&start=1981.
- “World Bank Forecasts Global Poverty to Fall Below 10% for First Time; Major Hurdles Remain in Goal to End Poverty by 2030,” World Bank, October 4, 2015, http://www.worldbank.org/en/news/press-release/2015/10/04/world-bank-forecasts-global-poverty-to-fall-below-10-for-first-time-major-hurdles-remain-in-goal-to-end-poverty-by-2030.
- “Mortality Rate, Infant (per 1,000 Live Births),” World Bank, http://data.worldbank.org/indicator/SP.DYN.IMRT.IN.
- “Mortality Rate, Under-5 (per 1,000 Live Births),” World Bank, http://data.worldbank.org/indicator/SH.DYN.MORT.
- “Number of Maternal Deaths,” World Bank, https://data.worldbank.org/indicator/SH.MMR.DTHS.
- The United States Department of Agriculture estimates the calorie needs of an adult at 2,000 calories per day, with some variation. See “Estimated Calorie Needs per Day by Age, Gender, and Physical Activity Level,” United States Department of Agriculture Center for Nutrition Policy and Promotion, https://www.cnpp.usda.gov/sites/default/files/usda_food_patterns/EstimatedCalorieNeedsPerDayTable.pdf.
- “Food Supply — Crops Primary Equivalent,” Food and Agriculture Organization of the United Nations, Statistics Division, http://www.fao.org/faostat/en/#search/Food%20supply%20kcal%2Fcapita%2Fday.
- “Life Expectancy at Birth, Total (Years),” World Bank, http://data.worldbank.org/indicator/SP.DYN.LE00.IN.
- “Total Economy Database,” Conference Board, https://www.conference-board.org/data/economydatabase/.
- My calculation was based on the following countries, which were the only ones for which data were available: Argentina, Australia, Austria, Belgium, Brazil, Canada, Chile, Colombia, Denmark, Finland, France, Germany, Greece, Hong Kong, Ireland, Italy, Japan, Mexico, Netherlands, Norway, Peru, Portugal, Singapore, South Korea, Spain, Sweden, Switzerland, Taiwan, the United Kingdom, the United States, and Venezuela.
- “Primary completion rate, total (% of relevant age group),” World Bank, https://data.worldbank.org/indicator/SE.PRM.CMPT.ZS.
- “Lower secondary completion rate, total (% of relevant age group),” World Bank, https://data.worldbank.org/indicator/SE.SEC.CMPT.LO.ZS.
- “Gross enrolment ratio, tertiary, both sexes (%),” World Bank, https://data.worldbank.org/indicator/SE.TER.ENRR.
- “Air Quality — National Summary,” U.S. Environmental Protection Agency, https://www.epa.gov/air-trends/air-quality-national-summary.
- Joshua S. Goldstein and Steven Pinker, “The Decline of War and Violence,” Boston Globe, April 15, 2016, https://www.bostonglobe.com/opinion/2016/04/15/the-decline-war-and-violence/lxhtEplvppt0Bz9kPphzkL/story.html.
- Julian Simon, The Ultimate Resource (Princeton, NJ: Princeton University Press, 1981).
- “Aluminum Cans,” The Aluminum Association, http://www.aluminum.org/product-markets/aluminum-cans.
- Until recently, there was no trade in natural gas between Europe and the United States, but that has changed and the prices of natural gas in the two are converging.
- See “About Us,” Club of Rome, https://www.clubofrome.org/.
- Donella H. Meadows, Dennis L. Meadows, Jørgen Randers, and William W. Behrens III, The Limits to Growth: A Report for The Club of Rome’s Project on the Predicament of Mankind (Washington: Potomac Associates, 1972) via “Donella Meadows Collection,” Dartmouth Digital Collections, http://collections.dartmouth.edu/teitexts/meadows/diplomatic/meadows_ltg-diplomatic.html.
- Daniel W. O’Neill, Andrew L. Fanning, William F. Lamb, and Julia K. Steinberger, “A Good Life for All within Planetary Boundaries,” Nature Sustainability 1 (February 5, 2018): 88–95, https://www.nature.com/articles/s41893-018-0021-4.
- “Scarcity,” Business Dictionary, http://www.businessdictionary.com/definition/scarcity.html.
- Paul Ehrlich, The Population Bomb (New York: Ballantine Books, 1968), p. 11.
- Ronald Bailey, The End of Doom (New York: St. Martin’s Press, 2015), p. 45.
- David Jacks, “From Boom to Bust: A Typology of Real Commodity Prices in the Long Run,” National Bureau of Economic Research Working Paper no. 18874, March 2013, p. 2, http://www.nber.org/papers/w18874.
- Bailey, The End of Doom, p. 37.
- “Crude Oil Prices — 70 Year Historical Chart,” MacroTrends, http://www.macrotrends.net/1369/crude-oil-price-history-chart.
- “Shale Band,” Investopedia, https://www.investopedia.com/terms/s/shale-band.asp#ixzz4x6PNJzki.
- “Can Oil Prices Go Above $60? U.S. Shale Output a Pivotal Factor,” USA Today, October 29, 2017, https://www.usatoday.com/story/money/energy/2017/10/29/can-oil-prices-go-above-60-u-s-shale-output-pivotal-factor/804149001/.
- Paul R. Ehrlich and Anne H. Ehrlich, “Can a Collapse of Global Civilization Be Avoided?,” Proceedings of the Royal Society, January 9, 2013, http://rspb.royalsocietypublishing.org/content/280/1754/20122845.
- Ernst von Weizsaecker and Anders Wijkman, Come On! Capitalism, Short-termism, Population and the Destruction of the Planet (Zurich, Switzerland: Club of Rome, 2017).
- Rob Dietz and Dan O’Neill, foreword to Enough Is Enough: Building a Sustainable Economy in a World of Finite Resources (Oakland, California: Berrett-Koehler Publishers, 2013); and Naomi Klein, This Changes Everything: Capitalism vs. The Climate (New York: Simon & Schuster, 2015), p. 21.
- “How Electricity Became a Luxury Good,” Spiegel Online, September 4, 2013, http://www.spiegel.de/international/germany/high-costs-and-errors-of-german-transition-to-renewable-energy-a-920288.html.
- Ibid.
- See “World Oil: Market or Mayhem?,” James L. Smith, Journal of Economic Perspectives 23, no. 3 (Summer 2009): 145–64; and Matt Egan, “OPEC and Russia Have Failed to Fix the Epic Oil Glut,” CNN, May 26, 2017, http://money.cnn.com/2017/05/26/investing/opec-russia-fail-oil-glut/index.html.
- “Why Saudi Arabia Should Fear U.S. Oil Dominance,” USA Today, November 18, 2017, https://www.usatoday.com/story/money/energy/2017/11/18/analysis-why-saudi-arabia-should-fear-u-s-oil-dominance/868990001/; and “Global Electric Car Sales Jump 63 Percent,” Bloomberg, November 21, 2017, https://www.bloomberg.com/news/articles/2017-11-21/global-electric-car-sales-jump-63-percent-as-china-demand-surges.
- “Shell Prepares for ‘Lower Forever’ Oil Prices,” Wall Street Journal, July 27, 2017, https://www.wsj.com/articles/royal-dutch-shells-second-quarter-earnings-rise-sharply-1501137915; and “Saudis Boxed In by Low Oil Prices,” Wall Street Journal, June 22, 2017, https://www.wsj.com/articles/saudis-boxed-in-by-low-oil-prices-1498141357.
- “Thomas Babington Macaulay Quotes,” Goodreads, https://www.goodreads.com/author/quotes/234077.Thomas_Babington_Macaulay.

About the Author


This work is licensed under a Creative Commons Attribution-NonCommercial-ShareAlike 4.0 International License.