Shortly after the current Great Recession started, I wrote a Globe Asia column, “A Great Depression?” (December 2008). In it, I stressed the findings contained in Robert Higgs’ important book Depression, War and Cold War: Studies in Political Economy (Oxford University Press, 2006). Higgs concluded that, because of regime uncertainty, investors were afraid to commit funds to new projects. They simply didn’t know what President Roosevelt and the New Dealers would do next.
I warned, back in December 2008, that regime uncertainty might pose a problem in the current crisis. As I saw it, the political classes were intent on blaming the markets. They certainly were not going to point their accusatory fingers at themselves, and neither were the world's central bankers.
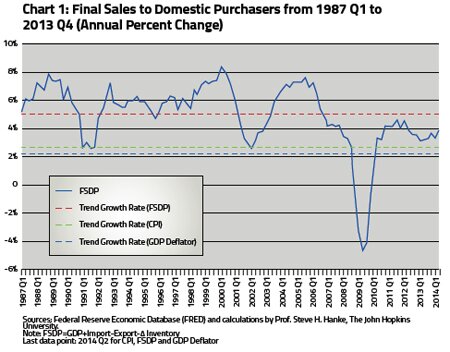
Well, regime uncertainty still prevails and the U.S. economy, which is now being touted as one of the strongest, isn't so strong. The accompanying chart of nominal final sales to domestic purchasers (FSDP), which is the best proxy for aggregate demand, shows that FSDP is still rather anemic. Its current year-over year growth rate is only 3.9%, well below the long-run trend of 5%. So, the U.S. remains mired in a growth recession. Thanks to continued regime uncertainty and weak monetary growth — broad money (Divisia M4) is only growing at a 2.5% annual rate — the economy fails to lift off.
To better understand what's happened since 2008 and where we are going, nothing beats the ability to interpret and understand economic data in terms of patterns, relationships, connections, and structures that are likely to prevail in the future. Accurate topological patterns — in short, good diagrams — hold the keys to developing useful images of the future.
To that end, a series of diagrams that depict the U.S. economy are presented. The diagrams show the relationship between the unemployment rate and the gap between profit and interest.
This important, but neglected, relationship was first analyzed by my former professor, Kenneth Boulding (1910-1993). Here's how Boulding summarized the economics of the profit-interest gap in his last book, The Structure of the Modern Economy (New York University Press, 1993):
“When hiring somebody an employer sacrifices the interest that could have been made on the money going to wages in the hope of making a profit on the product of the work. The work may consist of alleviating depreciation and decay, such as that carried out by janitors. It may involve transforming one substance into another that has a higher value, such as raw iron into automobiles, or wheat into flour. It may involve selling things, disposing of business inventory for more money than otherwise would have been obtained. All these involve operations in which the increase in the ‘gross worth’ of the business is expected to be greater than wages and other costs, which represent a subtraction from the gross worth, so that the net Steve H. Hanke Professor of Applied Economics at the Johns Hopkins University in Baltimore. Twitter: @Steve_Hanke worth increases, the increase being profits.”
Boulding reasoned that businesses would tend to hire workers when there was an increasing gap between expected profit and interest. With an increasing gap, the profit rate associated with a new hire would be increasing, relative to the cost of interest. Alternatively, if the profitinterest gap is decreasing (or negative, as it was during the Great Depression) a business would have an incentive to reduce its labor force because the cost of interest is rising, relative to the rate of profit.
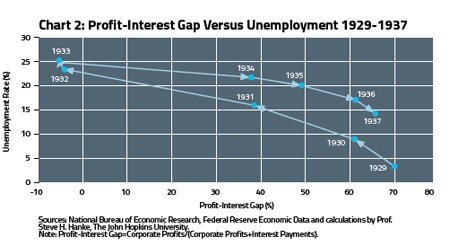
The following scatter diagrams are what Boulding called "time scatters." Each point in a time scatter represents the magnitude of two variables and is connected by arrows showing the time sequence in which the points occur.
The first time scatter is from 1929- 1937. The profit-interest gap is the ratio of profit as a portion of national income to profit plus interest as a portion of national income. This PIG ratio is shown in percentage terms on the horizontal axis.
The unemployment rate is displayed on the vertical axis. With the onset of the Great Depression, the PIG ratio collapsed, becoming negative in 1932. A dramatic surge in unemployment was associated with the collapsing PIG ratio. In 1933, the PIG ratio began to improve and so did the employment picture.
The general pattern is very clear and consistent with economic theory: changes in the PIG ratio and the unemployment rate are negatively correlated.
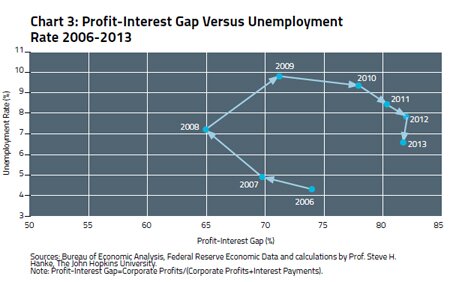
When we move from the Great Depression to the current Great Recession (See: 2006-2013 Chart), the scatter diagram takes the same general clockwise course as it did from 1929- 1937.
The scatter diagram shows just how narrow the Fed's room for maneuver is. If the Fed increases interest rates too aggressively, the profit-interest gap will fall, and the unemployment rate will rise; the scatter diagram will move in a clockwise loop.
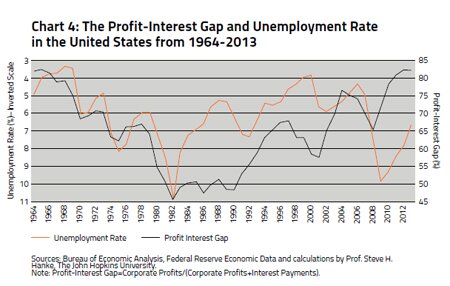
The next chart plots the profit interest gap and unemployment over time. These two metrics typically move in opposite directions. But they failed to do so in the current crisis. Why? Here's where regime uncertainty comes into the picture. In a fascinating new book From Crisis to Confidence: Macroeconomics After the Crash (Institute for Economic Affairs, 2014), Roger Koppl concludes, "Recent regulatory developments such as the Dodd-Frank Act violate the principle of the rule of law and therefore undermine confidence and increase policy uncertainty." More importantly, Koppl presents measurements of regime uncertainty in the current crisis and their negative effects on confidence and economic activity.
As long as progressive economic policies are pursued with vigor, we can anticipate more regime uncertainty, subdued confidence, low rates of bank money and credit growth, and weak economic growth. Not exactly the rosy picture that so many are attempting to paint.


