When it comes to the measurement of inflation, I agree with Lord Kelvin. In a May 3, 1883 lecture at the Institute of Civil Engineers, the British physicist remarked:
I often say that when you can measure what you are speaking about, and express it in numbers, you know something about it; but when you cannot measure it, when you cannot express it in numbers, your knowledge is of a meager and unsatisfactory kind; it may be the beginning of knowledge, but you have scarcely, in your thoughts, advanced to the stage of science, whatever the matter may be.
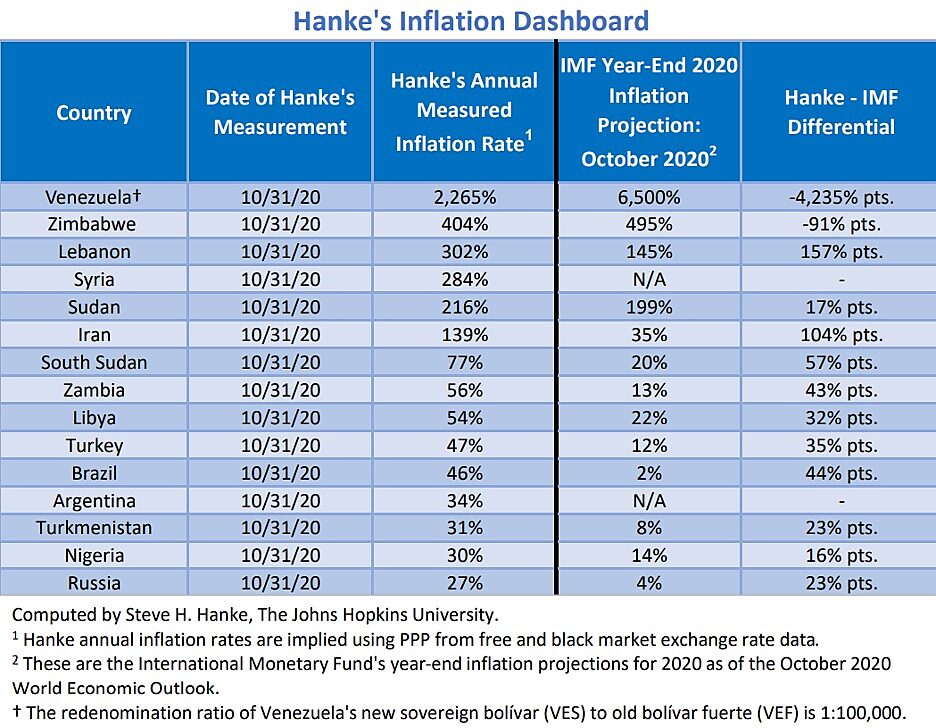
At present, the world’s highest inflation rate is Venezuela’s, where the annual inflation rate at the end of October, by my measure, was 2,265 percent per year. Lebanon, the only country besides Venezuela currently experiencing hyperinflation, had an annual inflation rate of 302 percent per year at the end of October. So, Venezuela and Lebanon are members of the rogues’ gallery of hyperinflation episodes, of which there have only been 62 in recorded history.
My inflation measurements are made by The Johns Hopkins-Cato Institute Troubled Currencies Project (TCP), which I direct. We employ high-frequency data that allow for the daily measurements of both monthly and annual inflation rates. We measure. We do not forecast. Indeed, forecasting in a hyperinflationary or elevated inflation setting is a mug’s game.
How do we measure? The most important price in an economy is the exchange rate between the local currency and the world’s reserve currency, the U.S. dollar. As long as there is an active black market (read: free market) for currency and the data are available, changes in the black-market exchange rates can be reliably transformed into accurate measurements of countrywide inflation rates. The economic principle of purchasing power parity (PPP) allows for this transformation. Fortunately, the application of PPP to measure elevated inflation rates is rather straightforward.
During periods of elevated inflation, PPP is the proper theory to use for measurement. Indeed, PPP holds during episodes of hyperinflation, and it holds very tightly. So, with Nobel Prize-winner Tjalling Koopmans’s admonishment to economists from his classic 1947 article “Measurement Without Theory” in mind, we are measuring, and we are measuring with the correct theory.
Beyond the theory of PPP, the intuition of why PPP represents the “gold standard” for measuring inflation during episodes of elevated inflation is clear. All items in an economy that is experiencing “high” inflation are either priced in a stable foreign currency (the U.S. dollar) or a local currency. If they are in local prices, they are determined by referring to the dollar prices of goods, and then converting them to local prices after checking with the spot black-market exchange rate. When the price level is increasing rapidly and erratically on a day-by-day, hour-by-hour, or even minute-by-minute basis, exchange rate quotations are the only source of information on how fast inflation is actually proceeding. That is why PPP holds and why we can use high-frequency (daily) data to calculate elevated rates of inflation.
So much for the way things should be measured. With that in mind, let’s take a look at the International Monetary Fund’s (IMF) treatment of inflation forecasts. Unlike my inflation measurements, the IMF’s forecasts are not measurements. It is of the utmost importance to grasp the distinction between measurements and forecasts. For one thing, the IMF is the premier international body that deals with the monetary matters of its 189 member countries, and, for another, because whatever the IMF utters is treated by the financial press as gospel. In consequence, IMF data are widely reported and drive public opinion as well as markets.
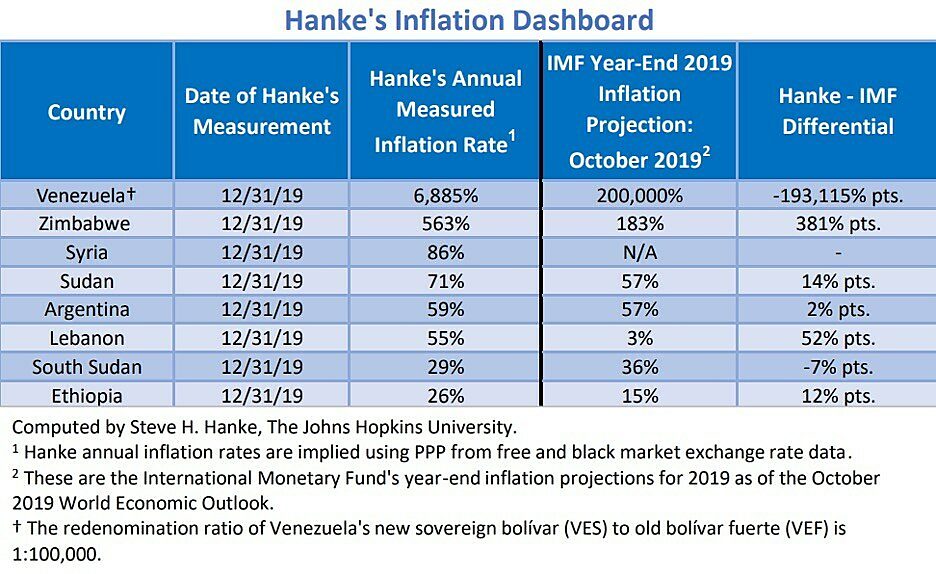
The table below contains my accurately measured inflation rates for end of year 2019 versus the IMF’s October 2019 World Economic Outlook (WEO) forecasts of inflation for those countries that appeared on Hanke’s Inflation Dashboard on December 31, 2019. No one has ever been able to accurately forecast the course or the duration of an episode of “high” inflation. But, that hasn’t stopped the IMF from offering up inflation forecasts that have proven to be inaccurate. Just take a look at the following table. As shown below, just a few short months before 2019 year’s end, the IMF’s inflation forecasts for countries on my dashboard ranged from being off to wildly off:

Now, let’s consider the IMF’s year-end forecasts for 2020 from its October 2020 WEO. As seen in the table below, the IMF’s annual inflation forecasts for the end of this year for those countries appearing on the October Hanke’s Inflation Dashboard are wildly different from my current measurements. Only three months before year’s end, the IMF has again put its finger in the wind and made forecasts that, given my current inflation measurements, do not seem plausible:

What makes the IMF’s inflation forecasts so troubling is that they should have never been reported in the first place. There is no practical basis for making a forecast of inflation during episodes of elevated inflation or hyperinflation. But that hasn’t stopped the IMF. One can measure elevated inflation rates accurately, but one cannot forecast their course or duration. And, if the IMF’s original sin is not bad enough, the financial press regularly and unquestionably publishes the IMF’s forecasts, leaving the public with the false impression that it is possible to accurately forecast episodes of elevated inflation and hyperinflation.
