The devastating effects of the COVID-19 pandemic and associated lockdowns on various forms of transportation create an opportunity to review the successes and failures of federal transport policies before Congress reauthorizes federal highway and transit programs. After a one-year extension approved by Congress in September 2020, authorization for these programs will expire on September 30, 2021.
A close look at federal transportation programs reveals that user-fee-funded systems work far better than projects funded by subsidies or deficit spending. User-fee-funded infrastructure tends to be much better maintained than infrastructure funded by subsidies. Subsidies, meanwhile, take away the incentive for transportation managers to innovate or improve productivity. Worker productivity in urban transit, for example, has declined by more than 55 percent since Congress began funding transit in the 1960s.
The Interstate Highway System is the most successful megaproject in history, partly because it was built on a pay-as-you-go basis, being funded out of highway user fees only as those revenues were collected. This ensured that the roads were not built before they were needed (the way federally subsidized transcontinental railroads were) and so immediately produced enormous benefits as they were opened.
Another important lesson is that efforts to save energy, reduce pollution, and improve highway safety by getting people to drive less have failed miserably. Instead, we saved energy, reduced pollution, and improved safety by building more energy efficient, cleaner, and safer automobiles and safer roads. Efforts to reduce greenhouse gas emissions should similarly focus on building cleaner cars, not trying to reduce driving.
The COVID-19 pandemic highlights the need for a resilient transportation system, and motor vehicles and roads have proven far more resilient than any form of mass transportation. Unlike mass transportation, which requires continuing inputs of labor and funds, roads are available when they are needed even if a recession or other economic shock reduces revenues to highway agencies. Roads have also proven to be the best way to evacuate people and deliver rescue and recovery services in the event of natural disasters. “Road diets” and other programs that reduce roadway capacities are reducing the resiliency of our transportation system.
After elaborating on the data and arguments above, this paper concludes with specific recommendations for the 2021 surface transportation reauthorization.
Introduction
The COVID-19 pandemic has brought into sharp focus some of the weaknesses and drawbacks of past transportation policies and programs. The temporary cessation of activity in many transportation sectors creates an opportunity to review these programs from the ground up. This can be called zero-based transportation policy.
Zero-based budgeting requires that all expenses be justified and approved for each new budgeting period rather than simply be a continuation of the previous period’s budget. In the same way, zero-based transportation policy requires that all transportation programs be justified and approved rather than simply continue as before.
A major drawback with zero-based budgeting is the extra effort required to review and justify existing expenses, and zero-based transportation policymaking would have the same drawback. While this effort may not be worthwhile every year, or even every six years (when federal surface transportation programs are reauthorized), the current pandemic has produced enough changes to make a close look at federal transportation policies worthwhile. It therefore presents a unique opportunity that we may not encounter again.
Historian Stephen Davies has observed that a major pandemic does not “introduce something novel.” Instead, “it accelerates and magnifies trends and processes that were already under way.” It can also bring “a final stop to processes that were already exhausted.“1 By revealing such trends and processes, this pandemic can illuminate the successes and failures of existing policies.
This paper begins with a look at the history of federal transportation policies and continues with an evaluation of how they relate to each of the main forms of transportation in the United States. It then tallies the government subsidies that each mode has received, alongside the user fees each one takes in, and draws lessons from the current pandemic as well as the past two centuries of U.S. transportation policy in order to delineate nine specific recommendations for policymakers to consider before the present transportation policies expire in September 2021.
The History of Federal Transportation Policy
Federal transportation policy can broadly be divided into two periods: before and after 1970. Before 1970, federal transportation policy was demand-driven, meaning it was focused on accelerating the expansion of popular new technologies into remote parts of the nation. For example,
- In 1806, Congress appropriated funds for two major roads: the National Road, which connected Maryland with Illinois, and the Federal Road, which connected Georgia with Alabama, thus connecting the East Coast with what was then the western United States.2
- In 1850, Congress offered a land grant for the construction of a railroad between Illinois and the Gulf Coast, and later land grants were given to four transcontinental railroads, connecting the East Coast with the Pacific Coast.
- Between 1954 and 1970, Congress spent about $7 billion (in 2020 dollars) funding the construction of new airports in various parts of the country.3
- In 1956, Congress approved the construction of the Interstate Highway System, which reached every state and major urban area, and dedicated the federal gas tax and other federal excise taxes on highway users to the construction of that system.
All of these programs have been justifiably criticized for various reasons: the toll-free National and Federal Roads were poorly maintained compared with private toll roads;4 the land-grant railroads were built before there was a market for their services and many went bankrupt;5 federally funded airports and other airline subsidies created an unfair competition against rail passenger services, which, at the time, were unsubsidized;6 and the Interstate Highway System cost more and took longer to build than originally projected.7
However, these programs were successful in the sense that each was heavily used. The National and Federal Roads were important travel ways until railroads replaced them. The transcontinental railroads proved vital to the exchange of capital, goods, and information in the 20th century. Air travel now provides the second-most passenger miles of any form of mobility in the United States.
Most successful of all were the interstate highways, and that success can be traced largely to the way that Congress handled funding for those roads. Led by senator Albert Gore Sr. (D‑TN), members of Congress insisted that the highways be built on a pay-as-you-go basis, with no borrowing in anticipation of future revenues that might not be realized. Due to a combination of inflation and the fact that fuel taxes do not automatically adjust for inflation, the system took longer to build than expected. Yet it is perhaps the most successful megaproject in world history, as it caused a huge increase in economic activity.8
After 1970, the character of federal transportation policy morphed into one that was supply-driven, meaning that it increasingly focused on providing the kinds of transportation that decisionmakers thought was “right,” rather than the kinds that people actually used. During the 1960s, automobiles had been demonized as gas-guzzling, polluting death machines, responsible for killing well over 50,000 people a year.9 That led to a search for cleaner and safer alternatives to the automobile.
In the 1980s and 1990s, transit agencies began using federal transportation dollars to build rail transit lines that had previously been considered obsolete. Reappropriating a famous line from the 1989 movie Field of Dreams, advocates of supply-driven policy strategy began using the phrase “build it and they will come.”10 They expected that, if cities built rail transit systems similar to those that existed in the early 20th century, people would start using those systems instead of driving.
Intercity passenger train advocates also considered Amtrak to be a “build it and they will come” proposition. Between World War II and 1970, intercity passenger train ridership fell by almost 90 percent.11 The railroads blamed competition from airlines and automobiles, but passenger train advocates believed that the railroads had decided to jettison passenger trains because freight trains were more profitable.12 Anthony Haswell, the founder of the National Association of Railroad Passengers (sometimes called the “father of Amtrak”), testified before Congress in 1969 that he believed if the government took over the trains they would be profitable, and he objected to operating subsidies, saying that they would take away the “incentive to reduce expenses or increase revenues.”13
When the Environmental Protection Agency was created in 1970 with a mandate to reduce air pollution, it developed a two-pronged strategy for doing so. First, it required automakers to abide by increasingly stringent limits on pollution coming from automobile tailpipes. Second, it encouraged states and cities to adopt policies favoring mass transit and other alternatives to the automobile in an effort to get people to drive less.14
One of these approaches turned out to be incredibly successful, while the other has been a miserable failure. The total number of miles driven in the United States nearly tripled between 1970 and 2019, showing that efforts to reduce driving have been ineffective.15 Yet, despite this, the total amount of air pollution coming from motor vehicles has declined by more than 88 percent.16 That means the average car today produces less than 4 percent of the pollution as the average car did in 1970; new cars sold in 2019 produced only about 1 percent of the pollution as 1970 vehicles.
Reductions in emissions are not the only way in which automobiles have improved. Since 1970, the energy consumption of the average car and light truck (pickups, SUVs, and vans) have reduced their energy consumption by nearly 50 percent per mile.17 Fatality rates have also declined dramatically, dropping from more than 48 deaths per billion vehicle miles in 1970 to just 11 in 2019.18
Despite the failure of the Environmental Protection Agency’s anti-automobile strategy, Congress affirmed its efforts in the Intermodal Surface Transportation Efficiency Act (ISTEA) of 1991. This law encouraged transit agencies to spend billions of dollars to build transit systems that, a few years earlier, had been deemed obsolete by almost everyone in the transit industry. It also created perverse incentives for cities to allow congestion to increase in order to try to force people out of their automobiles and onto transit.19 The act also provided funds (to which many cities gladly added their own) to provide incentives for people to move to the inner cities or into high-density, transit-oriented developments where, planners hoped, they would be more likely to ride transit and less likely to drive.
The supply-driven strategy in the Intermodal Surface Transportation Efficiency Act, which was continued in later reauthorizations, failed as badly as the Environmental Protection Agency’s 1970s efforts to discourage driving. The tens of billions spent on transit failed to significantly increase transit ridership. The number of transit trips taken by the average urban resident each year fell from 49 in 1970 to 37 in 2019. Transit’s share of commuting fell from 8.5 percent in 1970 to 5.0 percent in 2019. The amount of time urban commuters wasted in traffic nearly tripled between 1982 (the earliest year for which data are available) and 2017, yet people still drove despite the congestion.20 The small fluctuations in transit ridership that did take place were more in response to temporary economic shocks (such as the 2008 financial crisis) and variations in fuel prices than to transit subsidies or congestion.
Another policy that became popular in the 1990s was earmarking. Members of Congress discovered that they could be seen as heroes when they earmarked money that transportation formula funds had already designated for their states toward specific projects that weren’t high on the priority lists of state or local officials. The people who wanted the projects were thrilled and few other people realized that the earmarks were reducing the effectiveness of transportation spending by dedicating money to low-priority projects. Fortunately, earmarks were banned in 2011.21
The COVID-19 pandemic has brought the successes and failures of federal transportation policy into sharp relief. Motor vehicles and highways have proven to be, by far, the most resilient form of transportation we have. April 2020 lockdowns reduced driving to about 60 percent of 2019 levels, but driving rates recovered to nearly 90 percent of pre-pandemic levels by June.22 April transit ridership fell to 16 percent of 2019 levels and by October had only recovered to 37 percent of what it had been in 2019.23 Air travel and Amtrak ridership fell to less than 5 percent of 2019 levels in April 2020, and by October, air travel carried 36 percent while Amtrak carried only 25 percent of their 2019 levels.24
Most important, the pandemic has completely undermined efforts to make high-density, transit-oriented housing appealing or to make transit ridership attractive. The people to whom these efforts were addressed—young, upwardly mobile professionals—are now working from home, and many may never go back to their offices. The rail transit projects designed to attract these professionals have suffered the greatest losses in ridership. Although some of those riders will undoubtedly return to using transit, per capita transit ridership is likely to be far lower after the pandemic than it was before.
Modal Evaluation: Highways
Highways and motor vehicles are America’s great success story. The United States had more than 4 million miles of roads in 2019, of which 2.9 million were paved, making it possible for motor vehicles to get just about anywhere in the country (except, of course, Hawaii and the island territories).25 Americans enjoy more than 15,000 miles of automobile travel per capita each year, which is more than the travel by all modes combined by people of any other country on Earth.26
One of the factors that made automobiles so successful was that they could use existing infrastructure. By 1900 there were only about 8,000 automobiles in the country, but the nation already had more than 2.3 million road miles, which gave new auto owners plenty of places that they could go.27
For many years, major road improvements were paid for by user fees, thus creating a feedback relationship: the more people drove, the more money there was to spend on road building and maintenance, and hence, and better roads were available. In 1919, Oregon became the first state to dedicate gasoline taxes to roads, and by 1931 every other state had followed Oregon’s example. In 1956, Congress dedicated federal excise taxes on fuel, vehicles, and tires to roads, initially funding construction of the Interstate Highway System.
The interstates have proven to be the backbone of the nation’s transportation system. Although interstate highways comprise just 2.3 percent of total lane-miles of U.S. roads, they support well over 25 percent of motor vehicle travel.28 Roughly 20 percent of all passenger-miles, and nearly 20 percent of all freight-ton-miles, take place on interstate highways.29
Unfortunately, the feedback relationships between motor vehicle users and highway producers were weakened in 1982, when Congress began diverting 20 percent of all increases in federal gas taxes to urban transit. Many states followed suit: 19 percent of federal highway user fees and 28 percent of state highway user fees were diverted to nonhighway programs in 2018.30 The resulting shortfall in highway funds led Congress to supplement federal highway user fees with $51.9 billion in general funds in 2016, which were intended to cover a five-year period. The use of general funds for highways further weakens the ties between users and producers.
These diversions correspond to the general shift from demand-driven to supply-driven transportation policy. Instead of improving the transportation system that people use the most, legislators are effectively taxing the users of that transportation system to fund systems that people hardly use. Nevertheless, America’s highway infrastructure is in excellent condition. Although the American Society of Civil Engineers’ infrastructure report card gives highways a D grade and bridges a C+ grade, these low grades are not supported by the actual data.31
The Federal Highway Administration requires states to regularly inspect bridges and highways. Bridges are graded to be in “good,” “fair,” or “poor” condition.
In 1992, out of the more than 600,000 highway bridges in the country, about 124,000 (20 percent) were considered to be in poor condition.32 Since that time, state and local governments have repaired or replaced most of those bridges so that, in 2019, only 46,000 (7.5 percent) of bridges were in poor condition.33
Only 2.2 percent of bridges owned by toll authorities were in poor condition in 2019. Some 5.3 percent of bridges owned by state highway authorities, which are largely funded out of fuel taxes and other highway user fees, were in poor condition. By contrast, 11.6 percent of bridges owned by city and county governments, whose transportation agencies are funded largely out of property or sales taxes, were in poor condition.34
Similar results are found by scrutinizing data regarding highway conditions. Highway engineers measure the roughness of pavement using an index in which a lower number corresponds to smoother pavement. The roughness index for all types of roads has steadily declined, indicating that road conditions are improving across the board. Moreover, the smoothest roads tend to be those that are owned by states or by toll road authorities, while roads that are locally owned (and therefore funded more out of tax dollars than user fees) tend to be the roughest.35
Agencies whose funding comes from tolls have a strong incentive to maintain their infrastructure because motorists often have a choice of routes and won’t pay a toll to drive on poorly maintained roads. Agencies funded out of other highway user fees have a similar incentive, although it is not as strong, while agencies funded out of taxpayer dollars have little incentive to keep their infrastructure maintained because their tax revenues will continue to come in even if their roads are in terrible shape.
While user fees result in better-maintained infrastructure, there are several problems with using excise taxes to pay for roads. First, unlike income, sales, and property taxes, excise taxes do not automatically adjust for inflation. Since 1993, the last time the federal gas tax was increased, inflation has reduced the value of gas tax revenues by 43 percent. Second, fuel taxes do not automatically adjust for the use of fuel-efficient cars, and since 1993 the average car has become 39 percent more fuel-efficient.36
Third, and perhaps most important, fuel taxes do nothing to relieve congestion. Roads have a unique attribute: when they are full, their throughput declines. A typical freeway lane can move 2,000 vehicles per hour in free-flowing traffic, but additional vehicles cause traffic to slow and throughput can decline to fewer than 1,000 vehicles per hour. This can generate several hours of stop-and-go traffic even if the number of vehicles seeking to use the lane exceeds 2,000 per hour for only a short time.
This is why urban highways continue to appear chronically congested even after road expansions: the roads are not utilized to their full capacity because few states have adopted any mechanisms for preventing users from trying to force too many vehicles on the roads. One way to relieve congestion is to build more roads, but this is inefficient because the roads will be used to just half their capacity during the times when demand is highest. Another way is to physically limit entry to the roads to ensure that they never exceed their rated flow capacity, but this would be expensive and controversial.
A third way would be to price the roads properly, which is also controversial. However, this controversy can be reduced if people understand that proper road pricing will effectively double the throughput of roads during peak periods. In other words, road pricing will not price people off the roads so much as it will price them onto the roads because it will increase the number of people who can use them during rush hour.
One way to improve road pricing is to completely replace gasoline taxes with mileage-based user fees. Oregon and other states are experimenting with such fees.37 Congress could encourage more states to do so, perhaps by giving states with such programs a small increase in formula highway funds. Mileage-based user fees will be especially controversial if motorists believe that the states will divert some of those fees to nonhighway programs, so to make such fees acceptable states should write provisions into their constitutions that require all such fees, along with vehicle registration fees and other highway user fees, to go only toward roads.
It is worth noting that the United States has about 67,000 miles of freeways, while China, in just two decades, has built 93,000 miles; it is building five new freeway miles a year for every mile built in the United States and paying for them with tolls.38 New freeways in the United States would not only relieve congestion, they would improve highway safety: the safest roads we have (measured by fatalities per billion vehicle miles) are urban freeways, while non-freeway arterials are the most dangerous roads we have, so converting non-freeway arterials to freeways would save thousands of lives a year.39 While we shouldn’t build freeways simply because China is building them, we should recognize what Chinese officials clearly understand: freeways improve mobility, increase safety, and boost general economic development by enabling travel and shipping that would not have taken place without them.
Automobile ownership is almost universal in America. Census data show that 91.4 percent of households have at least one automobile.40 In addition, 95.7 percent of workers live in a household with access to at least one automobile, and nearly a third of the 4.3 percent who don’t own a car nevertheless commute to work by automobile, either in a carpool or with a borrowed car (such as a vehicle supplied by their employer).41 Still, Department of Transportation data indicate that about 7 million low-income households lack access to an automobile.42
Studies show that the best intervention for helping people out of poverty, as it relates to transportation, is by providing access to an automobile. “Car ownership is a significant factor in improving the employment status of welfare recipients,” say University of California–Los Angeles planners Paul Ong and Ellen Blumenberg.43 Helping the poor, say Yale economist Katherine O’Regan and University of California–Berkeley economist John Quigley, means “promoting the mass transit system that works so well for the nonpoor—the private auto.”44
One Portland study finds that people without a high-school diploma are 80 percent more likely to have a job and earn $1,100 more per month if they have a car. In fact, the study reports that owning a car is more helpful to getting a job than getting a high-school degree or equivalent.45 Another study by University of California researchers finds that closing the black-white auto ownership gap would close nearly half the black-white employment gap.46 A 2014 study published by the Urban Institute concluded that low-income families with cars found better jobs, had better housing, and were less likely to fall back into poverty. The study urged that poverty programs be coordinated with “transportation programs in ways that enhance the upward mobility of low-income households.”47
Automobile access works better at helping low-income people than free transit services because automobiles give people access to more jobs and other economic opportunities, low-cost consumer goods, and better housing. The University of Minnesota’s Accessibility Observatory finds that the typical resident of the nation’s largest urban areas can reach 44 times as many jobs in a 20-minute auto drive as they can in a 20-minute transit ride.48 Transit, incidentally, is so inconvenient that even a reasonably competent bicycle rider can reach more jobs in 50 minutes or fewer than someone spending the same amount of time on transit.49
For these reasons, some nonprofit groups have programs that help provide low-income people with low-interest loans specifically for buying cars. These groups find that auto loan recipients end up with more satisfying, higher-paying jobs and reduce their dependence on various welfare programs.50 “Ownership of a private automobile is a key element of success in obtaining the ‘assets’ of independence: job training or education, a good job, health care, child care, social supports, and even self-esteem and family/community relationships,” one study found.51
The pandemic has had an interesting effect on motor vehicle traffic. As of September 2020, total vehicle travel exceeded 90 percent of September 2019 levels. Yet, with millions of people working from home, there are no clear rush hours. Morning traffic is much lower than it was before the pandemic, while traffic between noon and 5 p.m. is higher than before the pandemic, and that traffic continues into the evening with no clear highest-volume period. If large numbers of people continue to work from home after the pandemic, rush hour stop-and-go traffic may not be as serious a problem as it was before, but other factors will still contribute to road congestion. Whatever the future holds, more effective road pricing, such as variable-priced toll roads or mileage-based user fees, will still help prevent traffic slowdowns.
Modal Evaluation: Airlines
Air travel is another American success story. Domestic airlines moved Americans more than 2,200 passenger-miles per capita in 2018.52 In terms of per capita use, this amounts to significantly more air travel than any other country or region in the world, and it makes air travel the second most important form of personal mobility in the nation.53
Congress once subsidized airlines and airport construction, but most subsidies ended in 1970.54 Today, government air travel subsidies are mainly intended for providing supposedly essential air services to smaller communities.
Airlines have an advantage over other forms of travel in that they require minimal infrastructure. When air travel was just beginning, the only ground resources required were open fields for launching and landing planes. As air travel and revenue grew, airlines could afford to pave runways and add air terminals. After air traffic reached high enough levels, air traffic control was also necessary.
Early airlines often operated flights with several intermediate stops. Today, however, most airlines operate with hub-and-spoke systems and most flights are nonstop, either between two hubs or between a hub and the end of a spoke. This allows airlines to scale their services between any two points with different flight frequencies and sizes of planes. Before the pandemic, airlines filled an average of 85 percent of seats per flight.55 This made them more efficient than systems such as Amtrak, which, due to numerous intermediate stops on all of its routes, filled only 51 percent of its seats pre-pandemic.56 In addition, planes use the same basic infrastructure whether they go to Atlanta (which saw more than 105 million passengers get on or off planes in 2019), or Koyuk, Alaska (which saw fewer than 5,000 passengers in 2019).57 This means that the marginal cost of adding new routes or destinations is low.
Fifty years ago, airfares averaged 39 cents (in today’s dollars) per passenger-mile, or 50 percent more than rail fares, which averaged 26 cents per passenger-mile. By 1990, the airlines had reduced their average fares to 26 cents per passenger-mile while rail fares had increased theirs to 27 cents. As of 2018, airfares had dropped further—to fewer than 14 cents per passenger-mile—while rail fares had gone up again, this time to nearly 37 cents.58 The real reductions in airfares reflect air’s minimal infrastructure needs compared with rail and other forms of ground travel.
The Department of Transportation stopped estimating rates of noncommercial air travel, otherwise known as general aviation, after 2001. In that year, noncommercial planes carried 15.9 billion passenger-miles, or about 55 miles per capita.59 Assuming passenger-miles were at least that high in 2019, that is about the same number of per capita miles that Americans spent on bus transit.60
Modal Evaluation: Buses
The Federal Highway Administration estimates that buses carried Americans 388 billion passenger-miles in 2018, or almost 1,200 miles per person.61 However, this is probably the least-reliable number in the Highway Statistics book because it is based on a model of questionable validity: when the model was updated in 2009, the reported passenger-miles for buses between 2008 and 2009 more than doubled—going from 151 billion to 304 billion—even though bus vehicle miles hardly changed.
It seems likely that the lower number was more accurate. Buses include transit buses, which in 2018 carried about 19 billion passenger-miles;62 school buses, which carried about 50 billion passenger-miles;63 motorcoaches, including intercity buses and charter buses, which traveled about 65 billion passenger-miles;64 and shuttle buses, such as airporters and parking lot shuttles to air terminals. No one has estimates for the latter’s passenger miles, but in order for the 388 billion estimate to be correct they would have to total almost twice the passenger-miles of all the other buses combined.
If, as seems more likely, 150 billion passenger-miles is closer to the correct estimate for 2018, buses traveled about 450 passenger-miles per capita that year (of which about 57, as noted below, were by urban transit buses, leaving about 400 for other buses). This is more than any other form of travel other than autos and planes. While intercity buses only account for a small fraction of this total, they have undergone a renaissance of innovations that have reduced costs by shedding infrastructure.
Chinatown buses—buses owned by Chinese Americans that connected Chinatowns of major cities—stopped at curbsides rather than in elaborate bus terminals when they began operating in 1998. Megabus, which relies on internet ticket sales rather than using physical ticket offices, began operating in Europe in 2003 and in the United States in 2006. Flixbus, which doesn’t operate its own buses but contracts out services to other companies who agree to display the Flixbus brand, began operating in Europe in 2013 and in the United States in 2018. OurBus, which also contracts out buses but only requires operators to put minimal signage on buses (thus allowing their operators to use those buses for charter and other services easily when not working for OurBus), began operating in 2016.
Each of these innovations reduced operating costs and customer fares without reducing service quality. As a result, since 2006 intercity bus ridership has grown faster than any other form of travel.65 The lesson is that mass transportation can be profitable and successful so long as it minimizes the use of dedicated infrastructure—which is exactly the opposite of what urban transit and intercity passenger train advocates want to do.
Modal Evaluation: Public Transit
In 2018, transit carried the average American 165 miles, accounting for less than 1 percent of all passenger travel in the nation, and making up just 1.5 percent of urban travel. About 99 of these miles were by rail transit, 57 miles were by bus, and the remainder came from other forms of transit, such as paratransit (transit for elderly and disabled people), vanpools, and ferry boats.66
Urban transit became prominent in an age before cars, when most urban jobs were in the manufacturing sector and most manufacturing jobs were in the downtown areas of cities. Streetcar lines and, in a few cities, rapid transit (subway or elevated) lines radiated from these downtown hubs, allowing many people to take a one-ride trip to their jobs.
In 1913, Henry Ford’s moving assembly line made cars affordable to the working-class people who worked in downtown factories. The share of American families that owned automobiles grew from less than 5 percent in 1910 to more than 50 percent in 1926. More importantly, the large footprint required for assembly lines made factories too land-intensive to remain crammed in central business districts, so they were taken out of downtown areas and moved into other parts of the city. With jobs more scattered across the landscape, most people could no longer get to work in a one-ride transit trip, which made cars a faster and more convenient method of transit for most workers.
Another important technological development of the early 20th century was the motorized omnibus, or “bus” for short. The first buses were trucks with passenger bodies. They were less expensive to buy than streetcars but were more expensive to operate. This meant that, after about 1920, new transit services used buses, although existing streetcar lines were left in place.
In 1927, an Ohio company called Twin Coach developed the first bus that was both less expensive to buy and less expensive to operate than streetcars.67 By 1927 most streetcar systems in the country were around 30 to 40 years old and wearing out. Rather than spending the huge amounts of money required to rehabilitate them, transit companies gladly replaced them with buses. Within 10 years, more than 500 streetcar systems had been completely replaced by buses and most others had been partially replaced.68
The so-called General Motors streetcar conspiracy, which began in 1937, was an effort by General Motors to capture market share away from Twin Coach buses, not an effort to destroy a streetcar industry that was already dying.69 By 1975 only eight urban areas still had streetcar or rapid transit lines, and most of these had special circumstances, such as long tunnels, where diesel fumes were hazardous.
Per capita transit ridership peaked around 1920, when transit systems carried close to 290 trips per urban resident. Per capita ridership then began a slow decline, interrupted by World War II, but even then the per capita ridership did not rise to 1920 levels. After the war, the decline continued more rapidly and by 1960 ridership had fallen to 75 trips per urban resident. Still, because most transit systems remained private and therefore could be adjusted readily to consumer demand, the transit industry stayed profitable overall.70
Although bus transit was especially profitable, rail transit often was not because of its higher operating costs. In the 1960s, the railroads operating commuter trains in Boston, Chicago, New York, and Philadelphia moved to cancel those trains. But those cities still contained downtown jobs, and city officials feared that the disappearance of trains would lead to more jobs moving to the suburbs. They pressured Congress to subsidize the commuter trains on the grounds that at least some of them crossed state lines.
Congress agreed, but for political reasons was unable to develop a policy explicitly formulated to accommodate just four cities. It therefore passed legislation in 1964 offering funds to any state or local government that operated its own transit system. As a result, by 1970 most transit systems were federally funded and had been taken over by government agencies. Since then, federal, state, and local governments have spent more than $1.5 trillion (in 2020 dollars) subsidizing transit, with subsidies reaching $58 billion in 2019.71
Much of this spending has been enormously wasteful. Worker productivity in the transit industry has dropped by almost 60 percent as the number of transit riders carried per operating employee has fallen from more than 57,000 per year in 1964, the year before Congress began subsidizing transit, to less than 24,000 per year in 2018.72 At the same time, the inflation-adjusted operating cost of moving one passenger one mile has grown from less than $1 before federal transit subsidies to more than $5 today.73 Inflation-adjusted fares and other operating revenues (such as transit advertising) have also not kept pace with declining demand, growing from $1.04 in 1960 to $1.91 in 2018.74 As a result, industry-wide net operating revenues declined from more than $200 million (in today’s dollars) in 1960 to a shortfall of $35 billion in 2019.75
One of the ways in which transit agencies waste money is by building expensive rail transit lines that had already been acknowledged as obsolete before the federal government offered funding for them. Since 1975, the number of urban areas with rail transit systems has grown from 8 to 40.76 Agencies build rail transit, not because it is economical, but because it is expensive and allows them to capture as many federal dollars as possible. The Federal Transit Administration has made little effort to ensure that rail transit projects are cost-effective. The average inflation-adjusted cost of constructing light rail has grown from around $20 million per mile in the 1980s to well over $200 million per mile today.77
While transit agencies pay lip service to helping low-income commuters, the reality is that rail transit is primarily aimed at middle-income commuters. Department of Transportation data show that bus transit riders tend to have lower incomes, while rail transit riders tend to have higher incomes.78 As a result, the median income of transit riders today is higher than the median income of people who commute by any other mode, including those who drive alone.79
Almost every rail transit project built since 1970 has suffered large cost overruns. To help pay for those overruns, agencies usually raise bus fares and/or cut bus service. This can cost them more bus riders than they gain in rail riders. For example, between 1985 and 1996, Los Angeles Metro built three light rail lines and cut bus routes, losing six bus riders for every rail rider it gained. The NAACP sued, charging that building light rail into white neighborhoods while cutting bus service to black and Hispanic neighborhoods was discriminatory. Los Angeles Metro agreed to restore its bus services for 10 years, during which bus ridership returned to its 1985 levels. After the 10-year period concluded, the Los Angeles Metro built more light rail lines and again cut bus service, thereby losing almost seven bus riders for every rail rider gained.80
The Census Bureau’s 2019 American Community Survey found that only 5 percent of workers whose annual incomes were less than $25,000 took transit to work, while nearly 7 percent of workers whose annual incomes were more than $75,000 commuted by transit. Moreover, a comparison with 2010 survey data reveals that in 2019, low-income workers were less likely to take transit to work while high-income workers were more likely to take transit to work than they had been in 2010.81 And because at least three-quarters of transit subsidies come from regressive taxes, such as sales or property taxes, 95 percent of low-income workers are disproportionately paying for transit rides that are mainly being taken by high-income workers.82
In addition to making transit inefficient, subsidies have also taken away any incentives for transit agencies to innovate. Their idea of innovation is to install early 20th-century transit technologies and subsidize the construction of high-density housing in order to promote the restoration of early 20th-century lifestyles. When confronted with true innovation, such as the development of app-based ride hailing, many transit agencies respond by demanding that ride hailing be taxed in order to compensate the agencies for lost riders.83
The political distribution of transit funds has also resulted in too much money going into building new transit lines and not enough going into maintaining existing ones. The Department of Transportation estimates that up to 36 percent of transit facilities—mostly rail transit—are in poor condition, and that replacing them will cost $174 billion.84 Unlike bridges and highways, whose conditions generally improve each year, the condition of transit facilities has declined steadily because transit agencies fail to allocate the maintenance money necessary to prevent further deterioration.
Per capita transit ridership since 1970 has fluctuated from more than 50 trips per urban resident in 1985, to 38 trips in 1995, to 43 trips in 2008.85 These fluctuations are due more to external factors, such as the price of gasoline and the state of the economy, than to transit subsidies. Gas prices dropped after 2014, leading per capita transit trips in 2019 to fall to 37, the lowest since predecessors of the American Public Transportation Association (a transit lobby group) began keeping track in 1890. While transit remains important in New York, all of the hundreds of billions in subsidies have failed to prevent transit from becoming ever more irrelevant in the lives of people elsewhere in the country.
Modal Evaluation: Walking and Cycling
The 2017 National Household Travel Survey asked people how many miles a day they traveled by various modes, including walking and cycling. This included walking or cycling to destinations such as shops or work, but not as exercise, dog walks, or walks to and from transit stops. Based on the survey, Americans walked an average of 104 miles per year and cycled an average of 26 miles per year.86 This means that Americans walk more miles than they ride rail transit and they ride bicycles for more miles than they do Amtrak.
The 2019 American Community Survey estimates that about 4.2 million people walk to work and 800,000 people bicycle to work. Bicycle commuters outnumber light rail commuters by more than three to one, while about 40 percent more people walk to work than take rapid transit.87
A popular movement in many American cities seeks to encourage walking and cycling by discouraging driving. Sometimes called complete streets or road diets, these projects typically require converting multi-vehicle lanes of arterial streets into dedicated bike lanes and sometimes widening sidewalks. Planners hope that the resulting congestion, combined with the apparently increased safety for cyclists, will increase cycling. Bills have been proposed in Congress to require that 5 percent of federal highway funds be spent on such activities.88
There is little evidence that these programs work. Most of the cities with high rates of bicycle commuting, including Boulder, Palo Alto, Cambridge, Berkeley, and Eugene, are college towns with a young population.89 In other words, demographics, not street design, has the greatest influence on cycling and walking. Congress should not endorse unproven programs such as complete streets or road diets.
Cities can make cycling and walking safer by using techniques that don’t increase congestion for auto users. For example, cyclists are much safer on bicycle boulevards than they are on bike lanes in arterial streets. Bicycle boulevards are local streets that have small barriers that allow through bicycles but do not allow through auto traffic. Bicycle boulevards should not have stop signs at intersections with other local streets but should have safe crossing systems at intersections with arterial and collector streets.90
Modal Evaluation: Amtrak
Amtrak carried Americans an average of just 19 miles per capita in 2018.91 Americans bicycle more than they ride Amtrak and they fly well over 100 times as many miles as they ride Amtrak. Despite receiving billions of dollars in subsidies, Amtrak is, by any reasonable measure, a complete failure.
Amtrak was created in 1970 in the wake of the Penn Central bankruptcy. Amtrak’s genesis was based on two mistakes. First, Congress thought that railroads were in trouble because of money-losing passenger trains and so creating Amtrak would solve the problem. This proved false when railroads continued to struggle and the Milwaukee Road went bankrupt in 1977, eventually being completely liquidated. The real problem for railroads was government overregulation, and Congress finally solved that problem with passage of the Staggers Act in 1980.92
Second, as previously noted, passenger train advocates such as Anthony Haswell thought that passenger trains could be made profitable and further believed that government ownership could restore ridership to 1950 levels, or more than triple what they were in 1970.93 Thirty years later, Haswell admitted his mistake. “Amtrak has cost the taxpayers a lot more than $20 billion,” he wrote in 2001, but “they have gotten back a pretty skimpy return.” As a result, he concluded, “I am personally embarrassed by what I helped to create.”94
In November 2019, Amtrak reported that its operating revenues covered 99 percent of its operating costs and that it was on track to earn an operating profit in 2020.95 Obviously, the pandemic interfered with these projections, but Amtrak was never going to earn a profit anyway because the numbers it reported were deceptive in two ways.
First, Amtrak counted $234 million of taxpayer subsidies from the states among its “operating revenues.” By this reasoning, its trains could be profitable even if no one rode them, provided the state subsidies were high enough.
Second, when counting its operating costs, Amtrak left out the second-largest line item on its books: depreciation. Depreciation is listed as an operating cost in its audited financial statements, which show that depreciation was $870 million in 2019.96 Amtrak officials dismiss depreciation as “meaningless to measure financial performance.”97 Yet depreciation is a very real cost that represents the work that must be done to keep infrastructure and equipment in sound condition.
While other operating costs, including labor, fuel, and advertising, represent the expenses that must be paid each year, depreciation represents costs that can fluctuate. Railcars and locomotives, for example, have expected lifespans of 20 to 30 years, and infrastructure must be periodically rehabilitated. Depreciation represents the annual amount of money that must be spent or set aside to pay for such replacement and rehabilitation. Such expenditures are needed to maintain reliability and revenues, and as such, they are operating costs.
Amtrak dismisses depreciation as a cost and then expects the federal government to fund equipment replacement and infrastructure rehabilitation out of capital budgets, effectively claiming that depreciation is a capital improvement, not an operating cost. Yet replacing aging equipment and rehabilitating worn-out infrastructure are definitely not capital improvements, which are made to increase, not maintain, revenues.
Although the expected lifespan of a passenger railcar is fewer than 30 years, the average car in Amtrak’s fleet was nearly 33 years old in 2019.98 Amtrak claims that its Northeast Corridor earns an operating profit, but the corridor has a $52 billion maintenance backlog.99 Amtrak’s fantasy that depreciation is “meaningless” allowed these backlogs to develop.
After subtracting taxpayer subsidies from states and depreciation from Amtrak’s supposed net operating revenues, its losses in 2019 were well over $1.1 billion. Ticket revenues and food and beverage sales were only $2.4 billion, accounting for only about two-thirds, not 99 percent, of its costs.
Nor did Amtrak come close to restoring its ridership to 1950 levels. In 1970, private railroads carried 6.2 billion passenger-miles. By 2019, Amtrak managed to surpass that rate by less than 5 percent, carrying less than 6.5 billion passenger-miles. During that time the nation’s population grew by 62 percent, so per capita intercity train ridership fell from more than 30 miles to fewer than 20 miles.
Modal Evaluation: High-Speed Rail, MagLev, and Hyperloop
In 2009 and 2010, Congress appropriated $10.1 billion for high-speed rail projects across the country, to which the Obama administration added $1.4 billion in other funds and states added at least $7 billion. Except in California, this money wasn’t expected to produce true high-speed trains (i.e., trains traveling faster than 150 miles per hour), but it was expected to increase the frequencies and speeds of passenger trains in 10 different corridors.
Of these, the most expensive is California’s high-speed rail project, which has suffered huge cost overruns and left the state with no money to complete it.100 As of the end of 2019, almost nothing had been accomplished in the other nine corridors either: train frequencies had increased in only one corridor, while speeds had increased by between 0.4 and 4.3 miles per hour in three corridors, remained static in three, and actually declined in the other three corridors.101 The one corridor where both frequencies and speeds were increased carried 12 percent fewer riders in 2019 than in 2009. High-speed rail has proven to be a huge money sink that produces few benefits.
Advocates of high-speed rail often claim that the United States is losing the international race to have the fastest passenger service. The United States had already won that race in 1958 when Boeing introduced the 707 jet plane, which was twice as fast as the fastest trains are today. The early jetliners were expensive, but high-speed rail is expensive as well. Since then, air travel costs have declined but rail costs have grown.
Neither Asia nor Europe has seen high-speed trains make significant inroads into driving or flying. When Japan introduced its bullet trains in 1964, trains carried more than six times as many passenger-miles as automobiles.102 By 2015, Japan’s rail travel had grown by 58 percent, but its auto travel had grown by almost 2,200 percent, so that autos carried well over twice as many passenger-miles as trains.103 In China, between 2000 and 2018, private passenger car ownership and auto travel grew by nearly 25 percent per year—far faster than rail travel—which grew at 9 percent per year.104
European countries that have high-speed trains have seen only minor increases in rail’s share of surface passenger travel. Most of those increases have been at the expense of intercity buses, not automobiles. For example, Spain has Europe’s largest high-speed rail network and between 2009 and 2018 rail’s share of passenger travel grew from 5.4 percent to 7.1 percent. But auto’s share also grew, up from 81.4 to 84.9 percent, while bus travel declined from 13.3 to 8.0 percent.105 Meanwhile, air travel in Europe has been growing far faster than auto travel. For example, between 2014 and 2017, air travel within the European Union grew by 23 percent while rail travel grew by only 5 percent.106
As of the end of 2019, China had built 22,000 miles of high-speed rail lines. But it also had built 93,000 miles of freeways and is adding to that at the rate of more than 5,000 miles a year.107 This is far more than the 67,000 miles found in the United States, whose freeway system is growing at only about 800 miles a year.108 China has about the same number of motor vehicles as the United States—some 270 million.109 People concerned about a transportation gap between China and the United States should worry more about the freeway gap than the railway gap.
If Asian and European high-speed rail riders weren’t previously auto users or airline users, what form of transportation did they take? The answer: lower-speed rail. The nations with large high-speed rail programs, including Japan, China, France, and Spain, already had a sizable number of conventional train riders, and most of their high-speed rail passengers had previously been riding conventional trains. The United States, by contrast, has almost no conventional train riders for high-speed trains to draw upon.
High-speed rail, magnetically levitated trains, hyperloop, monorail, and similar technologies all suffer from the same fatal flaw: they require large amounts of costly, specialized infrastructure. Much of the reason automobiles became popular in America was that they could use the 2.3 million miles of roads that already existed, and commercial air travel was possible because it required so little initial infrastructure. Both were able to incrementally add to and improve their infrastructure, mainly out of user fees, as demand grew.
In contrast, high-speed rail and similar technologies all require their own expensive infrastructure, which must be built and maintained to high standards of precision. The cost of this infrastructure is so high that, unlike the Interstate Highway System or modern airports, there is no chance that user fees could pay for it.
For example, in 2013 a company called Texas Central proposed a high-speed rail line between Dallas and Houston, predicting that such a line would attract six million riders per year.110 The projected cost of constructing the line is $30 billion.111 If amortized over 30 years, that cost averages $255 per rider. Operating costs would add about $100 more. Meanwhile, American, Southwest, and United Airlines offer nonstop flights between Dallas and Houston for under $100. The Texas Central high-speed rail could not compete with the airlines without keeping its fares too low to cover capital costs.
The next transportation revolution will not be one that requires expensive new infrastructure but one that can use existing infrastructure. That revolution will be driverless cars. As Ford, GM, Tesla, Waymo, and other companies are already planning, these cars will operate on the same roads as human-driven cars. The transition from completely human-driven to completely driverless automobiles may take more than a decade, but if it succeeds, it will do so by making travel faster, safer, and more convenient without requiring any new infrastructure.
Subsidies and User Fees by Mode
Advocates of transportation subsidies frequently claim that because transportation in the rest of the world is subsidized no one should question subsidies in the United States. This isn’t true: highways in Europe are highly profitable for the governments that run them because the fuel taxes they collect are several times greater than the amounts of money they spend building and operating the roads. Japan’s main intercity passenger railroads, JR Central, JR East, and JR West, are all profitable, as are several private railroads in Switzerland. Transit systems in Tokyo and Hong Kong also earn a profit. America’s freight railroads are the most profitable and least subsidized railroads in the world.
Even to the extent that many forms of transportation are subsidized, it is worthwhile asking whether those subsidies are cost-effective. If users aren’t willing to pay most of the costs of their own transportation, why should taxpayers pay those costs? Table 1 shows the user fees and subsidies per passenger mile of four major modes of transportation: highways, airlines, urban transit, and Amtrak. Highway and airline subsidies typically average about a penny per passenger mile.
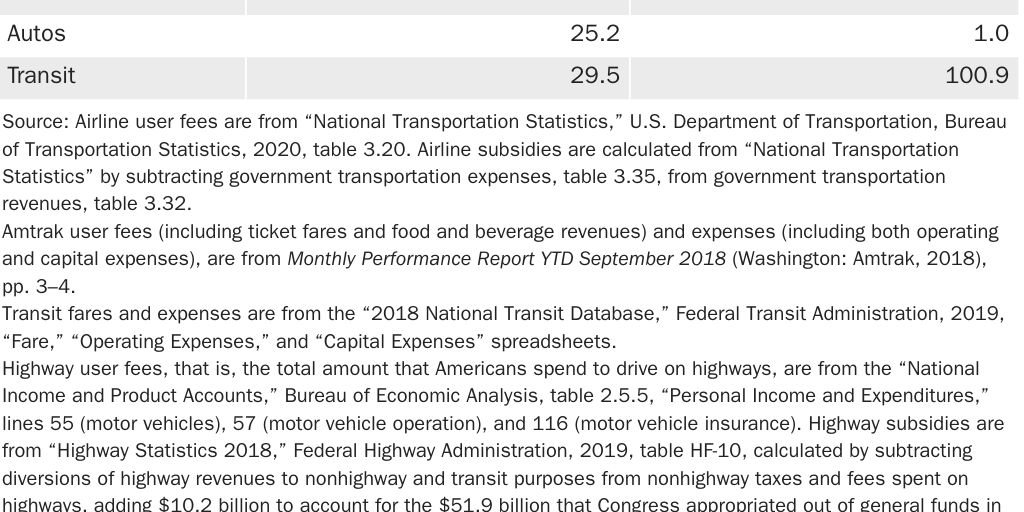
Table 1 shows that there are huge differences in subsidies among modes. Amtrak subsidies per passenger mile are almost 50 times greater than subsidies to the airlines. Transit subsidies per passenger mile are more than 100 times greater than subsidies to auto drivers. These subsidies might be justified if Amtrak and transit were rapidly growing, but they aren’t: transit ridership is declining and Amtrak ridership is stagnant.
Learning from the Pandemic
The COVID-19 pandemic and associated lockdowns affected all forms of transportation, but some more than others. In April 2020, Amtrak and the airlines lost 95 percent of their customers and transit ridership went down by 84 percent, while driving had declined by only 40 percent. Driving had recovered to 87 percent of pre-pandemic levels in June and more than 90 percent in September; Amtrak ridership remained below 25 percent, while transit and the airlines were at just 37 percent in October.
Clearly, members of the public preferred private transportation in automobiles over any form of mass transportation. But this also demonstrates the incredible resiliency of motor vehicles and highways over other forms of transportation in the face of any kind of natural or economic disaster.
Unlike various forms of mass transportation, highway operations are not labor intensive. They need routine maintenance, but in the event of a recession or natural disaster, the highways are available for use without the supplemental subsidies that Amtrak and transit agencies are demanding. During a natural disaster, such as a wildfire or hurricane, highways can provide the fastest means of evacuating an area and allow for the rapid deployment of rescue and recovery forces. With more than 4.1 million miles of roads, motor vehicles often have several alternative routes, so damage to one road by an earthquake or other disruption is less likely to halt the delivery of critical services.
The Camp Fire, which burned in northern California in 2018, demonstrated the importance of having resilient transportation. After the town of Paradise had been threatened by a wildfire in 2008, a Butte County grand jury report recommended that the city improve its evacuation routes. Instead, the city put its only four-lane road on a road diet, reducing it to two lanes. When the Camp Fire burned through the city in 2018, 85 people died. Some of them burned to death in their cars while stuck in traffic.112
Transit defenders have responded to transit’s pathetic performance by claiming that it carries essential workers to their jobs, with the strong implication that cities would somehow fall apart if it weren’t for transit.113 In fact, no one really knows who is still riding transit, but it is clear that, outside of perhaps New York City, the vast majority of essential workers is not taking transit to work: fewer than 4.2 percent of workers in every income class took transit to work in 2019.114 Almost no one who was driving to work in 2019 responded to COVID-19 by deciding to take transit to work instead; if anything, people who were taking transit switched to driving.115 This means less than 5 percent of essential workers are taking transit to work during the pandemic.
While the pandemic will eventually end, it is likely to have long-term effects on society in general and transportation in particular. The number of people who work from home in the future will be dramatically higher than the number who worked from home in 2019.116 People who work from home don’t necessarily drive less, but they do drive less during rush hours, and so rush hour traffic is likely to remain at reduced levels even after the COVID-19 restrictions are lifted.
Since 5 percent of commuters took transit to work before the pandemic, for every hundred additional people who continue to work from home, at least five fewer people will commute by transit. In fact, the reduction will possibly be more than five because the high-income people who are able to work from home were 40 percent more likely than low-income workers to commute by transit before the pandemic. As a result of this reduction in rush-hour congestion, a secondary effect will be that some commuters who formerly took transit to avoid congestion before the pandemic may switch to driving after the pandemic.
The pandemic has also led many people to move out of crowded cities and into lower-density suburbs, smaller towns, or exurbs.117 Even before the pandemic, a Gallup poll found that 40 percent of people living in dense, big cities wished they could live elsewhere, while more people wanted to live in low-density suburbs and exurbs than actually lived there.118 The pandemic has accelerated decentralization of both jobs and residences, which will reduce transit ridership further because mass transit doesn’t work well in decentralized areas. Even among the people who stay in big cities after the pandemic, many are likely to remain wary of other possible diseases and thus likelier to prefer driving over urban transit, including for short intercity trips.
As a result of all of these factors, even the most optimistic projections state that transit will never get back more than 90 percent of the riders it had before the pandemic.119 At least one transit agency predicts that ridership will only be 60 to 75 percent of what it was before the pandemic.120 Given predictions that working from home will increase from its level of 5 percent in 2019 to 25 to 30 percent, the latter estimates are more realistic.121
The preference for private transportation will extend to short-distance intercity trips as well. This will severely diminish Amtrak ridership because the average Amtrak trip length is less than 200 miles. It will also reduce short-distance air travel but have less of an effect on long-distance travel.
Lessons from Two Centuries of Transport Policy
The above history of federal transportation policy and transportation uses offers several important lessons that should be taken into consideration when implementing zero-based transportation policies. To the extent that the government needs to be involved in transportation at all, it is most successful when it provides the transportation facilities that people actually want and use and it is almost completely unsuccessful in trying to nudge people into using alternative forms of transportation for supposed social or environmental reasons. Efforts to save energy, clean the air, and increase safety by getting people out of their automobiles and onto other forms of transport have historically failed. Instead, these primary objectives can be achieved by making more efficient, cleaner, and safer automobiles, highways, airplanes, and air traffic control systems.
The pay-as-you-go policy that was used during construction of the Interstate Highway System has greater efficacy and produces better outcomes than borrowing or deficit spending in anticipation of future trends or benefits that may never be realized. Pay-as-you-go policies ensure that projects that get built are truly needed and worthwhile: if users aren’t willing to pay for them, then they probably aren’t worthwhile.
Accessibility data collected by University of Minnesota researchers show that urban transit is second-class transportation. Social justice doesn’t require giving the transit industry subsidies in hopes of the benefits trickling down to low-income commuters and travelers; social justice requires giving low-income people access to the same first-class transportation that everyone else uses.
Transportation subsidies lead to poorly maintained infrastructure because new construction is more politically popular than maintenance. Transportation subsidies reduce incentives for transportation agencies to act efficiently because they are backed by special interests that benefit from inefficient programs and they can simply requisition more money to make up for wasteful spending. Transportation subsidies further reduce incentives for transportation agencies to innovate because the agencies can fall back on increased subsidies to counter innovations from competitors.
Conclusion
Based on these lessons from history, Congress should consider nine specific changes to incorporate into the 2021 surface transportation reauthorization bill before it expires in September 2021.
First, Congress should end deficit spending and limit federal spending on surface transportation to actual revenues from highway excise taxes. Second, Congress should keep the prohibition against earmarks, which merely reduce the efficiency of how states spend their funds. Third, it should abolish New Starts, Small Starts, BUILD, and other competitive grant programs that give state and local governments incentives to spend too much money building obsolete transportation systems that they can’t afford to maintain.
Fourth, Congress should incorporate state and local user fees—meaning gas tax revenues, vehicle registration fees, tolls, mileage-based user fees (only if their funds are spent on highways), and transit fares (only if their funds are spent on transit)—into formulas for the distribution of federal funds. This will encourage state and local governments to rely more on user fees for their own transportation programs.
Fifth, Congress should encourage states to use user fees to relieve congestion and improve traffic safety by building new freeways. One way to do this would be to apply a share of federal highway user fees to a new freeway construction program—Interstate 2.0—to which the states would have to supply matching funds out of their own user fees.
Sixth, rather than making futile attempts to get people to reduce driving and air travel, Congress should focus instead on promoting increases in efficiency and safety of automobiles and airplanes.
Seventh, Congress should encourage states to explore the use of low- or zero-interest loans to help low-income people buy cars so they can expand their personal mobility and reduce their poverty.
Eighth, Congress should encourage states to increase the resiliency of their highway systems by maintaining, not reducing, road capacities and by planning reversible lanes for rapid evacuation in the event of natural disasters.
Ninth, given the uncertainties created or highlighted by the COVID-19 pandemic, Congress should minimize the initiation of new capital projects that may not be necessary, including high-speed rail, Amtrak expansions, and urban rail transit.
Citation
O’Toole, Randal. “Zero-Based Transportation Policy: Recommendations for 2021 Transportation Reauthorization,” Policy Analysis no. 913, Cato Institute, Washington, DC, March 16, 2021. https://doi.org/10.36009/PA.913.

About the Author


This work is licensed under a Creative Commons Attribution-NonCommercial-ShareAlike 4.0 International License.